WHAT HAVE WE LEARNT? Overview of findings from a survey of ministries of education on national responses to COVID-19 - Image
←
→
Page content transcription
If your browser does not render page correctly, please read the page content below
O CTOBER 2020

    WHAT HAVE
    WE LEARNT?
    Overview of findings from a survey of
    ministries of education on national
    responses to COVID-19

for every child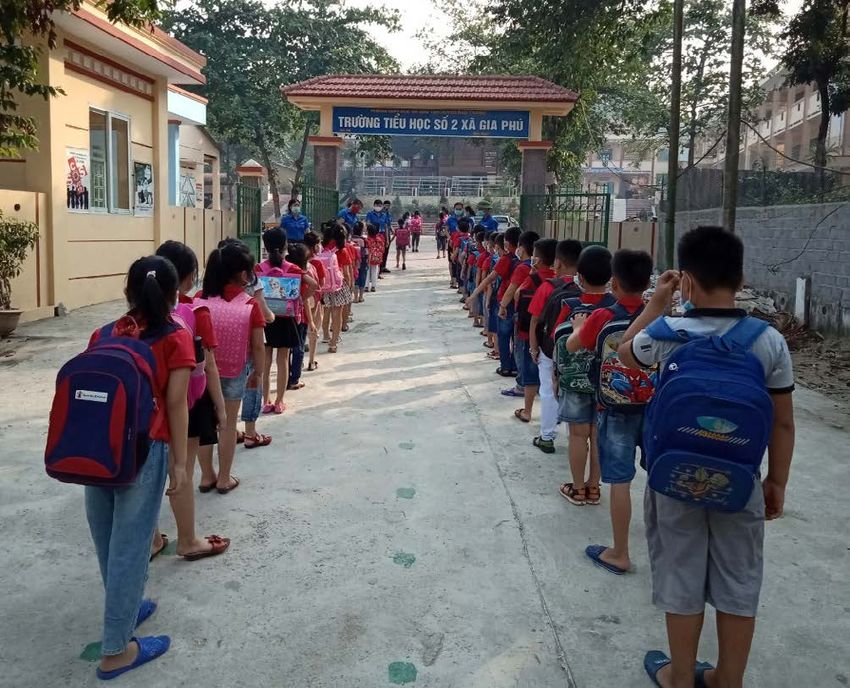
WHAT HAVE
 WE LEARNT?
Overview of findings from a survey of
 ministries of education on national
       responses to COVID-19
                 O CTOBER 2020

        for every child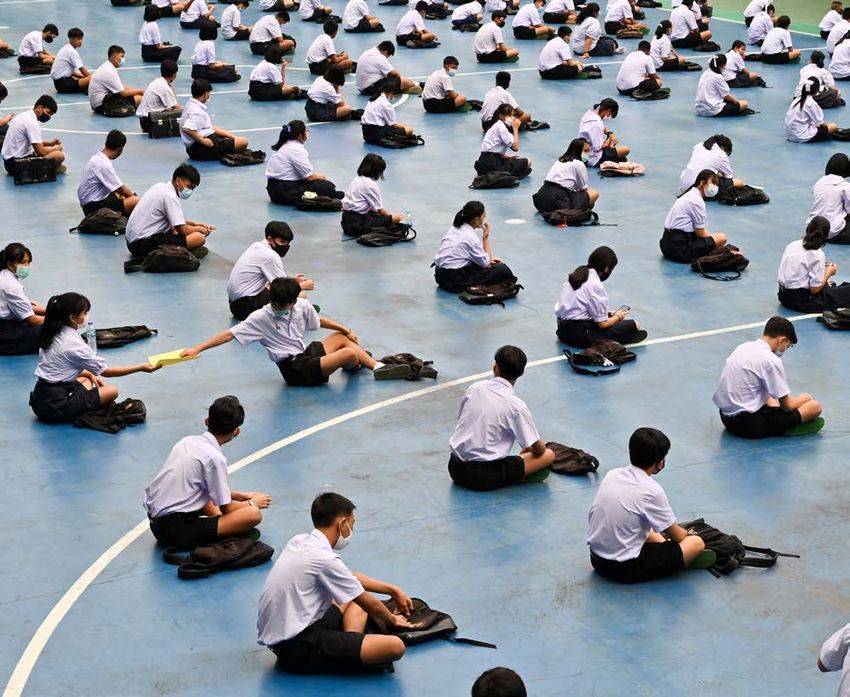
Published in 2020 by:
the United Nations Educational, Scientific and Cultural Organization,
7, place de Fontenoy, 75352 Paris 07 SP, France,
United Nations Children’s Fund,
3 United Nations Plaza, New York, NY 10017, USA,
UNICEF Office of Research – Innocenti,
Via degli Alfani, 58, 50121 Florence, Italy,
and the International Bank for Reconstruction and Development / The World Bank
1818 H Street NW, Washington, DC 20433, USA
© UNESCO, UNICEF and The World Bank, 2020
This publication is available in Open Access under the Attribution-ShareAlike 3.0 IGO (CC-BY-SA 3.0 IGO) license (http://
creativecommons.org/licenses/by-sa/3.0/igo/). By using the content of this publication, the users accept to be bound by the
terms of use of the UNESCO Open Access Repository (http://www.unesco.org/open-access/terms-use-ccbysa-en). The present
license applies exclusively to the text content of the publication. For use of any other material (i.e. images, illustrations, charts) not
clearly identified as belonging to UNESCO or as being in the public domain, prior permission shall be requested from UNESCO at
publication.copyright@unesco.org.
UNICEF Photographs—UNICEF photographs are copyrighted and are not to be reproduced in any medium without obtaining prior
written permission from UNICEF. Permissions may be granted for one-time use in a context that accurately represents the real
situation and identity of all people depicted. UNICEF photographs are not to be used in any commercial context; content may not
be digitally altered to change meaning or context; assets may not be archived by any non-UNICEF entity. Requests for permission
to reproduce UNICEF photographs should be addressed to nyhqdoc.permit@unicef.org.
Attribution—Please cite the report as follows: UNESCO, UNICEF and the World Bank (2020). What have we learnt? Overview of
findings from a survey of ministries of education on national responses to COVID-19. Paris, New York, Washington D.C.: UNESCO,
UNICEF, World Bank. Please cite the data as follows: UNESCO, UNICEF and the World Bank (2020). Survey on National Education
Responses to COVID-19 School Closures, round 2. Paris, New York, Washington D.C.: UNESCO, UNICEF, World Bank.
Translations—If you create a translation of this work, please add the following disclaimer along with the attribution: This translation
was not created by UNESCO, UNICEF or The World Bank and should not be considered an official UNESCO, UNICEF or World Bank
translation. UNESCO, UNICEF and the World Bank shall not be liable for any content or error in this translation.
Adaptations—If you create an adaptation of this work, please add the following disclaimer along with the attribution: This is an
adaptation of an original work by UNESCO, UNICEF and The World Bank. Views and opinions expressed in the adaptation are the
sole responsibility of the author or authors of the adaptation and are not endorsed by UNESCO, UNICEF and The World Bank.
The designations employed and the presentation of material throughout this publication do not imply the expression of any opinion
whatsoever on the part of UNESCO, UNICEF and the World Bank concerning the legal status of any country, territory, city or
area or of its authorities, or concerning the delimitation of its frontiers or boundaries. The ideas and opinions expressed in this
publication are those of the authors; they are not necessarily those of UNESCO, UNICEF and the World Bank and do not commit
the organizations.
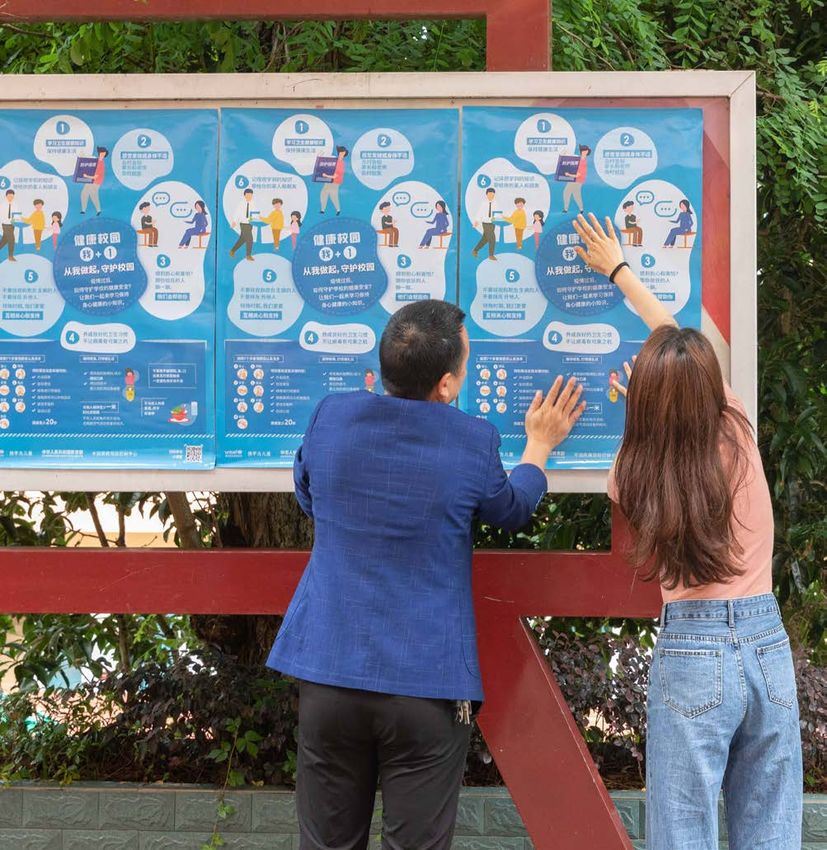
Cover photos (top to bottom, left to right): © UNICEF/UNI330879/Dejo; © UNICEF/UNI336263/Ma; © UNICEF/UNI313272/Matas; ©
UNICEF/UNI330862/Dejo; © UNICEF/UNI369509/Chuluunbaata; © UNICEF/UNI336259/Ma; © UNICEF/UNI355643/Gacad/AFP
Designed by Big Yellow Taxi, Inc.
W H AT H AV E W E L E A RN T ? 2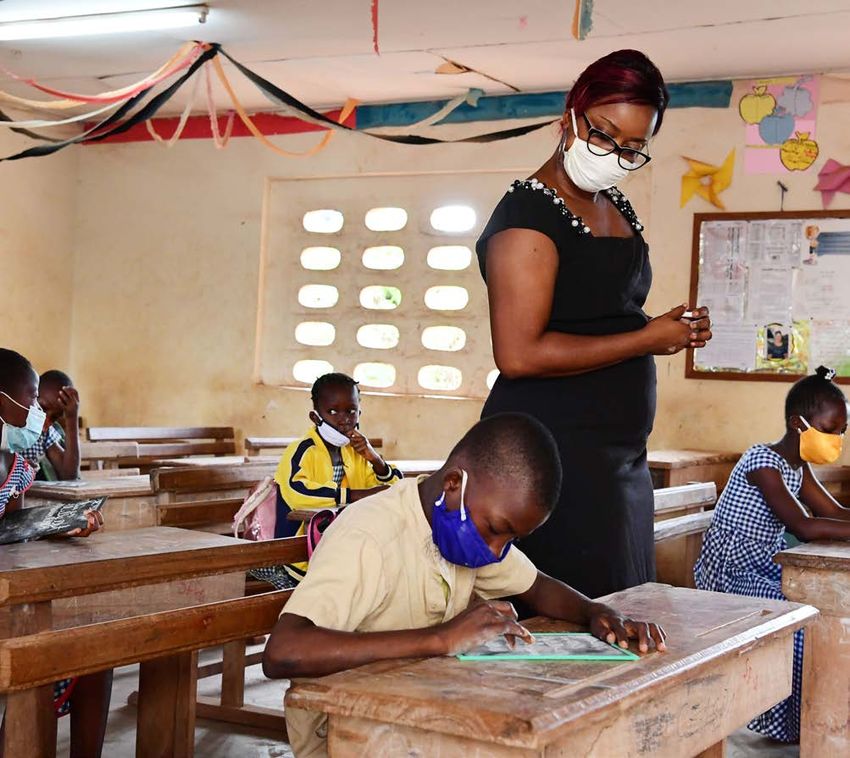
ACKNOWLEDGEMENTS
                                 First and foremost, the United Nations Educational, Scientific and Cultural Organization
                                 (UNESCO), the United Nations Children’s Fund (UNICEF) and the World Bank would like
                                 to thank all the ministries of education that contributed to this data collection effort. These
                                 survey results enable the sharing of experiences and good practices during the world’s largest
                                 global experiment in education. We would also like to thank the contributors to the UNICEF
                                 Education Thematic Fund for their support and the Global Partnership for Education (GPE) for
                                 the support provided through their accelerated funding response to the COVID-19 Pandemic.

                                 This report was prepared by the following colleagues: UNESCO Headquarters (Sonia
                                 Guerriero, Cynthia Guttman, Sam Pairavi, Maya Prince, Sobhi Tawil, Thu Truong, Peter
                                 Wallet), UNESCO Institute for Statistics (Adolfo Gustavo Imhof, Yifan Li, Silvia Montoya),
                                 UNICEF Headquarters (Pragya Dewan, Sakshi Mishra, Suguru Mizunoya, Oscar Onam,
                                 Nicolas Reuge, Annika Rigole, Georgina Thompson, Ann Marie Wilcock, Haogen Yao,
                                 Jean Luc Yameogo), UNICEF Office of Research – Innocenti (Matt Brossard, Thomas
                                 Dreesen, Akito Kamei, Anindita Nugroho, Marco Valenza) and the World Bank (Melissa Ann
                                 Adelman, Samer Al-Samarrai, João Pedro Azevedo, Kaliope Azzi-Huck, Juan Baron, Diana
                                 Goldemberg, Amer Hasan, Maria Rebeca Barron Rodriguez, Kristyn Schrader-King, Tigran
                                 Shmis, Marianne Joy Anacleto Vital). Copyediting was done by Nancy Vega (UNICEF).

                                 NOTES ON THE USE OF DATA IN THIS REPORT
                                 This report presents findings from the Survey of National Education Responses to COVID-
                                 19, jointly conducted by UNESCO, UNICEF and the World Bank, and administered by
                                 the UNESCO Institute of Statistics. Two rounds of questionnaires have thus far been
                                 administered by the UNESCO Institute for Statistics (UIS).1 This report focuses on
                                 responses to the survey’s more recent second round.2

                                 All numbers presented and discussed in this report refer to the share of countries that responded
                                 to each relevant question in the survey. The number of countries that provided valid responses to
                                 the question are noted in each figure. Where relevant, the distinction between countries that were
                                 excluded for selecting “Do not know” or had a missing response are provided in figure notes.

                                 Unless otherwise noted, we reported only the indicators where respondents represent
                                 at least 50 per cent of the school-aged (4-to-17-year-old) student population. Detailed
                                 information on the country and student coverage of each figure, including by income
                                 group, is available in Annex 1.

                                 In each country, the survey questionnaire was completed by Ministry of Education
                                 officials responsible for education planning at the central or decentralized levels. The
                                 survey instrument was designed to capture de jure policy responses and perceptions
                                 from government officials on their effectiveness, providing a systematic understanding of
                                 deployed policies, practices and intentions to date. When reading the survey findings, it
                                 is important to keep in mind that the questions on policy responses do not capture how
                                 well they are being implemented and their scope in terms of the proportion of children (or
                                 teachers) reached in the country, which can vary significantly across countries. It is also
                                 likely that, when answering the survey, the understanding of the scope of the education
                                 system (public versus public and private) varied depending on countries/respondents.
                                 1 The survey data and questionnaire are available at: tcg.uis.unesco.org/survey-education-covid-school-closures/
                                 2 The second round of the survey captured responses from 149 countries between July and October 2020. In some instances where common
                                   questions were asked across both rounds of the survey, the analysis also included responses to the first round of the survey which
                                   captured responses from 118 countries (90 countries responded to both rounds). These instances are noted in the relevant figure’s notes.

3   W H AT H AV E W E L E A RN T ?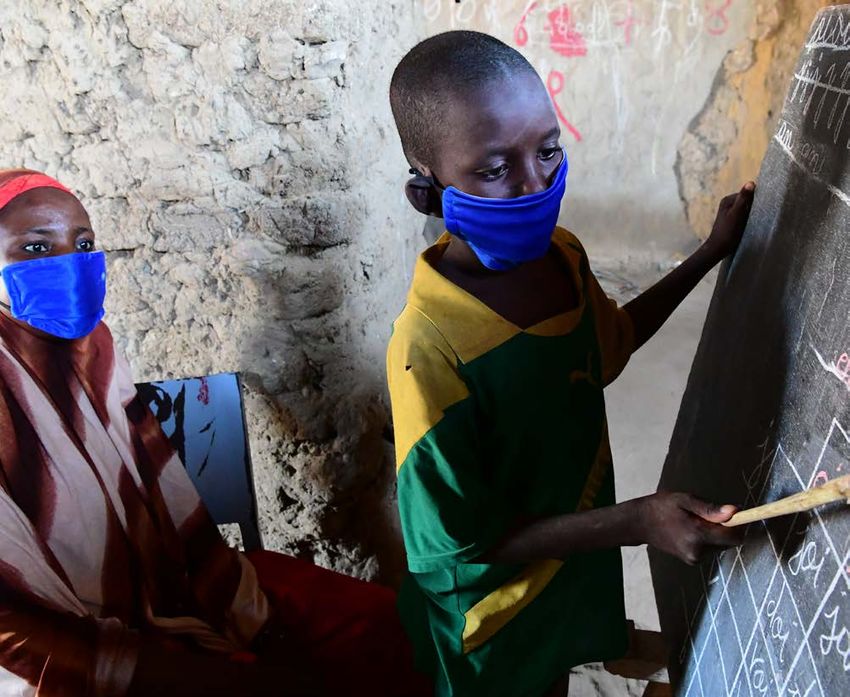
© UNICEF/UNI336263/MA

                        EXECUTIVE SUMMARY

                        A
                                     s part of the coordinated global education response to the COVID-19                UNESCO, UNICEF and the
                                     pandemic, UNESCO, UNICEF and the World Bank have conducted a                       World Bank have conducted
                                     Survey on National Education Responses to COVID-19 School Closures. In
                                                                                                                        a survey to 149 ministries
                                     this joint report, we analyse the results of the first two rounds of data
                                     collection administered by the UNESCO Institute for Statistics (UIS). They         of education on their
                                     cover government responses to school closures from pre-primary to                  responses to COVID-19.
                        secondary education. The first round of the survey was completed by Ministry of
                        Education officials of 118 countries between May and June 2020, and the second
                        round from 149 countries between July and October 2020. The survey instrument was
                        designed to capture de jure policy responses and perceptions from government officials
                        on their effectiveness, providing a systematic understanding of deployed policies,
                        practices, and intentions to date.

                        MONITORING AND MITIGATING LEARNING
                        LOSSES FROM SCHOOL CLOSURES
                        The duration of school closures varies greatly between countries. Beyond tracking the
                        number of days of in-person teaching and learning lost, some countries are also making
                        efforts to measure the extent of learning lost during school closures. As schools reopen,
                        countries are also introducing supports to remediate this learning loss.

                                                                                                                    W H AT H AV E W E L E A RN T ?   4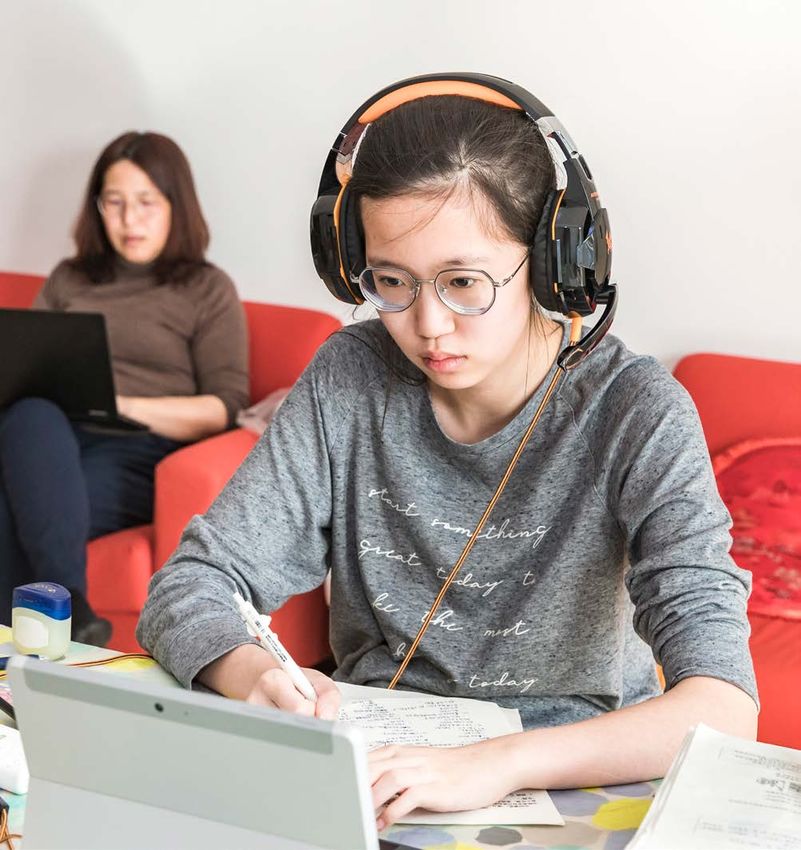
© UNICEF/UNI355643/GACAD/A FP
                                 Key highlights on the extent of days lost to school closures and how countries are
                                 assessing and mitigating these losses include:

                                     1.   Lost opportunities for learning: Overall, 108 countries reported missing an
                                          average of 47 days of in-person instruction due to school closures by the time
                                          of the survey,3 equivalent to approximately one quarter of a regular school year.
                                          Countries where the academic year was still ongoing at the time of the survey
                                          reported more days of instruction lost (54 days) on average compared to those
                                          where the academic year had finished at the time of the survey (40 days).

                                     2.   Learning Assessments: While most countries (86 per cent) reported that
                                          student learning is being monitored by teachers, there are large differences
                                          across income groups. Only 3 per cent of high-income countries reported that
                                          student learning progress is not tracked by teachers, compared to around
                                          a quarter of low- and lower-middle-income countries. As schools reopen,
                                          most countries reported assessing or planning to assess students through
                                          school-based assessments but not in a systemwide way. At the primary level
                                          specifically, the vast majority of countries did not perform or were not planning
                                          systemwide assessments, either nationally or sub-nationally, as schools reopen.
                                          This will impede their ability to measure learning losses comprehensively and
                                          against expected student learning trajectory.

                                     3.   Reopening support to remediate learning loss: Most countries which responded
                                          the survey (84 per cent) introduced additional support programmes to
                                          remediate learning loss as schools were reopening. Across all income groups,
                                 3 Answers were received from July 15, 2020 to October 15, 2020, with August 20, 2020 as average date.

5   W H AT H AV E W E L E A RN T ?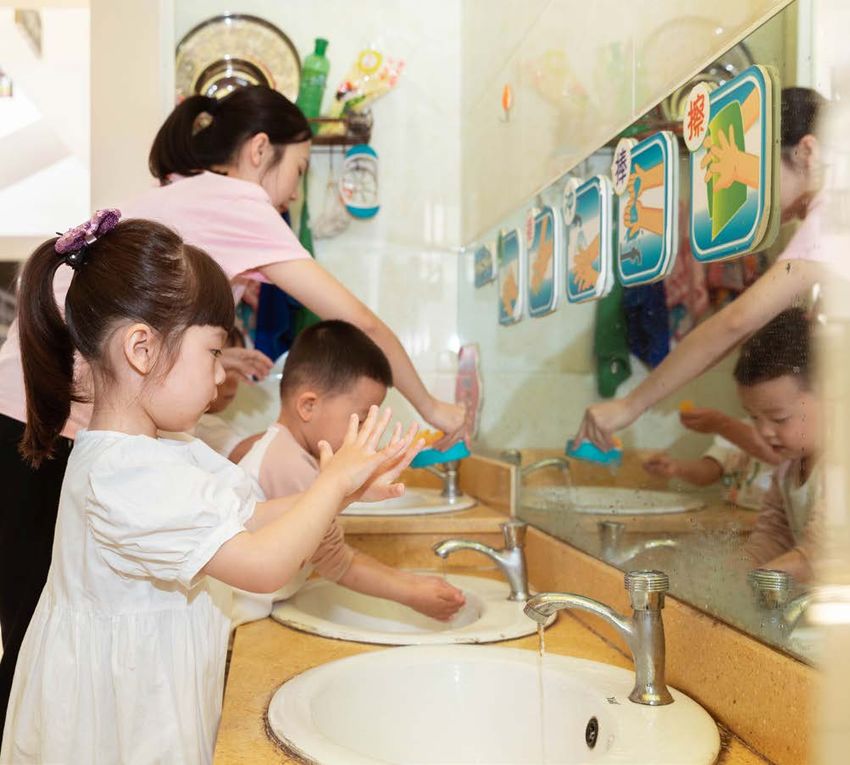
© UNICEF/UNI394582/DEJONGH

                                   but particularly among low-income countries, this most frequently took the form
                                   of remedial programmes to help -at least a proportion of- students catch up.
                                   Meanwhile, one in four high-income countries were not introducing any additional
                                   support measures. While high-income countries were also more likely to consider
                                   remote learning a substitute to official school days (as discussed further in the
                                   report), school closures can lead to learning losses and widen the achievement
                                   gap even in high-income settings.

                             DEPLOYING EFFECTIVE DISTANCE LEARNING STRATEGIES
                             As schools closed around the world to limit the spread of COVID-19, governments
                             moved quickly to offer remote learning options, including through online platforms,
                             television, radio and paper-based take-home packages. Recognizing that these options
                             are not equally available to all, countries also made efforts to boost access to these
                             platforms and to support teachers and parents/caregivers.

                             Key highlights from these countries’ reports on how they are deploying distance learning
                             and related support include:

                              4.   Remote learning modes and effectiveness: Almost every country that responded
                                   to the survey reported the inclusion of remote learning in its education response
                                   to COVID-19, using online platforms, TV/radio programmes and/or take-home
                                   packages. Online learning has been provided as a solution -for at least a
                                   proportion of students- in all high-income countries, but not as uniformly among
                                   countries in the other income groups. Almost three-quarters of countries reported
                                   that remote learning days count as official school days. However, this was the
                                   case among only one in five low-income country respondents.

                                                                                                                       W H AT H AV E W E L E A RN T ?   6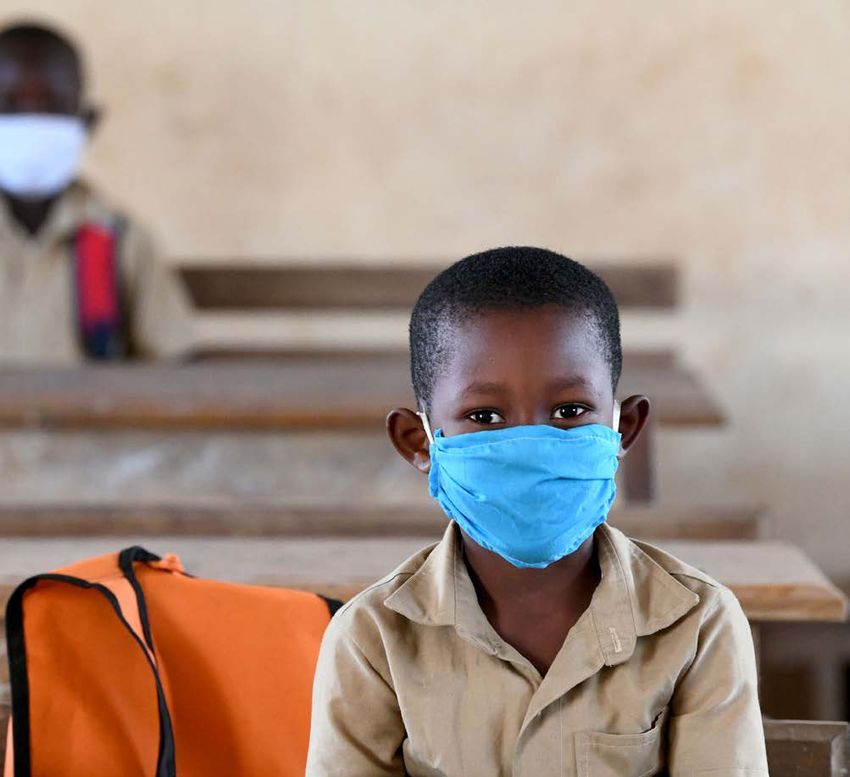
5.   Policies to boost access to online learning: Most countries that responded to the
                                          survey (89 per cent) have introduced at least one measure to increase access to
                                          the devices and connectivity needed for online learning. This most frequently took
                                          the form of making access available from mobile devices or offering internet access
                                          at subsidized/no cost. Most countries (91 per cent) have also taken measures to
                                          support populations at risk of being excluded from distance learning platforms,
                                          most commonly learners with disabilities. However, over 30 per cent of low-income
                                          countries were not introducing any measure to support access or inclusion.

                                     6.   Policies to support teachers: Three-quarters of responding countries reported that
                                          teachers were required to continue teaching during school closures, with significant
                                          differences by income group. Over 90 per cent of high- and upper-middle-income
                                          respondents, compared to 60 per cent of lower-middle-income and 39 per cent
                                          of low-income respondents, required their teachers to continue working. Globally,
                                          most countries encouraged teachers to interact with students and parents by using
                                          messaging apps. More than half of high-income countries have recruited or are
                                          recruiting additional teachers to support remote learning or reopening. Most countries
                                          (89 per cent) that responded to the survey offered support to teachers, although one
                                          in five low-income countries did not. This support most frequently took the form of
                                          instruction on how to deliver lessons through distance learning

                                     7.   Policies to support parents and caregivers: Around three-quarters of countries
                                          that responded to the survey have measures in place to support parents/
                                          caregivers, although more than a third of low-income countries had not
                                          introduced learning-related measures. The most frequently used measures
                                          are the provision of guidance, tips or materials for continued learning at home.
                                          More than a third of high- or middle-income countries were supporting parents/
                                          caregivers through regular telephone follow-up by schools, but this was reported
                                          by only 22 per cent of low-income countries.

                                 REOPENING SCHOOLS SAFELY FOR ALL
                                 The timing of and strategies for reopening schools varies between countries. Although
                                 almost all countries have prepared health and hygiene guidelines to support safe
                                 school reopening, the implementation of these protocols and the other aforementioned
                                 supports will require additional resources. Almost all participating countries required
                                 additional financial resources to cover COVID-19-related costs in the education sector.
                                 Countries relied on various sources to meet this need and foresee that upcoming
                                 education budgets will be impacted.

                                 Key highlights on how countries plan to reopen schools safely and finance the necessary
                                 measures to address the impact of COVID-19-related school closures include:

                                     8.   School reopening plans: In September 2020, 73 per cent of countries had fully
                                          or partially reopened schools, and a further 5 per cent had reported a future
                                          reopening date. Others either missed previously set dates for reopening or did not
                                          report reopening dates. High-income countries were more likely to have reopened
                                          schools and more likely to have done so utilizing a hybrid approach that combines
                                          distance learning and in-person teaching. Meanwhile, low-income countries were
                                          more likely to have delayed school reopening and plan to return to full in-person
                                          teaching and learning.

7   W H AT H AV E W E L E A RN T ?
9.   Health protocols during school reopening: Across all income groups, almost all
      responding countries have produced or endorsed specific health and hygiene
      guidelines and measures for schools. The vast majority of these include the
      promotion of physical distancing, hand-washing practices and other measures to
      reduce exposure contact. However, less than one in five reported plans to test for
      COVID-19 at school. Overall, more than a quarter of countries reported not having
      enough resources to ensure the safety of all learners and school staff, with wide
      variations by income level. In low-income countries, this increased to 50 per cent,
      compared to just 5 per cent of high-income countries.

 10. Financing: Almost all countries (95 per cent) reported that additional financial
     resources were required to ensure an adequate response to COVID-19 for
     education. In at least three-quarters of responding low- and lower-middle-
     income countries, this support was provided by external donors. In contrast,
     more than three-quarters of high-income countries used additional allocation
     for education from the government. Reallocations within the education budget
     occurred in around two-thirds of middle-income countries and half of high-
     income countries. While only 19 per cent of the 79 responding countries have
     either already experienced or anticipate decreases to their country’s education
     budget for the current or next fiscal year, this was reported by more than a third
     of low- and lower-middle-income countries. More than a third of 72 responding
     countries indicated that they had increased government support to households
     in 2020-2021 or were expecting to do so.                                                   The survey results
                                                                                                illustrate how COVID-19
GOING FORWARD
                                                                                                may widen inequities
Despite varying durations of COVID-19-related school closures around the world,
the survey of national education responses to these closures shows the efforts that             between and within
countries have exerted to mitigate learning losses both during closure and after                countries.
reopening. The survey results illustrate how certain government responses to COVID-19
can widen inequities between and within countries, with school closure and reopening
experiences varying across income groups and with more or less capacity to be fully
inclusive. This survey is planned to become a regular endeavor supported by UNESCO,
UNICEF and the World Bank, and its next iterations will benefit countries by continuing
to allow them to share experiences that will better inform local and national responses
and prepare for school reopening.

Key areas that have been identified for further exploration include: monitoring student
drop out and disengagement, the continued role of distance learning, plans for
remediation and tracking of their effectiveness, new approaches to and the shifting
role of learning assessments, localizing decisions with regards to reopening schools,
effectiveness of health and safety measures, skills development and support to
teachers, and psycho-social supports to wellbeing and better mental health.

Going forward, in addition to perception and de jure surveys such as this one, more
in-depth qualitative research may be required in some areas to capture the impacts
of policy responses and interventions, and to support subsequent educational
planning and programming. In addition, robust evidence on household take-up of
these programs, implementation fidelity of the new policies and their effectiveness for
learning, using implementation science and impact evaluations, is critical.

                                                                                            W H AT H AV E W E L E A RN T ?   8
TABLE OF CONTENTS
      Acknowledgements ......................................................... 3                                       6. POLICIES TO SUPPORT TEACHERS. . . . 28
      Notes on the use of data in this report. . . . . . . . . . . . . . . . . . . . . . 3                                     Continued work at school premises. . . . . . . . . . . . . . . . . . . . . . . . 28
                                                                                                                               Supporting teachers in the transition to remote learning . 29
EXECUTIVE SUMMARY. . . . . . . . . . . . . . . . . . . . . . . . . . . . . . . . .                                 4           Interactions between teachers, students and their
      Monitoring and mitigating learning losses from                                                                           parents or caregivers .. . . . . . . . . . . . . . . . . . . . . . . . . . . . . . . . . . . . . . 29
      school closures. . . . . . . . . . . . . . . . . . . . . . . . . . . . . . . . . . . . . . . . . . . . . . 4
      Deploying effective distance learning strategies. . . . . . . . . . . . 6                                          7. PARENTAL SUPPORT. . . . . . . . . . . . . . . . . . . . . . . . . . 31
      Reopening schools safely for all. . . . . . . . . . . . . . . . . . . . . . . . . . . . . 7                              Support for parents and caregivers to improve the
      Going forward. . . . . . . . . . . . . . . . . . . . . . . . . . . . . . . . . . . . . . . . . . . . . . . . 8           home learning environment. . . . . . . . . . . . . . . . . . . . . . . . . . . . . . . . 31
                                                                                                                               Support for economic welfare and the psychosocial
                                                                                                                               wellbeing of families. . . . . . . . . . . . . . . . . . . . . . . . . . . . . . . . . . . . . . . . 32
INTRODUCTION . . . . . . . . . . . . . . . . . . . . . . . . . . . . . . . . . . . . . . . . . . 11
      The survey .. . . . . . . . . . . . . . . . . . . . . . . . . . . . . . . . . . . . . . . . . . . . . . . . . 12
      Organization of the report .. . . . . . . . . . . . . . . . . . . . . . . . . . . . . . . . . 12
                                                                                                                         REOPENING SCHOOLS SAFELY FOR ALL. . . . . . . . 33

MITIGATING LEARNING LOSSES. . . . . . . . . . . . . . . . . . . 13                                                       8. PLANS FOR REOPENING SCHOOLS. . . 34
                                                                                                                               Reopening status . . . . . . . . . . . . . . . . . . . . . . . . . . . . . . . . . . . . . . . . . . 34
                                                                                                                               Teaching and learning approach. . . . . . . . . . . . . . . . . . . . . . . . . . . 35
1. LOST OPPORTUNITIES FOR
LEARNING . . . . . . . . . . . . . . . . . . . . . . . . . . . . . . . . . . . . . . . . . . . . . 14                          Measures to manage school reopening. . . . . . . . . . . . . . . . . . . . 36

      School closures varied widely across the globe.. . . . . . . . . . . 14
                                                                                                                         9. HEALTH PROTOCOLS IN SCHOOLS. . . . 37
2. LEARNING ASSESSMENT AND                                                                                                     Prevalence and content of health and hygiene protocols . 37

MONITORING. . . . . . . . . . . . . . . . . . . . . . . . . . . . . . . . . . . . . . . . . . 16                               Resources to implement health and hygiene protocols. . . 38

      Learning monitoring by teachers . . . . . . . . . . . . . . . . . . . . . . . . . . 16
      Assessing student learning as schools reopen. . . . . . . . . . . . 17                                             10. EDUCATION FINANCING. . . . . . . . . . . . . . . . . . . 39
                                                                                                                               Provision of additional funds to cover COVID-19
                                                                                                                               related costs. . . . . . . . . . . . . . . . . . . . . . . . . . . . . . . . . . . . . . . . . . . . . . . . 39
3. APPROACHES TO MITIGATING
                                                                                                                               Reductions in government education budgets . . . . . . . . . . . . 39
LEARNING LOSSES.. . . . . . . . . . . . . . . . . . . . . . . . . . . . . . . . 19
                                                                                                                               Increased government support to households. . . . . . . . . . . . . 41

DEPLOYING EFFECTIVE REMOTE
LEARNING STRATEGIES. . . . . . . . . . . . . . . . . . . . . . . . . . . . . . . 20                                      CONCLUSION. . . . . . . . . . . . . . . . . . . . . . . . . . . . . . . . . . . . . . . . . . . . . . . 42
                                                                                                                               Areas to be explored further . . . . . . . . . . . . . . . . . . . . . . . . . . . . . . . 42

4. REMOTE LEARNING: MODES AND
EFFECTIVENESS. . . . . . . . . . . . . . . . . . . . . . . . . . . . . . . . . . . . . 21                                REFERENCES. . . . . . . . . . . . . . . . . . . . . . . . . . . . . . . . . . . . . . . . . . . . . . . 44
      Supply of remote learning during school closures. . . . . . . . . 21
      Perceived effectiveness of remote learning modalities. . . . 22                                                    ANNEX 1: COUNTRY AND POPULATION
      Remote learning as a supplement to schooling. . . . . . . . . . . . 23
                                                                                                                         COVERAGE IN EACH FIGURE. . . . . . . . . . . . . . . . . . . . . . . . 46

5. POLICIES TO BOOST ACCESS TO                                                                                           ANNEX 2: FINANCING DATA. . . . . . . . . . . . . . . . . . . . . . . . . 49
ONLINE LEARNING. . . . . . . . . . . . . . . . . . . . . . . . . . . . . . . . . 25
      Actions to improve connectivity. . . . . . . . . . . . . . . . . . . . . . . . . . . . 25
      Types and scope of online remote learning platforms . . . . 26
      Focus on learners at risk of being excluded from
      access to online learning . . . . . . . . . . . . . . . . . . . . . . . . . . . . . . . . . . 27

 9     W H AT H AV E W E L E A RN T ?
LIST OF FIGURES AND TABLES
FIGURE 1-1: School closures have varied by length, FIGURE 7-1: Policies to support parents/caregivers with
start date and moment in the academic year – the home learning environment, by income group. . . . . . . . 31
evidence from selected countries. . . . . . . . . . . . . . . . . . . . . . . . . . 14 FIGURE 7-2: Economic and wellbeing measures
FIGURE 1-2: Average days of instruction missed, by targeting families, by income group. . . . . . . . . . . . . . . . . . . . . . . . 32
income level.. . . . . . . . . . . . . . . . . . . . . . . . . . . . . . . . . . . . . . . . . . . . . . . . 15 FIGURE 8-1: School reopening status, by income group. . . . 34
FIGURE 1-3 Share of instruction days missed, by FIGURE 8-2: Countries that have set reopening dates,
income level.. . . . . . . . . . . . . . . . . . . . . . . . . . . . . . . . . . . . . . . . . . . . . . . . 15 by school level and income group.. . . . . . . . . . . . . . . . . . . . . . . . . 35
FIGURE 2-1 Learning monitoring by teachers, per cent FIGURE 8-3: Teaching and learning approaches as
of countries where student learning is not tracked, by schools reopen, by income group. . . . . . . . . . . . . . . . . . . . . . . . . . 35
income group. . . . . . . . . . . . . . . . . . . . . . . . . . . . . . . . . . . . . . . . . . . . . . . 17
FIGURE 8-4: Measures to manage school reopening,
FIGURE 2-2 Assessment of student learning as by income group. . . . . . . . . . . . . . . . . . . . . . . . . . . . . . . . . . . . . . . . . . . . 36
schools reopen, by level of education and level of the
assessment. . . . . . . . . . . . . . . . . . . . . . . . . . . . . . . . . . . . . . . . . . . . . . . . . 17 FIGURE 9-1: Measures for school health and hygiene
guidelines . . . . . . . . . . . . . . . . . . . . . . . . . . . . . . . . . . . . . . . . . . . . . . . . . . 37
FIGURE 3-1: Different approaches to limiting learning
loss, by income group. . . . . . . . . . . . . . . . . . . . . . . . . . . . . . . . . . . . . . 19 FIGURE 9-2: Countries with enough resources to
ensure school safety, by income group. . . . . . . . . . . . . . . . . . . . 38
FIGURE 4-1: Provision of remote learning modalities, by
income group. . . . . . . . . . . . . . . . . . . . . . . . . . . . . . . . . . . . . . . . . . . . . . . 21 FIGURE 10-1: Additional financial resources received
for education response to COVID-19, by source of
FIGURE 4-2: Perceived effectiveness of remote funding and income group . . . . . . . . . . . . . . . . . . . . . . . . . . . . . . . . 39
learning, by modality and income group. . . . . . . . . . . . . . . . . . . 23
FIGURE 10-2: Countries with budget declines in 2020-
FIGURE 4-3 Remote learning considered as official 21, by component and income group . . . . . . . . . . . . . . . . . . . . 40
school days and set to continue when schools
reopen, by income group. . . . . . . . . . . . . . . . . . . . . . . . . . . . . . . . . . . 24 FIGURE 10-3: Countries with increased government
financing in 2020-21, by income group group. . . . . . . . . . . . 41
FIGURE 5-1: Actions taken to improve connectivity, by
income group. . . . . . . . . . . . . . . . . . . . . . . . . . . . . . . . . . . . . . . . . . . . . . . 26 TABLE 1-1. Country and population coverage in each
figure. . . . . . . . . . . . . . . . . . . . . . . . . . . . . . . . . . . . . . . . . . . . . . . . . . . . . . . . 46
FIGURE 5-2 Types of online platforms teachers /
schools encouraged to use and subjects. . . . . . . . . . . . . . . . . . 26 TABLE 2-1. Number of countries that indicated
receiving additional funding, by source and income
FIGURE 5-3: Measures for students at risk of exclusion group. . . . . . . . . . . . . . . . . . . . . . . . . . . . . . . . . . . . . . . . . . . . . . . . . . . . . . . . 49
from remote learning, by income group.. . . . . . . . . . . . . . . . . . . 27
TABLE 2-2. Number of countries that indicated budget
FIGURE 6-1: Work requirement and recruitment declines wage bill or school feeding in 2020-2021,
of teachers and other educational personnel, by by income group. . . . . . . . . . . . . . . . . . . . . . . . . . . . . . . . . . . . . . . . . . . . 49
income group. . . . . . . . . . . . . . . . . . . . . . . . . . . . . . . . . . . . . . . . . . . . . . . 28
TABLE 2-3. Number of countries that indicated
FIGURE 6-2: Support provided to teachers, by income increased budget in 2020-2021, by income group. . . . . . . 49
group. . . . . . . . . . . . . . . . . . . . . . . . . . . . . . . . . . . . . . . . . . . . . . . . . . . . . . . . 29
FIGURE 6-3: Communication modalities between
teachers, students and their parents/caregivers. . . . . . . . . . . 30
W H AT H AV E W E L E A RN T ? 10© UNICEF/UNI330879/DEJO
INTRODUCTION
T
he COVID-19 pandemic has caused an unprecedented disruption of
education systems globally, affecting the lives of more than 1.5 billion
students and their families. Immediate policy responses were aimed at
ensuring continued curriculum-based learning through a range of remote
learning modalities including online, TV/radio, paper-based take-home
materials or other approaches. Governments reacted to the challenges of this
overnight transition to remote learning by trying to strengthen support to teachers and
by adjusting their assessment and examination policies. Specific measures were also
put in place to ensure the inclusion of populations at risk of being excluded from
distance learning platforms, as well as to support student wellbeing.
The anticipated duration of school closures was unknown and often depended on the
severity of the pandemic in the country and its sub-regions. Some 60 countries began
to reopen schools, even if only for some grades, as early as a few weeks following initial
country-wide school closures. In many of these countries, schools reopened for a short
period before the scheduled yearly academic break. As outlined in the Framework
for reopening schools4 (June 2020), reopening strategies put the health of students,
4 The Framework for reopening schools (June 2020) was developed jointly by UNESCO, UNICEF, the World Bank, World Food
Programme and UNHCR. The guidelines aim to inform the decision-making process regarding school reopening, support
national preparations and guide the implementation process, as part of overall public health and education planning
processes. https://www.unicef.org/documents/framework-reopening-schools
11 W H AT H AV E W E L E A RN T ?teachers and families first, with hygiene and safety measures determined based on the
latest scientific evidence available.
There is much to learn from this initial experience of school reopening. At the end of
September 2020, almost half of the global student population worldwide still faced
lengthy school closures extending to over six consecutive months (UNESCO, 2020e).
This remains a major concern, as without in-person classes, and the social space
and services that schools offer, further learning loss, disengagement and dropout will
likely increase.
THE SURVEY
As part of the coordinated global education response to the COVID-19 pandemic, the
United Nations Educational, Scientific and Cultural Organization (UNESCO), the United
Nations Children’s Fund (UNICEF) and the World Bank began a monitoring Survey on
National Education Responses to COVID-19 School Closures. Thus far, two rounds of
questionnaires have been administered by the UNESCO Institute for Statistics (UIS).
The first round of the survey was completed by Ministry of Education officials of 118
countries between May and June 2020, and the second round from 149 countries
between July and October 2020.5 The survey instrument was designed to capture de
The COVID-19
jure policy responses and perceptions from government officials on their effectiveness,
providing a systematic understanding of deployed policies, practices, and intentions pandemic has caused
to date. The survey results will help to better inform local and national responses and an unprecedented
to prepare for school reopening in other countries. The results will also help support
disruption of education
the decisions and actions of partners in support to governments, including through the
Global Education Coalition launched by UNESCO.6 systems globally,
affecting the lives of
The survey questionnaires were completed by Ministry of Education officials in charge
more than 1.5 billion
of education planning at central or decentralized levels and covers national education
responses to COVID-19 school closures from pre-primary through secondary education. students and their
As such, the questionnaires do not cover higher education or technical and vocational families.
education and training.
ORGANIZATION OF THE REPORT
This report presents key findings from the second round of the UNESCO-UNICEF-
World Bank survey, although in some cases data from the first round was also used.
The first section addresses the potential learning losses implied by school closures,
as well as policies to assess and remediate them. The second section addresses
the various distance learning modalities deployed and the policies and strategies
implemented to ensure their effectiveness, including policies to support teachers and
parents and to boost access to and effectiveness of online learning. The third section
addresses safe reopening strategies for all students and other system-level responses
such as financing.
5 The second round data were received from 149 countries in the following regions: Central and Southern Asia (9), Eastern and
South-eastern Asia (15), Europe and North America (32), Latin America and the Caribbean (31), Northern Africa and Western
Asia (19), Sub-Saharan Africa (32) and Oceania (11). Data from both rounds is available at: tcg.uis.unesco.org/survey-
education-covid-school-closures/
6 The Global Education Coalition launched by UNESCO, is a platform for collaboration and exchange to protect the right
to education during this unprecedented disruption and beyond. It brings together more than 140 members from the UN
family, civil society, academia and the private sector to ensure the continuity of learning. Coalition members rally around
three flagships, namely connectivity, teachers and g ender.
W H AT H AV E W E L E A RN T ? 12MITIGATING LEARNING LOSSES © UNICEF/UNI336259/MA
A
fter the World Health Organization declared COVID-19 a pandemic in
March 2020, many countries moved to close down their schools. At the
peak of school closures in early April, over 90 per cent of the world’s
learners were estimated to be affected (UNESCO, 2020e). Countries have
since begun reopening schools. This section describes the resultant
variation in the duration of school closures. Globally, countries reported that
close to 50 days of in-person teaching and learning have been lost to school closures on
average, although this varied by school calendar and income group.
These closures represent lost opportunities for learning. Beyond the number of days that
schools were closed, it is also important to understand how much learning was lost. To
this end, most respondent countries have assessed students or plan to assess students
using school-based assessment as they return to school. Most were also introducing
additional support programmes to remediate these learning losses as schools reopen, with
remedial programmes being the most commonly used form of support.
13 W H AT H AV E W E L E A RN T ?1. LOST OPPORTUNITIES FOR LEARNING
Across the globe school closures due to COVID-19 have served to deny students
opportunities for learning. To date, a number of analyses have been developed on the
extent of learning loss that students will face. Most have been based on simulated ranges
of the duration of school closure and paint a stark picture of the extent of losses the world
may face. One estimate suggests that global learning losses from four months of school
closures could amount to $10 trillion in terms of lost earnings (Azevedo et al., 2020). Other
studies have also estimated that students and countries stand to lose significant amounts
over their lifetimes (Psacharopoulos et al., 2020; Hanushek & Woessman, 2020).
This survey represents one of the first global attempts to catalogue the timing and
duration of school closures due to COVID-19, based on country reported values of the
length of school closures and of their school year. The data reveal that the severity of
the impact on students varied by when school closures began in terms of the school
calendar, and how long they lasted. Similarly, the data also reveal whether respondents
view remote learning as a valid alternative to in-school learning opportunities. Taken
together, these two pieces of information not only help describe the severity of school
closures but also explain some of the choices governments made when putting together
a menu of policy responses to make up for lost school days.
SCHOOL CLOSURES VARIED WIDELY ACROSS THE GLOBE
Figure 1‑1 makes clear that school closures have impacted countries across the world
in different ways. In some countries, school closures disrupted the end of a school
year; in others, school closures delayed the start of the school year. In still others,
school closures coincided with a previously scheduled break. The figure plots the
timing of school closures for a selection of countries chosen to underscore the variety of
situations. Even neighboring countries in the same region experienced vastly different
durations and timing of school closure.
FIGURE 1-1: School closures have varied by length, start date and moment in the academic year – evidence from
selected countries
COUNTRY
A, EAP
COUNTRY
B, LAC
COUNTRY
C, LAC
COUNTRY
D, EAP
COUNTRY
E, ECA
COUNTRY
F, SSA
COUNTRY
G, EAP
COUNTRY
H, EAP
COUNTRY
I, SSA
DEC 1, 18 MAR 1, 19 JUN 1, 19 SEP 1, 19 DEC 1, 19 MAR 1, 20 JUN 1, 20 SEP 1, 20 DEC 1, 20 MAR 1, 21 JUN 1, 21 SEP 1, 21 DEC 1, 21 MAR 1, 22 JUN 1, 22 SEP 1, 22
ACADEMIC YEAR SUMMER BREAK COVID-RELATED SCHOOL CLOSURES
Notes: Authors’ calculations using date of first closure from the World Bank’s School Tracking Database and from the UNESCO global monitoring of school closures due to COVID-19. Data on length of
school closures is from UNESCO-UNICEF-World Bank Joint Survey on Education during COVID-19. Data on start and end dates of academic years are from UIS. Selected countries anonymized within East
Asia and Pacific (EAP), Europe and Central Asia (ECA), Latin America and Caribbean (LAC) and Sub-Saharan Africa (SSA).
W H AT H AV E W E L E A RN T ? 14FIGURE 1-2: Average days of instruction missed, by income level
77
80 73
68
70 62 62
60 54
48 47
NUMBER OF DAYS
50 43
40 40
40 36
28 27
30 23
20
10
0
LOW INCOME (N=16) LOWER MIDDLE INCOME (N=27) UPPER MIDDLE INCOME (N=33) HIGH INCOME (N=32) GLOBAL (N=108)
DAYS OF INSTRUCTION MISSED DAYS OF INSTRUCTION MISSED DAYS OF INSTRUCTION MISSED
(FINISHED ACADEMIC YEAR) (ONGOING ACADEMIC YEAR) (ANY ACADEMIC YEAR)
Notes: Respondents answered the surveys during the period July – October. While there is a possibility that durations of school closure could be correlated to when the survey was filled out, there is no
clear pattern in the data that would indicate a bias in either direction in the numbers reported here. Caution is advised in generalizing the results represented in the figure as the countries that responded
to this question cover less than 50 per cent of the total 4-17 year old population. More information on the coverage of each income group can be found in Annex 1.
These patterns differed for countries in the northern and southern hemispheres.
Specifically, Figure 1‑2 shows that, on average, across all country income levels, 40
days of school were lost if an academic year was already finished at the time of the
survey, as was the case for countries predominantly in the northern hemisphere. In
countries where there was an ongoing academic year at the time of the survey, 55 days
were reported as lost, as was the case for countries predominantly in the southern
hemisphere. On average, across all countries reporting, school closures lasted for one
quarter of a regular school year (Figure 1-3).
The survey points to a diversity of experiences and responses at the national level.
Countries experienced varying lengths of school closures, and while some considered
remote learning to be a valid substitute for formal school days, others did not. This will
be discussed further in section 4. Durations of school closure varied by whether the
academic year had been completed, whether countries deemed remote learning to
be effective, by country income group and by whether the country was located in the
northern or southern hemisphere. The next sub-section describes how countries plan to
assess learning as schools reopen.
FIGURE 1-3 Share of instruction days missed, by income level
LOW INCOME (N=16) LOWER MIDDLE INCOME (N=27) UPPER MIDDLE INCOME (N=33) HIGH INCOME (N=32) GLOBAL (N=108)
14%
31% 22% 24%
35%
SHARE OF INSTRUCTION DAYS MISSED
Notes: Respondents answered the surveys during the period July – October. While there is a possibility that durations of school closure could be correlated to when the survey was filled out, there is no
clear pattern in the data that would indicate a bias in either direction in the numbers reported here. Caution is advised in generalizing the results represented in the figure as the countries that responded
to this question cover less than 50 per cent of the total 4-17 year old population. More information on the coverage of each income group can be found in Annex 1.
15 W H AT H AV E W E L E A RN T ?2. LEARNING ASSESSMENT
AND MONITORING
Learning assessments and monitoring are crucial for measuring what children effectively
learn. When well-designed, they help monitor the performance of the education system
and inform policy makers and education managers on the reforms to implement and on the
support to provide to schools. Learning assessments also serve as a feedback mechanism,
allowing all stakeholders, including teachers, to understand what is being learned and how
to adapt teaching and learning in the classroom (Liberman & Luna-Bazaldua, 2020).
Different types of learning assessments exist, with different purposes. Formative and
summative assessments are implemented by teachers/schools to adapt their teaching
strategies or as means to provide individual grading to students at the end of a certain
period of instruction. Examinations are used to certify or select learners in a given grade
or age for further schooling, training or work. Large-scale system-level assessments
provide feedback on the overall health of the system for a given group of learners (based
on age or grade) in a given year and in a limited number of domains and are likely the
most relevant type for capturing learning loss due to school closures consistently.
Unsurprisingly, the COVID-19 pandemic and related school closures impacted learning
There are large
assessments. For example, based on the data from the joint survey’s first round, more than
half of respondent countries decided to postpone or reschedule high-stakes examinations, differences in assessing
ranging in time from by four weeks to more than 12 weeks. A few countries reported having and monitoring learning
cancelled their examinations altogether. Around a quarter were continuing to hold high-
across income groups.
stakes exams as planned (a smaller proportion for primary schools), but with half of these
countries reducing the curriculum content to be assessed (Nugroho et. al., 2020).
The second round of the joint survey asked further questions about: i) monitoring learning
outcomes by teachers and related tracking tool (from “not tracked” to different types of tools
for tracking);7 ii) the types of existing assessments prior to COVID-19 (formative/summative;
examinations; and large-scale system-level) for both primary and secondary education; and
iii) whether students were assessed (or there were plans to assess students) following school
reopening at school, sub-national and national levels (and by level of education).
LEARNING MONITORING BY TEACHERS
Overall, 14 per cent of countries reported that student learning progress is not being tracked
by teachers/schools. There are large differences in monitoring practices across income
groups. Only 3 per cent of high-income countries reported that student learning progress
is not tracked by teachers, compared to 25 per cent of low-income countries and 27 per
cent of lower-middle-income countries (see Figure 2-1). Among countries where tracking
systems were in place prior to COVID-19, just over half of countries reported that they were
developed by schools.8
7 The types of tools for tracking student learning proposed in the questionnaire were: i) Through a learning management
system developed by the school; ii) Through a learning management system provided by the private sector (e.g. Google,
Blackboard, Edmondo, etc.); iii) Tracking student progress on Excel or other spreadsheets; iv) Tracking student progress
on paper; and v) other.
8 And 29 per cent of countries -predominantly high-income countries and none of low-income countries- reported that the
learning tracking system was provided by the private sector (e.g. Google, Blackboard, Edmondo, etc.)
W H AT H AV E W E L E A RN T ? 16FIGURE 2-1 Learning monitoring by teachers, per cent of countries where student
learning is not tracked, by income group
27
25
PER CENT OF COUNTRIES
14
8
3
LOW-INCOME LOWER-MIDDLE INCOME UPPER-MIDDLE INCOME HIGH INCOME GLOBAL (N=117)
COUNTRIES (N=16) COUNTRIES (N=30) COUNTRIES (N=36) COUNTRIES (N=35)
ASSESSING STUDENT LEARNING AS SCHOOLS REOPEN
As schools reopen, most countries reported assessing or planning to assess student
learning outcomes through school-based assessment (see Figure 2-2).9 Although these
assessments are less suitable for providing a robust and nation-wide picture of learning
losses due to COVID-19, they are valuable in helping teachers understand where their
students are so that they can support them accordingly.
Specifically at the primary level, the share of respondent countries assessing or planning
to assess primary students through sub-national or national assessments is very low,
with only 10 to 30 per cent of countries planning to assess primary students. This
indicates that the vast majority of countries are not planning system-wide assessments
following school re-openings, and therefore may not be able to accurately measure and
compare learning losses against expected student learning trajectory.
FIGURE 2-2 Assessment of student learning as schools reopen, by level of education
and level of the assessment
65
62
51
PER CENT OF COUNTRIES
30
19
11
SCHOOL-BASED ASSESSMENT SUB-NATIONAL ASSESSMENT NATIONAL ASSESSMENT
PRIMARY LEVEL (N=149) SECONDARY LEVEL (N=149)
Note: The figures are calculated based on all respondents due to the nature of the question, which asked respondents to ‘select all that apply’
among assessments for each level of education.
9 It is noteworthy that answers provided did not include information about the quality of the reported assessments, e.g. in
reference to the use of standardized instruments with psychometrically valid test items.
17 W H AT H AV E W E L E A RN T ?© UNICEF/UNI330852/DEJO
Now that schools are reopening, learning assessments and monitoring are more important
than ever. Large differences that already existed in day-to-day learning monitoring and
robust system-wide learning assessment systems across countries before COVID-19 have
been exacerbated by the pandemic. It is crucial that countries and development partners
strengthen their efforts toward developing well-designed learning assessment systems,
including to better measuring the impact of school closure and provide evidence on
remote learning.
Also, as access to different channels of remote learning varies, so too do their uptake and
effectiveness when implemented. Innovative methods to monitor and assess learning, such
as telephone-based assessments, could be invested in. As education systems prepare
for further school closures resulting from the ongoing COVID-19 crisis and possible future
crises, understanding the accessibility and effectiveness of remote learning programmes
will be critical to creating resilient systems (Alban Conto et al., 2020). Household-based
learning assessment surveys, such as UWEZO or the MICS Foundational Learning Skills
module, are also valuable complementary efforts to support, including for assessing the
learning loss of children who dropped out of school due to the pandemic.
W H AT H AV E W E L E A RN T ? 183. APPROACHES TO MITIGATING
LEARNING LOSSES
Given the wide-ranging experiences of school systems it is not surprising that countries are
choosing to combat lost opportunities for learning with a diverse array of policy responses.
Over one-third of countries are introducing remedial programs to help children catch up.
This is the most common option across income groups, with the share of low-income
countries pursuing this option almost double that of high-income countries. Accelerated
programs are being pursued by one in five countries across the globe. Among high- and
upper-middle-income countries, increasing class time was the least used approach.
Countries are offering a range of in-school supports to help remediate learning
losses during school closures. This has most frequently taken the form of remedial
programmes. Examples include computer-assisted remediation interventions in Ecuador
(Angel-Urdinola, 2020) and remedial tutoring in Niger (3EA, 2018). About one in ten
countries are not providing additional support to students beyond school reopening;
among high-income countries this rate is close to one in four. This pattern is consistent
with the smaller share of instruction days missed (Figure 1‑2) and the greater likelihood
of recognizing remote learning as official school days among high-income countries
(Figure 4‑3). It is notable, however, that recent studies have found that school closures
from COVID-19 can lead to learning loss and widen the achievement gap even in high-
income countries (e.g. Dorn et al., 2020; Maldonado & De Witt, 2020).
FIGURE 3-1: Different approaches to limiting learning loss, by income group
58
60
52
50
43
PER CENT OF COUNTRIES
40 37
34 35
32
30 26 25 24
21
18 19 19
20 16 17 16
15 15 15
12 13
11 10
10 6
0
LOW INCOME (N=19) LOWER MIDDLE INCOME (N=33) UPPER MIDDLE INCOME (N=41) HIGH INCOME (N=48) GLOBAL (N=141)
INCREASE CLASS TIME ACCELERATED PROGRAMMES REMEDIAL PROGRAMMES OTHER STRATEGIES NONE
Notes: Remedial programmes generally target students who are struggling with one or more learning domains and are therefore generally designed to help give students the individual attention they
need to build skills and confidence. Accelerated programmes are flexible, age-appropriate programmes, run in an accelerated timeframe, which aim to provide access to education. They generally target
disadvantaged, over-age, out-of-school children and youth – particularly those who missed out on schooling or had their education interrupted due to poverty, marginalization, conflict and/or crisis. Other
strategies include summer school, revisions to the curriculum and deferring decision making to the local school level.
19 W H AT H AV E W E L E A RN T ?© UNICEF/UNI304636/MA
DEPLOYING EFFECTIVE REMOTE
LEARNING STRATEGIES
A
s schools closed around the world, countries moved quickly to offer remote
learning to continue children’s education through various delivery modalities
including online platforms, broadcast media (TV/radio) and paper-based
take-home packages. This section describes the remote learning responses
that governments provided to address education during school closures, and
how these practices are being taken forward as schools reopen. It then
explores measures and policies implemented thus far to boost access to online remote
learning, as access remains a critical barrier for many children due to the digital divide.
Finally, this section explores the support provided to teachers, parents and caregivers,
who are instrumental for children’s learning and had to rapidly adapt to remote learning as
the space for children’s learning moved out of the classroom.
W H AT H AV E W E L E A RN T ? 204. REMOTE LEARNING:
MODES AND EFFECTIVENESS
Even short interruptions in children’s schooling can have long lasting negative impacts on
children’s learning (Alban Conto et al., 2020). While government responses to provide
remote learning through various modalities were swift, it is essential to understand who
had access to remote learning interventions, how they were used and the extent of their
effectiveness. Throughout this unprecedented period of school closures some key guiding
principles have emerged (World Bank, 2020c; Dreesen et al., 2020) on the use of
multiple delivery channels for remote learning to mitigate the digital divide, the curation of
existing accessible (open) content when available, and the provision of tailored support to
the teachers, parents and caregivers delivering remote learning.
SUPPLY OF REMOTE LEARNING DURING SCHOOL CLOSURES
Overall, online and TV were the most used modalities, being offered in 90 per cent and
87 per cent of countries respectively, followed by paper-based take-home materials
(85 per cent) and radio-based remote learning (61 per cent). Stark differences among
income groups reflect the great inequities in access to the technologies that are required
for remote learning. Though these differences preceded COVID-19, the pandemic has
further exacerbated this digital divide, disproportionately impacting poorer communities
within and across countries.
FIGURE 4-1: Provision of remote learning modalities, by income group
100
100 93 94 95 95
92 92 92 90
89 89 87
86 85
80
PER CENT OF COUNTRIES
64 64 63 61
60 55
40
22
20
0
LOW INCOME (N=17) LOWER MIDDLE INCOME (N=33) UPPER MIDDLE INCOME (N=41) HIGH INCOME (N=44) GLOBAL (N=135)
ONLINE PLATFORM TELEVISION RADIO TAKE-HOME PACKAGES
Notes: Countries were not asked directly about remote learning modalities. Responses to the question on the effectiveness of remote learning (which included: very effective, fairly effective, not effective,
we don’t have such systems) were used to develop a proxy indicator.
UNESCO and the International Telecommunication Union (ITU, 2020) estimate that 40
per cent of students whose schools were closed as of May 2020 do not have access to
the internet (Giannini, 2020; UNICEF, 2020). In addition to these large inequities in
internet access, TV and radio access also varies considerably across and within countries.
In 40 of the 88 countries for which there is recent household survey data, TV ownership
rates among urban households were more than double that of rural households, with the
largest disparities appearing in sub-Saharan Africa (Dreesen et al., 2020). High-income
21 W H AT H AV E W E L E A RN T ?countries report using online platforms (95 per cent) as the main approach to ensure
remote learning, followed by take-home material (89 per cent), television (63 per cent)
and radio (22 per cent). Meanwhile, low-income countries relied more heavily on
broadcast media, including radio (93 per cent) and television (92 per cent), to provide
education content remotely during school closures, while the use of online platforms is
lower, at 64 per cent, likely due to low internet penetration in these environments. In the
earlier section, the survey showed less effort by high-income countries to remediate
learning loss compared to countries from other income groups. The information here may
mean that the perceived quality of remote learning tools (including online and TV) is better
in high-income countries than in low- and middle-income countries.
It is important to keep in mind that in this section we report information regarding what
programs governments seem to be supporting. A critical component which is not easily
observable is the take-up of such programs by students and households. This additional
element is critical but is beyond the scope of this survey, as it requires questions to
be asked at the household level. The previous round of the survey showed that the
monitoring of remote learning, and countries’ assessment of its reach to students,
was at 69 per cent globally (UNICEF, 2020). Therefore, the numbers related to remote
learning availability should be taken with caution.
PERCEIVED EFFECTIVENESS OF REMOTE LEARNING MODALITIES
While the full impact of school closures and relative effectiveness of remote learning
may not be known for some time, this survey shows the perceived effectiveness of
remote learning varied by modality and income group (Figure 4‑1). Globally, online
learning platforms were rated as either very (36 per cent) or fairly (58 per cent)
effective, particularly among high- and upper-middle-income countries whereby, none
of high-income and only 6 per cent of upper-middle-income countries rated online
learning as ineffective.
Television was widely used across low- and middle-income countries, but these groups
reported varying degrees of effectiveness. Among upper-middle-income countries, 37
per cent reported television as very effective, compared to 16 per cent among lower-
middle-income countries and 27 per cent among low-income countries.
© UNICEF/UNI33 086 2/DEJO
W H AT H AV E W E L E A RN T ? 22Radio was rated as ineffective by more than one in five countries globally, though this
could be correlated to the prevalence of its use across income groups. High-income
countries were least likely to use radio, and a third of those who did considered it
ineffective. However, among low- and lower-middle-income countries, radio was
widely used and rated as very effective by about 16 per cent and fairly effective by 65
per cent of countries.
Globally, take-home packages were used by the majority of high- and middle-income
countries, and most (>70 per cent) rated them as fairly effective. Meanwhile, although
these materials were almost equally as commonly used as online platforms among low-
income countries, they were rated more negatively, with 43 per cent of the low-income
countries that used them considering them ineffective.
Among income groups, low-income countries were more likely than others to consider
remote learning not effective across all modalities, except for radio. This likely reflects
the larger issues of availability of prerequisite infrastructure and households’ lack of
access to technologies that are more acute in lower income settings.
FIGURE 4-2: Perceived effectiveness of remote learning, by modality and income group
11 15 14 24 16 17 21 24 20 23
27 37 35 25 43 32 36 28
44
67
67 43
62 67
71 58
45 66 71 69
71 73 59
41 53
57 58
50 58
43
33
27 24
22 23 22
17 8 6 6 16 6
10 13 4 3 13
8
(N LINE
1)
3)
(N OME
=2 E
1)
4)
=2 E
=3 E
5)
7)
=2 E
=4 E
9)
)
=3 E
=1 INE
6)
0)
=8 E
=6
(N NLIN
(N HOM
(N LIN
(N HOM
(N LIN
(N OM
(N HOM
=1
=1
=3
=2
=3
=1
=1
=9
=6
TV )
)
TV )
4)
TV )
4)
TV )
3)
TV )
8)
(N ONL
(N
=9
=7
9
4
0
12
ON
-H
ON
ON
-H
(N
(N
(N
(N
(N
(N
(N
(N
(N
O
-
-
-
O
KE
KE
KE
KE
KE
O
O
O
O
DI
DI
DI
DI
TA
DI
TA
TA
TA
TA
RA
RA
RA
RA
RA
LOW INCOME LOWER MIDDLE INCOME UPPER MIDDLE INCOME HIGH INCOME GLOBAL
VERY EFFECTIVE FAIRLY EFFECTIVE NOT EFFECTIVE
REMOTE LEARNING AS A SUPPLEMENT TO SCHOOLING
Answers received indicate that remote learning methods are commonly considered valid
forms of education delivery and thus can be counted as official school days. This was
the case among 73 per cent of respondents, who agreed that remote learning served
as official learning. There are, however, striking differences by income group. Among
low-income countries, only 20 per cent considered remote learning sufficient enough
to account for official school, while 70 per cent of lower-middle-income, 82 per cent of
upper-middle-income and 86 per cent of high-income countries perceived it to be a valid
learning alternative to official school days.
Significant resources have gone into remote learning in recent months, as evidenced
by the number of countries who reported using it once schools closed. Not surprisingly,
these efforts have spawned a rethinking of education delivery beyond the crisis phase.
Among countries that have reopened and those planning to reopen schools, many are
now using hybrid models that blend in-person and remote learning. More than 90 per
23 W H AT H AV E W E L E A RN T ?You can also read