What can we learn from Covid-19 pandemic's impact on human behaviour? The case of France's lockdown - Nature
←
→
Page content transcription
If your browser does not render page correctly, please read the page content below
ARTICLE
                  https://doi.org/10.1057/s41599-021-00749-2               OPEN

                  What can we learn from Covid-19 pandemic’s
                  impact on human behaviour? The case of France’s
                  lockdown
                  Cyril Atkinson-Clement             1,3 ✉   & Eléonore Pigalle          2,3
1234567890():,;

                  Year 2020 will mark History, with the emergence of the new Covid-19 virus, and more
                  importantly, the consequent political decisions to apply freedom restriction at such a large-
                  scale. Identifying the human behaviours during this extraordinary period represents a unique
                  opportunity to both improve our fundamental knowledge and to improve future management
                  of similar issues. Throughout almost all the duration of the French lockdown (from March 24,
                  2020 to May 10, 2020), we carried out an online survey on more than 12,000 individuals
                  well distributed over the country. This online survey was performed by using both Lime-
                  Survey and Google Forms services and was addressed to adults living in France. Statistical
                  analyses combined classical inferential approach, mapping, clustering and text mining. The
                  results showed that a significant part of the population moved out just before the lockdown
                  (around 10% of our sample) and we highlighted three different profiles of participants. The
                  results emphasised that the lockdown measures compliance was lower in two cases: (i) an
                  unfavourable living environment (referring to social and economic inequity) associated with a
                  high feeling of fear and a lack of trust towards Governmental measures; or (ii) the feeling that
                  the risk was low due to the fact that others complied with the measures. In case a similar
                  situation should occur again, it is recommended that Governments broadcast clear speeches
                  to improve trust, limit fear and increase cooperative behaviours.

                  1 SorbonneUniversité, Institut du Cerveau - Paris Brain Institute - ICM, Inserm, CNRS, AP-HP, Hôpital de la Pitié Salpêtrière (DMU 6), Paris, France.
                                   Mobilité Transports UMRT9403, Gustave Eiffel – ENPC, 77455 Marne-la-Vallée cedex 2, France. 3These authors contributed equally: Cyril
                  2 Laboratoire Ville

                  Atkinson-Clement, Eléonore Pigalle. ✉email: cyril.atkinson-clement@icm-institute.org

                  HUMANITIES AND SOCIAL SCIENCES COMMUNICATIONS | (2021)8:81 | https://doi.org/10.1057/s41599-021-00749-2                                             1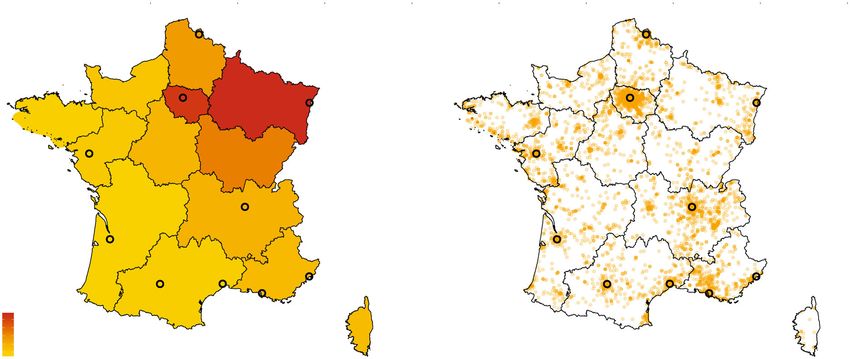
ARTICLE                                HUMANITIES AND SOCIAL SCIENCES COMMUNICATIONS | https://doi.org/10.1057/s41599-021-00749-2

T
Introduction
        he Covid-19 health crisis is a first of a kind situation at        applied no restriction on age, gender, professional situations,
        every field. Never before in contemporary world’s History,         education level or other variable. The instruction only mentioned
        a similar situation had occurred, leading to strong political     that the online survey was more adapted to adults living in
decisions consisting of restricting human interactions through a          France. The online survey was broadcast as widely as possible,
total quarantine, named lockdown. Even if quarantine effects had          through professional and personal networks, mailing list of
already been studied (Brooks et al., 2020), never a similar lock-         associations, political parties, companies and newspapers, sug-
down was applied, with a comparable duration (in general they             gesting to share the online survey with their own personal and
never lasted more than 10–15 days) and at a such scale (several           professional networks. The online survey mainly focused on
countries simultaneously). Moreover, added to its biological              demography, occupations, mobility and life habits, social per-
characteristics, like any viral epidemic, the Covid-19 created also       ception, usual residency and their residency during the lockdown,
a social crisis, which spread essentially due to human behaviours,        lockdown perception, feelings and willingness to change beha-
to individual perception of the situation and to our decision-            viours after the Covid-19 period. Several data were removed such
makings (Pullano et al., 2020). In this context, Human and Social         as incomplete data (not recorded), under age 18 (n = 153) and
Sciences give a unique opportunity to retrospectively understand          people not living in metropolitan France (i.e. Guadeloupe, Mar-
individual decisions and prospectively improve our future human           tinique, French Guiana, Réunion, Mayotte, Saint-Pierre and
management strategies (Bavel et al., 2020; Brooks et al., 2020;           Miquelon, Saint-Barthélemy, Saint-Martin, Wallis and Futuna,
Habersaat et al., 2020). Moreover, pending a vaccine or a specific         French Polynesia, New Caledonia, French Southern and Antarctic
treatment, only behavioural measures were highlighted as effi-             Lands) or who lived in another country during the lockdown
cient to reduce the virus transmission, such as physical distan-          (n = 241) to avoid important spatial and social differences.
cing, face masks and eye protection (Chu et al., 2020), which even           The survey was carried out electronically with the LimeSurvey
could remove the need for a lockdown (López and Rodó, 2020).              services during the first week, then with the Google Forms to
Therefore, obtaining individuals’ compliance to several recom-            increase access and remove limitations on number of participants.
mendations represents a public health objective (Lewnard and Lo,          The participants identification was not possible, through both the
2020, p. 19; Sheikh et al., 2020).                                        web services and the obtained data. Our study complies with
   Based on both previous epidemic issues and the past months             ethical standards of the relevant national and institutional
regarding the Covid-19 (even if studies were not always peer-             committees on human experimentation. Before starting the
reviewed), some lessons could be learnt regarding human beha-             online survey, a statement was presented to the participant,
viours. For instance, protective measures are much more                   indicating that the data collected through the survey will remain
respected by women, old people, individuals with high anxiety             confidential and anonymous and could be used for scientific
and individuals with high Government trust (Bish and Michie,              publications.
2010; Storopoli et al., 2020). Regarding the perception of the
situation, fear of the virus (Harper et al., 2020), self-estimated
vulnerability (risk to be infected (Shinan-Altman and Levkovich,          French key dates. Regarding the French context, all the decisions
2020; van der Pligt, 1996; Xu and Peng, 2015)) and risk to develop        that have been taken were simultaneously and homogeneously
a severe form (Bish and Michie, 2010) increases the probability to        applied to all the country. The key dates were as followed (Fig.
apply Governmental recommendations. In addition, this risk                1a): on January 24, the three first European cases were identified
estimation is based on self-vulnerability rather than on the              in France; on January 31, 220 French citizens were repatriated
probability to infect others at-risk persons (Wise et al., 2020), and     from China; on February 14, the first out-Asia death due to the
interestingly, individuals very often made the basic mistake              Covid-19 was declared in France for an imported case; on Feb-
consisting of perceiving oneself as less at risk than others (van der     ruary 26, the first French death due to the Covid-19 was declared;
Pligt, 1996). Even more, risk perception could be modulated using         on March 5, the first Governmental rule appeared with the pro-
Governmental media, leading to increased self-protective beha-            hibition of grouping of more than 5000 individuals; on March 8,
viours (Duan et al., 2020; Everett et al., 2020). A recent study          groupings of more than 1000 individuals were forbidden; the 11
highlighted that compliance to Governmental measures was                  March 2020, visits in retirement homes were forbidden; the 12
especially linked with health beliefs (Clark et al., 2020), reinfor-      March 2020, first discourse of the President Macron announcing
cing the conclusion that measures acceptation depends more of             the close of all study places, but keeping the local elections; on
situation perception than of pre-existing dispositions (Zajen-            March 13, grouping of more than 100 individuals were forbidden;
kowski et al., 2020). In conclusion, all these facts point out that       on March 14, all non-essential places and stores were closed until
risk perception is definitely a central element of public commu-           further notice; on March 15, local elections recorded the highest
nication (Reynolds and Seeger, 2005).                                     abstention rate ever recorded; on March 6, President Macron
   Therefore, based upon an important online survey (n = 12,064)          gave his second speech comparing the situation to a “health war”
started one week after the beginning of the total lockdown in             and announcing the general lockdown from March 17 at 12 a.m.;
France, and stopped on the last day of the lockdown (key dates,           it was planned to last two weeks, with a 135€ fine in case of non-
daily deaths and spatial deaths distribution are reported in the          respect and the need to fulfil a certificate justifying any trip; on
Fig. 1a, b), our main aim is to identify the individual’s char-           March 23, an emergency health law increasing the Governmental
acteristics and situation perceptions that lead to respect the            power to restrict population movement rights was voted; on
Governmental measures. To the best of our knowledge, our study            March 24, the level of 1000 deaths due to the Covid-19 was
is one of the first to provide empirical data on human behaviours          reached; on March 27, the lockdown was extended until at least
captured during the lockdown, at a national scale.                        April 15; on April 3, the level of 5000 deaths due to the Covid-19
                                                                          was reached; on April 8, the level of 10,000 deaths due to the
                                                                          Covid-19 was reached; on April 13, President Macron carried out
Methods                                                                   his third speech, announcing that the lockdown was extended to
Design and participants. This online survey was conducted from            May 11; on April 19, the Government started to talk about the
March 24, 2020 to May 10, 2020, corresponding to the beginning            lockdown’s end; on April 20, the level of 20,000 deaths due to the
of the second week of the first lockdown and to its last day. We           Covid-19 was reached; on April 28, the Government continued to

2                         HUMANITIES AND SOCIAL SCIENCES COMMUNICATIONS | (2021)8:81 | https://doi.org/10.1057/s41599-021-00749-2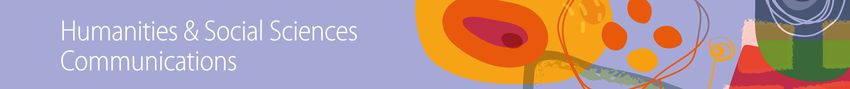
HUMANITIES AND SOCIAL SCIENCES COMMUNICATIONS | https://doi.org/10.1057/s41599-021-00749-2                                                               ARTICLE

     a                  Ban on events more than
                        5,000 people
                                1,000 people
                                               100 people
                                        Closures
                                        Retirement home
                                          School                    Survey
                                               Store
                                                   Local election
                                                       Lockdown               Extended                         Extended
                                                                             until April 15                   until May 11
          1500
     Deaths

          1000

              500

               0
                               Mar 09            Mar 16        Mar 23            Mar 30       Apr 06       Apr 13            Apr 20   Apr 27    May 04      May 11

                    b                                                                                  c

                        0.05
                        0.03
                        0.01

Fig. 1 French context of the Covid-19 until the last lockdown day. Part a reports the key dates (top panel) and the officially reported daily deaths due to
the Covid-19 (bottom panel). Part b represents the percentage of the regional population who died due to the Covid-19. Part c represents the residency
position for all our participants.

precise the conditions of the end of the lockdown, with an                                         Rousseeuw, 1987; Sarle, 1983; Scott and Symons, 1971; Tibshirani
authorisation to travel within a radius of 100 km; on May 7, the                                   et al., 2001) and selected the median number of optimal models
date of the lockdown’s end planned for the 11 May was con-                                         reported by the statistics using Euclidean distance. Details of the
firmed; the 11 May 2020, the general lockdown was put to an end.                                    output statistics are available in the Fig. S1. The k-means
                                                                                                   clustering apply by steps: (i) select as many individuals as
                                                                                                   mentioned in the model (in our case, 3); (ii) each of them is
Statistics. All statistics were carried out with the R software                                    associated with the closest individual to generate a temporary
(R Core Team, 2013). Inferential statistics implied Chi-squared                                    cluster; (iii) the gravity centre of the new temporary cluster is
for 2 × 2 contingency tables, ANOVA for numerical variables,                                       calculated and become the new centre; (iv) each observation is
partial binomial multiple regressions for bivariate variables and                                  reallocated to the cluster; (v) the procedure continued until
partial multinomial logistic regression for categorial variables.                                  convergence. All the details of the procedure are described in the
Partial models implied to insert several predictors in the same                                    following publication related to the R package NbClust (Charrad
model to control every effect according to the others, and thus to                                 et al., 2014).
control for bias. All results were associated with Cohen’s d effect                                   Last, text mining was performed on a free answer (“Does the
size. Cohen’s d could be interpreted as very small (d > 0.01), small                               lockdown impact your life:” [“positively”; “negatively”; “no
(d > 0.2), medium (d > 0.5), large (d > 0.8), very large (d > 1.2) or                              change”], “Could you develop?”). The corpus was cleaned by
huge (d > 2 (Cohen, 2013; Sawilowsky, 2009)). All multiple                                         removing capital letters, additional white spaces, removing
comparisons were corrected using the Bonferroni approach to                                        numbers, punctuations, and basic words (e.g. “the”, “and”,
avoid incorrect null hypothesis rejection. Significant threshold                                    “but”, “or”). Then, the frequency of each word was calculated
was fixed at p ≤ 0.05.                                                                              for each cluster and compared between them using a variation
   Clustering was performed using the k-means method. To                                           coefficient (VC). For each cluster, 20 words with the highest VC
identify the optimal number of clusters, we computed models’                                       and probability to be used were considered as specific.
comparisons from 2 to 10 clusters using 24 statistics (Ball and
Hall, 1965; Beale, 1969; Calinski and Harabasz, 1974; Davies and
Bouldin, 1979; Duda and Hart, 1973; Dunn, 1974; Friedman and                                       Results
Rubin, 1967; Halkidi et al., 2000; Halkidi and Vazirgiannis, 2001;                                 Sample description. Our sample involved 12,064 individuals.
Hartigan, 1975; Hubert and Levin, 1976; Krzanowski and Lai,                                        When we compared weeks, we found an unbalanced distribution
1988; Marriott, 1971; McClain and Rao, 1975; Milligan, 1980;                                       of ages (d = 0.878), socio-professional categories (d = 0.865),
Milligan and Cooper, 1985; Ratkowsky and Lance, 1978;                                              regions of residency (d = 0.56), education levels (d = 0.504),

HUMANITIES AND SOCIAL SCIENCES COMMUNICATIONS | (2021)8:81 | https://doi.org/10.1057/s41599-021-00749-2                                                              3
ARTICLE HUMANITIES AND SOCIAL SCIENCES COMMUNICATIONS | https://doi.org/10.1057/s41599-021-00749-2
home compositions (d = 0.439), gender (d = 0.359), types of before the lockdown (d = 0.067). No effect of age was observed
residency (d = 0.312), and perceived salaries (d = 0.153). The (d = 0.083).
sample characteristics by week are available in Table 1 and their Last, text mining highlighted discourses differences between the
spatial distribution is available in Fig. 1c. three clusters (Fig. 3c). The cluster 1 takes time to experience new
activities (e.g. “refocus” [VC = 87.19%], “reading” [VC = 67.13%],
“yoga” [VC = 64.82%], “scrabble” [VC = 56.49%], “cooking”
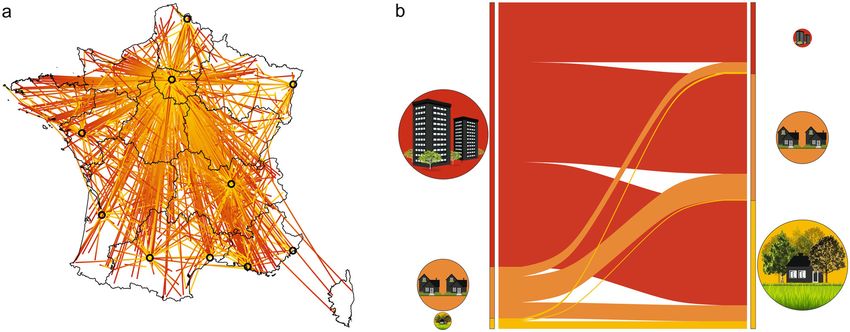
Behaviours right before the lockdown. In the days/hours pre- [VC = 56.14%]) and estimated the lockdown as a good opportunity
ceding the lockdown, we noted that 11.7% of our participants (e.g. “best” [VC = 80.25%], “get closer to” [VC = 74.59%], “essential”
declared having changed of usual place residence. The reasons [VC = 64.24%]). The cluster 2 referred more to negative feelings (e.g.
were, first to be the closest possible to a family member or a friend “depression” [VC = 135%], “anger” [VC = 127.65%], “worry”
(76.7%), for the quality of the living environment (59.6%), to [VC = 102.19%], “boredom” [VC = 83.51%], “fear” [VC = 82.12%])
increase the living place area (48%), to avoid over-population while the cluster 3 enjoyed continuing their activities in a
(20.1%) and for an unexpected reason (4.7%). Distance between quieter environment (e.g. “noise” [VC = 101.29%], “peaceful”
the original and the lockdown residencies is represented in [VC = 62.75%], “break” [VC = 59.32%], “read” [VC = 68.46%],
Fig. 2a. “gardening” [VC = 62.41%], “spring” [VC = 60.52%], “games”
Regarding the distance from their usual place of residence, [VC = 56.31%], “appreciate” [VC = 53.44%]).
13.9% remained in the same city, 14.9% in the same department,
19.7% in the same region and 51.4% further away. Interestingly, After the lockdown, hope for a new world? Last, we investigated
most of the residence changing were from one type of residency to know if the lockdown was perceived as a way to change habits
to the same (X = 35.7; p < 0.0001; d = 0.318; Fig. 2b). Especially, and lifestyle in our three clusters. Using partial multinomial
we found that those who live in suburban areas mainly moved to logistic regression, we identified that the main differences
another suburban home (p = 0.0014), as well as those living in the between our three clusters were for the “change the vision of
countryside (p < 0.0001). This was not the case for people living others” (X = 240.78; p < 0.0001; d = 0.282; slope Cluster
in a flat, who represented the most important proportion of 1 = 2.19%; slope Cluster 2 = 1.26%; slope Cluster 3 = −3.45%)
people leaving their home (81.1%). and “get closer from relations” (X = 214.38; p < 0.0001; d = 0.267;
Partial logistic regression highlights that the probability to slope Cluster 1 = 1.87%; slope Cluster 2 = 0.78%; slope Cluster
change of residence before the lockdown was significantly 3 = −2.66%), followed by “change my life habits” (X = 48.95; p <
predicted by the familial organisation (F(5;12020) = 51.392; p < 0.0001; d = 0.127; slope Cluster 1 = 1.36%; slope Cluster
0.0001; d = 0.298; higher for people living in collocation or alone 2 = 0.05%; slope Cluster 3 = −1.4%) and “change my eating
with no child), professional situation (F(10;12020) = 12.98; p < habits” (X = 28.77; p < 0.0001; d = 0.098; slope Cluster 1 = 0.95%;
0.0001; d = 0.208; higher for students, retired people and people slope Cluster 2 = −0.15%; slope Cluster 3 = −0.79%). No sig-
with no job), age (F(1;12020) = 118.034; p < 0.0001; d = 0.198; nificant effect was found for the sentence “change my travel
slope = −0.044), residency type (F(2;12020) = 52.152; p < 0.0001; habits” (X = 5.42; p = 0.066; d = 0.042; slope Cluster 1 = 0.33%;
d = 0.186; higher for people living in flats inside the city), slope Cluster 2 = 0.15%; slope Cluster 3 = −0.48%).
perceived salary (F(4;12020) = 6.9536; p < 0.0001; d = 0.096; higher
for people judging their life as very comfortable) and the gender
(F(1;12020) = 6.447; p = 0.011; d = 0.046; higher for women). No Discussion
significant association was found according to the region of Spatial mobility before the lockdown. Based on our online
residency (F(12;12020) = 1.1535; p = 0.311; d = 0.068) or education survey, several lessons on human behaviours could be obtained.
level (F(6;12020) = 1.894; p = 0.078; d = 0.061). First, while population movement control was already associated
with a high decrease of covid-19 transmission (Bi et al., 2020;
Chinazzi et al., 2020; Pullano et al., 2020; Tian et al., 2020; Wells
Perceived situation throughout the lockdown duration. To et al., 2020; C. Zhang et al., 2020; R. Zhang et al., 2020, p. 19), we
identify the lockdown perception, we generate k-means clustering reported that more than 10% of our participants changed of
on the basis of several sentences and feelings related to the residence specifically in the lockdown prevision. If almost 29%
situation (Fig. 3a and Table 2). Algorithms comparisons high- moved in proximity (same city or department), the rest of them
lighted that generating three clusters was optimal (see Supple- moved further away, contributing to the virus spreading in the
mentary Fig. 1). The first cluster (30.8% of our sample) seems to country (Duque-Calvache et al., 2020). Equivalent results were
both have positively appreciated the lockdown period and to be reported in France, from the French statistics and economic
concerned about the pandemic crisis. The second cluster (33.8% studies administration (INSEE, 2020) and by using mobile phone
of our sample) can be characterised as more pessimistic, worried, trajectory reconstruction (Pullano et al., 2020). In Italy, like our
stressed out, and less in agreement with Governmental measures results, spatial mobility was found higher in both younger and
and respect of rules. The third cluster (35.4% of our sample) older people, for people who can work from home and for people
seems not to be affected by the situation, hence not worried for living in a non-family household (Duque-Calvache et al., 2020).
itself or close relations. Throughout the course of these three This was possible since the total lockdown was announced one
profiles (Fig. 3b), we observed a decreased proportion of the day before its enforcement. Even if this decision to delay the
cluster 1 (F(1;12062) = 45.449; p < 0.0001; d = 0.123), an increased lockdown made the prognostic worst, it probably improved the
proportion of the cluster 2 (F(1;12062) = 32.766; p < 0.0001; lockdown acceptance by a part of the population.
d = 0.104), and no change for the cluster 3 (F(1;12062) = 0.6177;
p = 0.43; d = 0.014). Three ways to perceive the lockdown. We identified three par-
Regarding the clusters’ comparison (Table 3), partial multi- ticipants profiles based on their situation perception. The first one
nomial logistic regression highlighted significant differences on reported the highest lockdown measures acceptance associated
the perceived salary (d = 0.284), gender (d = 0.27), education with, on the one hand, a significant concern about the covid-19, on
levels (d = 0.174), type of residency (d = 0.129), home composi- the other hand, a satisfaction since the lockdown was an oppor-
tion (d = 0.128), regions of residency (d = 0.123) socio- tunity to re-focus on itself and relations (e.g. “refocus”, “reading”,
professional categories (d = 0.116), and change of residence “get closer to”, “essential”). However, the proportion of individuals
4 HUMANITIES AND SOCIAL SCIENCES COMMUNICATIONS | (2021)8:81 | https://doi.org/10.1057/s41599-021-00749-2HUMANITIES AND SOCIAL SCIENCES COMMUNICATIONS | https://doi.org/10.1057/s41599-021-00749-2 ARTICLE
Table 1 Participants description for each lockdown weeks.
Week Main effects
2 3 4 5 6 7 8
N 3358 2965 1401 666 1890 586 1198
Gender (female) 63.5% 78% 72.4% 72.2% 53% 73% 69.9% X = 390.2; p < 0.0001; d = 0.359
Agea X = 2292.9; p < 0.0001; d = 0.878
18–19 1.4% 2.8% 0.1% 1.5% 0.5% 1.2% 1.3%
20–29 25.6% 40.7% 20.6% 14.3% 10.2% 6.8% 9.9%
30–39 24.9% 20.5% 25.1% 17.6% 12.5% 10.9% 13.7%
40–49 18% 14.7% 18.3% 23.7% 16.7% 13.3% 12%
50–59 15.8% 11.9% 16.1% 23.6% 19.2% 13.7% 14.5%
60–69 10.2% 6.3% 12.1% 14.6% 24.1% 31.2% 24.7%
70–79 3.6% 2.8% 6.4% 4.4% 14.8% 19.8% 20%
80–89 0.5% 0.3% 1.3% 0.2% 1.9% 3.1% 3.7%
90–99 0% 0% 0% 0.3% 0.1% 0% 0.1%
Education levelb X = 669.6; p < 0.0001; d = 0.504
Without diploma 0.4% 0.8% 0.3% 0.8% 0.6% 1.4% 1.2%
Junior school certificate 0.9% 0.9% 0.7% 0.7% 1.2% 5.1% 3%
Youth Training 2.9% 5.4% 2.5% 2.8% 3% 9.3% 7.3%
High school diploma 6.3% 7.8% 4.4% 4.8% 8.7% 15.3% 14.4%
Diploma of Higher 11.1% 13.4% 8.8% 10.7% 14.6% 18.3% 15.6%
Education
Bachelor’s degree 15.9% 25.5% 21.4% 27% 25% 19.7% 16.8%
Master’s degree and more 62.6% 46.2% 61.9% 53.2% 46.9% 30.8% 41.7%
Socio-professional category X = 2255.8; p < 0.0001; d = 0.865
Students 12.5% 24.2% 11.9% 9.9% 4.8% 3.1% 5.7%
Homemaker 0.5% 1.3% 1% 0.9% 0.9% 1.7% 1%
Retired 9.7% 7% 14.5% 13.8% 33.4% 51% 43.3%
Unemployed 4.2% 4.9% 5.3% 2.6% 4.4% 2.7% 2.9%
Farmer 0.2% 0.1% 0% 0% 0.1% 0.3% 0%
Worker 0.5% 1% 0.2% 0.6% 0.2% 0.3% 0.2%
Employee 14% 17.7% 11.5% 9.3% 11% 11.8% 9.2%
Craftsperson 2.8% 5% 3% 6.6% 3.4% 2.7% 1.9%
Intermediate occupation 6.6% 7.6% 6.9% 9.8% 7.6% 4.3% 5.8%
Executive 48.4% 30.7% 45.3% 46.2% 34% 21.3% 29.6%
Others 0.7% 0.5% 0.5% 0.3% 0.4% 0.7% 0.4%
Home composition X = 582.2; p < 0.0001; d = 0.439
Alone 22.7% 23.4% 23.4% 20.1% 21.5% 27.1% 29.4%
Alone with child(ren) 5.5% 5.6% 6.3% 8.7% 6.1% 7.2% 3.8%
With partner 31.4% 26.8% 33.9% 31.1% 39.7% 41.5% 42.7%
With partner and child 29.3% 24% 28.1% 32.6% 26.6% 18.9% 18.6%
(ren)
With family 6.4% 13.2% 3.4% 5% 3.5% 3.8% 3.3%
Colocation 4.8% 6.9% 4.9% 2.6% 2.5% 1.5% 2.3%
Region of residency X = 947.1; p < 0.0001; d = 0.560
Auvergne-Rhône-Alpes 17.3% 9.5% 9.2% 11.9% 16% 14.2% 12.4%
Bourgogne-Franche- 1.4% 1.8% 1.9% 2.3% 2.8% 2.7% 2.4%
Comté
Bretagne 3.2% 2.9% 3.4% 6.6% 4.7% 9.4% 3.3%
Centre-Val de Loire 1.9% 3.7% 2.1% 2.7% 3.2% 2.9% 4.2%
Corse 0% 0.3% 0.1% 0.2% 0.2% 0.2% 0.7%
Grand Est 3% 3.6% 4.2% 3.6% 3.8% 11.1% 7%
Hauts-de-France 3.3% 3.4% 3.6% 4.1% 3.7% 3.8% 4.1%
Île-de-France 47.2% 44% 49% 33.6% 30.7% 22.9% 35.6%
Normandie 1.4% 1.7% 1.4% 1.8% 3.4% 3.2% 1.6%
Nouvelle-Aquitaine 3.5% 5.4% 3.2% 7.8% 7.9% 8.4% 9.8%
Occitanie 6% 6.1% 8.4% 6.6% 9.2% 6.8% 7.8%
Pays de la Loire 7.3% 4.3% 5.1% 11% 7.6% 10.6% 5.8%
PACA 4.5% 13.2% 8.3% 8% 6.8% 3.9% 5.3%
Type of residency X = 294.1; p < 0.0001; d = 0.312
Town building 55.9% 54.1% 60.4% 42.5% 41% 35.7% 43.7%
Suburban 33.2% 32.7% 31.3% 41% 40.9% 45.9% 41.2%
Countryside 10.8% 13.3% 8.3% 16.5% 18.1% 18.4% 15.1%
Perceived salary X = 70.2; p < 0.0001; d = 0.153
Very difficult 1.8% 2.4% 1.2% 2.4% 2.3% 3.6% 1.6%
Difficult 4.8% 6.9% 4.9% 5% 5.4% 5.3% 4.4%
Mixed 30.5% 33.5% 28.1% 29.3% 29.4% 30.7% 30.1%
HUMANITIES AND SOCIAL SCIENCES COMMUNICATIONS | (2021)8:81 | https://doi.org/10.1057/s41599-021-00749-2 5ARTICLE HUMANITIES AND SOCIAL SCIENCES COMMUNICATIONS | https://doi.org/10.1057/s41599-021-00749-2
Table 1 (continued)
Week Main effects
2 3 4 5 6 7 8
Comfortable 51.2% 47.2% 52.4% 49.8% 50.9% 50.2% 52.8%
Very comfortable 11.7% 10.1% 13.4% 13.5% 12% 10.2% 11.1%
The significant post-hoc using Bonferroni correction for over-representation is shown as bold values and under-representation is shown as italic values.
a18–19 years old were not included in the statistic.
bStudents were not included in the statistics.
Fig. 2 Population movements during the hours preceding the lockdown. Part a represents the distance between the usual residence and the lockdown
residence. The yellow part of the line represents the departure, the red part the arrival. Part b represents the change of residence type before the lockdown
in percentage. The left part represents the usual residence and the right part the lockdown residence.
corresponding to this group decreased progressively through time. The lockdown highlighted pre-existing social inequality. In the
The two others tended to less apply the lockdown measures. For past as for during the covid-19 lockdown, several studies focused on
cluster 2, this tendency could be explained by a perception of the socio-demographic predictors of measures compliance, with quite
situation as a punishment (i.e. “I feel like I am losing my freedom” opposing results since they found (Carlucci et al., 2020; Murphy
Z-score = 0.528), even if they were highly worried by the covid-19 et al., 2020; Taylor et al., 2008) or not predictors (Bolarinwa et al.,
for themselves (i.e. “I feel safe” Z-score = -0.563) more than for 2020). Our results are more in favour of an effect of the living
their close relations (i.e. “I am afraid of infecting others” Z- environment, especially highlighted by the differences between the
score = 0.058). In addition, they were the group with the lowest second and third clusters. For the cluster 2, we observed an over-
satisfaction regarding the Governmental measures (Z-score = representation of individuals living in Île-de-France (which includes
−0.333), a variable which was found as significantly associated Paris, the most expensive place in France), which perceived their
with adoption of preventive behaviours (Storopoli et al., 2020). purchasing power as insufficient, was more unemployed and lived in
Unlike the first cluster, the proportion of our sample corre- city flats. For cluster 3, we found an over-representation of high-
sponding to this cluster progressively increased with the lockdown graduate people, with comfortable quality of life, who changed of
duration. This group corresponds to previous observations residence just before the lockdown to leave the cities, and their
regarding frustration, boredom and sense of isolation due to proportion was stable during the lockdown. Therefore, these profiles
quarantine (Brooks et al., 2020; Martarelli and Wolff, 2020), highlighted not demographics or psychological weakness, but more
already identified as decreasing quarantine compliance (DiGio- social and economic inequality (Bavel et al., 2020; Chung et al.,
vanni et al., 2004; Maunder et al., 2003). The last group (cluster 3) 2020). This is in line with several observations that highlighted the
also presented a lower measures application, but for different need to especially consider people of low socio-economic status
reasons. They reported less worried for themselves (i.e. “I feel safe” (Patel et al., 2020). Indeed, socio-economic situation contributes to
Z-score = 0.469) and their relations (i.e. “I am worried about my increase both negative outcomes due to the situation such as loss
close relation” Z-score = −0.669) and estimated that the Govern- employment or risk to develop mental health issues (Nicola et al.,
mental measures were enough (i.e. “I estimate that the Govern- 2020; Patel et al., 2020; Serrano-Ripoll et al., 2020), but also risk of
mental measures are enough” Z-score = 0.127). Interestingly, if being infected (Holuka et al., 2020; Koh, 2020; Patel et al., 2020).
they estimated to less apply the lockdown measures (i.e. “I respect This point is especially relevant and emphasises pre-existing
the lockdown measures” Z-score = −0.053), they also estimated inequality since the French Government guaranteed income (one
that others respected more (i.e. “I think the others respect the of the most important aspects to obtain measure acceptance (Bodas
lockdown measures” Z-score = 0.134). These characteristics con- and Peleg, 2020)) to the main part of the population.
verge to the hypothesis that this group had the feeling not to be
affected by the virus nor by the Governmental measures. Put
together, our three groups allow us to highlight several lessons on Situation perception, a matter a risk valuation. However, even if
human behaviour during this pandemic period. clusters 2 and 3 are significantly different, they both respected less
6 HUMANITIES AND SOCIAL SCIENCES COMMUNICATIONS | (2021)8:81 | https://doi.org/10.1057/s41599-021-00749-2HUMANITIES AND SOCIAL SCIENCES COMMUNICATIONS | https://doi.org/10.1057/s41599-021-00749-2 ARTICLE
Cluster
Cluster 11 Cluster
Cluster 22 Cluster
Cluster 33
a
1
2
3
4
5
6
7
8
9
10
11
12
13
14
15
16
17
18
19
20
21
22
23
24
−0.5 0.0 0.5 −0.5 0.0 0.5 −0.5 0.0 0.5
Z-scores Z-scores Z-scores
b
% % %
60 60 60
40 40 40
20 20 20
10 20 30 40 50 10 20 30 40 50 10 20 30 40 50
Lockdown duration (d) Lockdown duration (d) Lockdown duration (d)
c
get closer to boredom peaceful
trip essential anxiety lock up group read
worry job anger
year
reading best noise tidying
refocus pollution depression fear spring break
yoga
revise disease
distance psychologically gardening
interaction
Fig. 3 Participants profiles during the lockdown. Part a represents the details of the three generated clusters of participants for the 16 sentences (1–16)
and 8 feelings (17–24) used to perform k-means clustering (the details of sentences and feelings are available in the Table 2; errors bars correspond to the
95 confidence interval). Part b represents the proportion of participants corresponding to each cluster for all lockdown day and their tendency (significant
only for clusters 1 and 2). Part c represents the 10 most specific words used by the three clusters.
the lockdown measures than the first cluster. We can assume that Allen, 2000), representing a solution to the Covid-19 situation
they both computed an unbalanced ratio between the perceived risk (Ahorsu et al., 2020). For example, risk-averse attitudes were high-
and the cost-effectiveness of the lockdown which could lead to fear, lighted as a relevant factor to adjust behaviours, even before Gov-
representing one of the most shared feeling during the pandemic ernmental measures (H. F. Chan et al., 2020; Pullano et al., 2020).
crisis (Aslam et al., 2020). As well known, fear could lead to the However, fear is also associated with increased risky decision-
highest measure compliance when they are perceived as efficient making (Hartley and Phelps, 2012; Yang et al., 2018), which is
(Bavel et al., 2020; Carlucci et al., 2020; Harper et al., 2020; Witte and reinforced in specific contexts of uncertainty or ambiguity (Reintjes
HUMANITIES AND SOCIAL SCIENCES COMMUNICATIONS | (2021)8:81 | https://doi.org/10.1057/s41599-021-00749-2 7ARTICLE HUMANITIES AND SOCIAL SCIENCES COMMUNICATIONS | https://doi.org/10.1057/s41599-021-00749-2
Table 2 Lockdown perception for the three generated clusters.
Cluster 1 Cluster 2 Cluster 3 Main effects
(a) Sentences
Safety and virus spread
1. I am afraid of being contaminated by others [0.454;0.511] [0.182;0.236] [−0.646;−0.593] d = 1.068
2. I am afraid of infecting others [0.517;0.575] [0.030;0.085] [−0.558;−0.504] d = 0.977
3. I feel safe [0.052;0.110] [−0.591;−0.536] [0.442;0.496] d = 0.959
4. I think I will be infected [0.248;0.309] [0.136;0.195] [−0.429;−0.372] d = 0.628
Worry for close relation
5. I am worried about my close relation [0.475;0.530] [0.216;0.269] [−0.695;−0.643] d = 1.172
6. I get more news from my close relation [0.403;0.464] [−0.165;−0.106] [−0.276;−0.219] d = 0.612
Measures’ respect
7. I feel like I am losing my freedom [−0.222;−0.162] [0.499;0.556] [−0.366;−0.310] d = 0.827
8. I estimate that the Governmental measures are enough [0.189;0.252] [−0.363;−0.303] [0.098;0.156] d = 0.497
9. I respect the lockdown measures [0.139;0.203] [−0.131;−0.069] [−0.083;−0.023] d = 0.234
10. I think the others respect the lockdown measures [−0.038;0.026] [−0.165;−0.104] [0.104;0.164] d = 0.225
Situation adaptation
11. I am bored, I find the time long [−0.201;−0.143] [0.561;0.616] [−0.440;−0.386] d = 0.959
12. I take the time to discover new leisure activities [0.552;0.611] [−0.432;−0.375] [−0.147;−0.092] d = 0.886
13. I adapt myself to the situation [0.295;0.354] [−0.584;−0.528] [0.223;0.278] d = 0.870
14. I have plenty to take care of [0.251;0.310] [−0.564;−0.507] [0.241;0.296] d = 0.829
15. I surprise myself [0.513;0.573] [−0.226;−0.169] [−0.311;−0.256] d = 0.781
16. I think the others are bored [−0.020;0.043] [0.202;0.262] [−0.261;−0.202] d = 0.394
(b) Feelings
Negatives
17. Worry [0.376;0.425] [0.521;0.568] [−0.892;−0.847] d = 1.692
18. Stress [0.164;0.215] [0.638;0.686] [−0.822;−0.775] d = 1.582
19. Sadness [0.041;0.096] [0.578;0.631] [0.664;−0.613] d = 1.214
20. Anger [−0.059;−0.001] [0.555;0.609] [−0.557;−0.504] d = 1.045
Positives
21. Joy [0.326;0.383] [−0.655;−0.600] [0.265;0.319] d = 1.006
22. Calmness [0.141;0.199] [−0.600;−0.544] [0.373;0.427] d = 0.925
23. Optimism [0.291;0.350] [−0.585;−0.529] [0.227;0.282] d = 0.871
24. Bravery [0.285;0.348] [−0.104;−0.044] −0.234;−0.175] d = 0.446
Results are given using Z-scores and 95 HDI. Cells represent a mean and 95HDI over (bold values) or under (italic values) the mean of the total sample.
et al., 2016), such as during the lockdown period (uncertainty about total lockdown in France successfully decreased the burden on the
the virus spreading and severity, ambiguity regarding the relevance intensive care units in the most affected regions, and prevented
of behavioural measures or mask wearing (Brand et al., 2007; uncontrolled epidemics growth in the others (Cauchemez et al.,
Heilman et al., 2010)). In addition, it was reported that fear could 2020).
have negative influence on preventive intentions if it was associated Interestingly, we also suggest that this weak infection
with collectivism (which could be the case of our cluster 2) (F. probability and the attribution of a specific behaviour to others
Huang et al., 2020). Therefore, in this point of view, the lack of was powerful enough to remove one of the highest variables of
balance between the feeling of safety (low for cluster 2, mild for risk of severe form of the disease: age (Liao et al., 2020). Indeed,
cluster 1 and high for cluster 3) and the feeling that the Govern- we found no association between our clusters and age, or with
mental measures are enough (low for cluster 2, mid for cluster 3 and retired people. This result was also reported by previous study in
high for cluster 1) probably contributed to the lockdown compliance mainland China (Y. Huang and Zhao, 2020), Hong-Kong (E. Y.
(low for cluster 2, mid for cluster 3 and high for cluster 1). Y. Chan et al., 2020) and in an international survey (Clark et al.,
For the third cluster, if low measure acceptance was, in the past, 2020). Decisions of this group to less apply the lockdown rules
more associated to a lack of information and a feeling of isolation could also refer to social and moral decision-making under
or exclusion from the rest of the world, these reasons are of very uncertainty and cooperating behaviours, which were already
low probability. Like our findings, another study observed a presented as levers to increase people implication and acceptance
decreased compliance in individuals with high socio-professional (Bavel et al., 2020). For this third cluster, we can assume that they
situations (Nivette et al., 2021). We assume that they had the had a decreased lockdown respect for two main reasons. First,
feeling not to be affected since they computed as extremely weak since they perceived negative outcomes on others as of low
the probability to be exposed to the covid-19 (i.e. “I think I will be probability, reducing the relevance to strictly respect the measures
infected” Z-score = -0.401), probability which was also decreased (Garcia et al., 2018; Gino et al., 2016). Secondly, since they
by the estimation that others respected the measures well (i.e “I perceived the measures’ respect by others as higher, they
think the others respect the lockdown measures” Z-score = 0.134). estimated as less relevant to respect them themselves, corre-
We can explain this since most of the studies were based on sponding to a large range of research in Psychology and
specific quarantine of at-risk individuals or to restrict areas Neurosciences (Strang and Park, 2016).
(districts or cities). Never before such an extended and unspecific
lockdown was implemented, reinforcing the basic error to believe
that others are more likely to be infected than oneself (Bavel et al., Limitations. Several limitations in our study have to be addres-
2020; Sharot, 2011; Wise et al., 2020). Indeed, it was reported that sed. First, the used sample was unbalanced and involved an over-
8 HUMANITIES AND SOCIAL SCIENCES COMMUNICATIONS | (2021)8:81 | https://doi.org/10.1057/s41599-021-00749-2HUMANITIES AND SOCIAL SCIENCES COMMUNICATIONS | https://doi.org/10.1057/s41599-021-00749-2 ARTICLE
Table 3 Estimated probabilities to be in one of the three generated clusters.
Cluster 1 Cluster 2 Cluster 3 Main effects
N 3713 4084 4267
Gender Χ = 219.9; p < 0.0001; d = 0.27
Female 34.4% 35% 30.5%
Male 24.3% 31.3% 44.3%
Age Χ = 20.91; p = 0.182; d = 0.083
18–19 25.9% 29.3% 44.7%
20–29 32.7% 30.9% 36.4%
30–39 31.5% 34.7% 33.7%
40–49 30.4% 35.8% 33.7%
50–59 29.2% 35.4% 35.4%
60–69 30.9% 35.8% 33.2%
70–79 30.8% 34.1% 35%
80–89 36.5% 33.6% 29.9%
90–99 17.2% 66.4% 16.4%
Education level X = 91.32; p < 0.0001; d = 0.174
Without diploma 33.9% 30.6% 35.4%
Junior school certificate 37.6% 33.7% 28.7%
Youth Training 43.3% 34.8% 21.9%
High school diploma 36.8% 36.9% 26.2%
Diploma of Higher Education 34.3% 35.6% 30.1%
Bachelor’s degree 32.1% 32.4% 35.4%
Master’s degree and more 27.9% 33.8% 38.3%
Socio-professional category X = 40.37; p = 0.004; d = 0.116
Students 28.3% 33.4% 38.2%
Homemaker 31.5% 32.3% 36.1%
Retired 32.3% 32.9% 34.7%
Unemployed 24.7% 38.1% 37.2%
Farmer 18.8% 26.8% 54.4%
Worker 39.9% 31.6% 28.5%
Employee 34.1% 35.4% 30.4%
Craftsperson 30.5% 29.5% 39.9%
Intermediate occupation 31.3% 31.9% 36.8%
Executive 31.2% 34.8% 33.9%
Others 25.5% 39.8% 34.6%
Home composition X = 49.36; p < 0.0001; d = 0.128
Alone 28.5% 34.3% 37.1%
Alone with child(ren) 29.4% 31% 39.6%
With partner 33.2% 33.1% 33.7%
With partner and child(ren) 32.5% 32.7% 34.8%
With family 29.3% 42.9% 27.7%
Colocation 25.9% 40.4% 33.7%
Region of residency X = 45.34; p = 0.005; d = 0.123
Auvergne-Rhône-Alpes 29.6% 32.1% 38.3%
Bourgogne-Franche-Comté 29.2% 35.7% 35%
Bretagne 27.2% 33.9% 38.8%
Centre-Val de Loire 26.7% 32.9% 40.3%
Corse 36.6% 15.7% 47.7%
Grand Est 30.9% 32.6% 36.4%
Hauts-de-France 34.5% 34.4% 31.1%
Île-de-France 32.7% 34.9% 32.4%
Normandie 29.6% 33% 37.4%
Nouvelle-Aquitaine 31% 32.8% 36.2%
Occitanie 27.6% 37.4% 35%
Pays de la Loire 30.1% 35% 34.9%
PACA 32.4% 31.9% 35.7%
Type of residency X = 50.57; p < 0.0001; d = 0.129
Town building 30.4% 37.3% 32.2%
Suburban 32% 31.9% 36%
Countryside 30.4% 28.5% 41.1%
Perceived salary X = 244.19; p < 0.0001; d = 0.284
Very difficult 24.9% 51.8% 23.3%
Difficult 21.1% 54.2% 18.7%
Mixed 30.1% 38.9% 30.9%
Comfortable 32% 30.7% 37.2%
Very comfortable 29.7% 25.6% 44.7%
HUMANITIES AND SOCIAL SCIENCES COMMUNICATIONS | (2021)8:81 | https://doi.org/10.1057/s41599-021-00749-2 9ARTICLE HUMANITIES AND SOCIAL SCIENCES COMMUNICATIONS | https://doi.org/10.1057/s41599-021-00749-2
Table 3 (continued)
Cluster 1 Cluster 2 Cluster 3 Main effects
Change of residence X = 13.57; p = 0.035; d = 0.067
No, without reception 31.2% 34.7% 34.1%
No, with reception 31.1% 32.9% 35.9%
Yes, to close relations 30.4% 31.9% 37.7%
Yes, to second home 28.6% 28% 43.3%
Bold values represent cluster of the highest probability for each variable’s modalities.
representation of the persons with high diploma and executives. Bi Q, Wu Y, Mei S, Ye C, Zou X, Zhang Z, Liu X, Wei L, Truelove SA, Zhang T, Gao
This issue was mainly solved using partial models (logistic and W, Cheng C, Tang X, Wu X, Wu Y, Sun B, Huang S, Sun Y, Zhang J, … Feng
multinomial regressions) that taken into account all other vari- T (2020) Epidemiology and transmission of COVID-19 in 391 cases and 1286
of their close contacts in Shenzhen, China: A retrospective cohort study. Lancet
ables involved in the model to control for their effects. Second, we Infect Dis 20(8):911–919. https://doi.org/10.1016/S1473-3099(20)30287-5
did not obtain data during the first lockdown week. These data Bish A, Michie S (2010) Demographic and attitudinal determinants of protective
probably would have represented the most anxiogenic and most behaviours during a pandemic: a review. Br J Health Psychol 15(4):797–824.
uncertain time of the lockdown. Third, we did not record if https://doi.org/10.1348/135910710X485826
participants or their close relations were tested as positive to the Bodas M, Peleg K (2020) Self-isolation compliance in the COVID-19 Era influ-
enced by compensation: findings from a recent survey In Israel: public atti-
Covid-19. However, our objective was to identify the repre- tudes toward the COVID-19 outbreak and self-isolation: a cross sectional
sentations associated to the lockdown and not to obtain medical study of the adult population of Israel. Health Aff 39(6):936–941. https://doi.
information. In addition, recording such an information would org/10.1377/hlthaff.2020.00382
have required an approval by an ethical board, which would have Bolarinwa OA, Olagunju O, Babalola T, Saeed BQ (2020) Socio-demographic predictors
led to not obtain data during a large part (and potentially the of adherence to 2019 coronavirus prescribed recommendations and lockdown
psychological impacts: Perspectives of Nigerian social media users. J Public Health
entirety) of the lockdown. Res 9(4):1864. https://doi.org/10.4081/jphr.2020.1864
Brand M, Recknor EC, Grabenhorst F et al. (2007) Decisions under ambiguity and
Conclusion decisions under risk: correlations with executive functions and comparisons of
To sum up, respect of the lockdown measures was mainly altered two different gambling tasks with implicit and explicit rules. J Clin Exp Neu-
ropsychol 29(1):86–99. https://doi.org/10.1080/13803390500507196
by an unfavourable living environment (referring to social and Brooks SK, Webster RK, Smith LE et al. (2020) The psychological impact of
economic inequity), a high feeling of fear associated with a lack of quarantine and how to reduce it: rapid review of the evidence. Lancet 395
trust towards Governmental measures, and a low risk perception (10227):912–920. https://doi.org/10.1016/S0140-6736(20)30460-8
which lean on the feeling that others respected the measures. Calinski T, Harabasz J (1974) A dendrite method for cluster analysis. Commun Stat
Based on our findings, we confirm observations suggesting that —Theory Methods 3(1):1–27. https://doi.org/10.1080/03610927408827101
Carlucci L, D’Ambrosio I, Balsamo M (2020) Demographic and attitudinal factors
compliance is more impacted by situation perception than pre- of adherence to quarantine guidelines during COVID-19: the Italian model.
existing dispositions (Zajenkowski et al., 2020). Governments will Front Psychol 11:559288. https://doi.org/10.3389/fpsyg.2020.559288
have to broadcast skilled speeches (Everett et al., 2020) to increase Cauchemez S, Kiem CT, Paireau J et al. (2020) Lockdown impact on COVID-19
measures acceptance by improving trust (Fancourt et al., 2020), epidemics in regions across metropolitan France. Lancet 396(10257):1068–1069.
limiting fear and increasing cooperative behaviours. Reaching https://doi.org/10.1016/S0140-6736(20)32034-1
Chan EYY, Huang Z, Lo ESK et al. (2020) Sociodemographic predictors of health
such an objective is crucial and could contribute to decrease the risk perception, attitude and behavior practices associated with health-
need of future lockdown (López and Rodó, 2020). emergency disaster risk management for biological hazards: the case of
COVID-19 pandemic in Hong Kong, SAR China. Int J Environ Res Public
Data availability Health 17(11):3869. https://doi.org/10.3390/ijerph17113869
Chan HF, Skali A, Savage DA et al. (2020) Risk attitudes and human mobility
The dataset generated and analysed during the current study is during the COVID-19 pandemic. Sci Rep 10(1):19931. https://doi.org/
available from the corresponding author on reasonable request. 10.1038/s41598-020-76763-2
Charrad M, Ghazzali N, Boiteau V, Niknafs A (2014) NbClust: an R package for
Code availability determining the relevant number of clusters in a data set. J Stat Softw 61(6).
https://doi.org/10.18637/jss.v061.i06
The codes generated to analyse the dataset are available from the Chinazzi M, Davis JT, Ajelli M, Gioannini C, Litvinova M, Merler S, Pastore y
corresponding author on reasonable request. Piontti A, Mu K, Rossi L, Sun K, Viboud C, Xiong X, Yu H, Halloran ME,
Longini IM, Vespignani A (2020) The effect of travel restrictions on the
Received: 31 August 2020; Accepted: 26 January 2021; spread of the 2019 novel coronavirus (COVID-19) outbreak. Science
eaba9757. https://doi.org/10.1126/science.aba9757
Chu DK, Akl EA, Duda S et al. (2020) Physical distancing, face masks, and eye
protection to prevent person-to-person transmission of SARS-CoV-2 and
COVID-19: a systematic review and meta-analysis. The Lancet 395
(10242):1973–1987. https://doi.org/10.1016/S0140-6736(20)31142-9
Chung RY-N, Dong D, Li MM (2020) Socioeconomic gradient in health and the
References covid-19 outbreak. BMJ m1329. https://doi.org/10.1136/bmj.m1329
Ahorsu DK, Lin C-Y, Imani V, Saffari M, Griffiths MD, Pakpour AH (2020) The Clark C, Davila A, Regis M et al. (2020) Predictors of COVID-19 voluntary
Fear of COVID-19 Scale: development and initial validation. Int J Ment compliance behaviors: an international investigation. Glob Transit 2:76–82.
Health Addict. https://doi.org/10.1007/s11469-020-00270-8 https://doi.org/10.1016/j.glt.2020.06.003
Aslam F, Awan TM, Syed JH et al. (2020) Sentiments and emotions evoked by Cohen J (2013) Statistical power analysis for the behavioral sciences. Taylor and
news headlines of coronavirus disease (COVID-19) outbreak. Human Soc Sci Francis
Commun 7(1):23. https://doi.org/10.1057/s41599-020-0523-3 Davies DL, Bouldin DW (1979) A cluster separation measure. IEEE Trans Pattern Anal
Ball G, Hall D (1965) ISODATA, a novel method of data analysis and pattern Mach Intell PAMI-1(2), 224–227 https://doi.org/10.1109/TPAMI.1979.4766909
classification. Stanford Research Institute, Menlo Park DiGiovanni C, Conley J, Chiu D et al. (2004) Factors influencing compliance with
Bavel JJV, Baicker K, Boggio PS et al. (2020) Using social and behavioural science quarantine in Toronto during the 2003 SARS Outbreak. Biosecur Bioterror 2
to support COVID-19 pandemic response. Nat Hum Behav 4(5):460–471. (4):265–272. https://doi.org/10.1089/bsp.2004.2.265
https://doi.org/10.1038/s41562-020-0884-z Duan T, Jiang H, Deng X et al. (2020) Government intervention, risk perception, and
Beale E Cluster analysis. Scientific Control Systems, London the adoption of protective action recommendations: evidence from the COVID-
10 HUMANITIES AND SOCIAL SCIENCES COMMUNICATIONS | (2021)8:81 | https://doi.org/10.1057/s41599-021-00749-2HUMANITIES AND SOCIAL SCIENCES COMMUNICATIONS | https://doi.org/10.1057/s41599-021-00749-2 ARTICLE
19 prevention and control experience of China. Int J Environ Res Public Health Maunder R, Hunter J, Vincent L et al. (2003) The immediate psychological and
17(10):3387. https://doi.org/10.3390/ijerph17103387 occupational impact of the 2003 SARS outbreak in a teaching hospital. Can
Duda R, Hart P (1973) Pattern classification and scene analysis. John Wiley & Sons, Med Assocn J 168(10):1245–1251
New York McClain J, Rao V (1975) CLUSTISZ: a program to test for the quality of clustering
Dunn JC (1974) Well-separated clusters and optimal fuzzy partitions. J Cybern 4 of a set of objects. J Market Res 12(4):456–460
(1):95–104 Milligan GW (1980) An examination of the effect of six types of error perturbation
Duque-Calvache R, Torrado JM, Mesa-Pedrazas Á (2020) Lockdown and adap- on fifteen clustering algorithms. Psychometrika 45(3):325–342. https://doi.
tation: residential mobility in Spain during the COVID-19 crisis. Eur Soc 0 org/10.1007/BF02293907
(0):1–18. https://doi.org/10.1080/14616696.2020.1836386 Milligan GW, Cooper MC (1985) An examination of procedures for determining
Everett JAC, Colombatto C, Chituc V, Brady WJ, Crockett M (2020) The effectiveness the number of clusters in a data set. Psychometrika 50(2):159–179. https://
of moral messages on public health behavioral intentions during the COVID-19 doi.org/10.1007/BF02294245
pandemic [Preprint]. PsyArXiv. https://doi.org/10.31234/osf.io/9yqs8 Murphy K, Williamson H, Sargeant E, McCarthy M (2020) Why people comply
Fancourt D, Steptoe A, Wright L (2020) The Cummings effect: politics, trust, and with COVID-19 social distancing restrictions: Self-interest or duty? Austral N
behaviours during the COVID-19 pandemic. Lancet 396(10249):464–465. Z J Criminol 000486582095448. https://doi.org/10.1177/0004865820954484
https://doi.org/10.1016/S0140-6736(20)31690-1 Nicola M, Alsafi Z, Sohrabi C et al. (2020) The socio-economic implications of the
Friedman HP, Rubin J (1967) On some invariant criteria for grouping data. J Am Stat coronavirus pandemic (COVID-19): a review. Int J Surg 78:185–193. https://
Assoc 62(320):1159–1178. https://doi.org/10.1080/01621459.1967.10500923 doi.org/10.1016/j.ijsu.2020.04.018
Garcia T, Massoni S, Villeval MC (2018) Ambiguity and excuse-driven behavior in Nivette A, Ribeaud D, Murray A et al. (2021) Non-compliance with COVID-19-
charitable giving. SSRN Electron J. https://doi.org/10.2139/ssrn.3283773 related public health measures among young adults in Switzerland: insights
Gino F, Norton MI, Weber RA (2016) Motivated Bayesians: feeling moral while from a longitudinal cohort study. Soc Sci Med 268:113370. https://doi.org/
acting egoistically. J Econ Perspect 30(3):189–212. https://doi.org/10.1257/ 10.1016/j.socscimed.2020.113370
jep.30.3.189 Patel JA, Nielsen FBH, Badiani AA et al. (2020) Poverty, inequality and COVID-19:
Habersaat KB, Betsch C, Danchin M, Sunstein CR, Böhm R, Falk A, Brewer NT, The forgotten vulnerable. Public Health 183:110–111. https://doi.org/
Omer SB, Scherzer M, Sah S, Fischer EF, Scheel AE, Fancourt D, Kitayama S, 10.1016/j.puhe.2020.05.006
Dubé E, Leask J, Dutta M, MacDonald NE, Temkina A, … Butler R (2020) Pullano G, Valdano E, Scarpa N et al. (2020) Evaluating the effect of demographic
Ten considerations for effectively managing the COVID-19 transition. Nat factors, socioeconomic factors, and risk aversion on mobility during the
Hum Behav. https://doi.org/10.1038/s41562-020-0906-x COVID-19 epidemic in France under lockdown: a population-based study.
Halkidi M, Vazirgiannis M (2001) Clustering validity assessment: finding the Lancet Digit Health 2(12):e638–e649. https://doi.org/10.1016/S2589-7500(20)
optimal partitioning of a data set. In: Proceedings 2001 IEEE international 30243-0
conference on data mining, IEEE, p 187–194 R Core Team (2013) R: A language and environment for statistical computing. R
Halkidi M, Vazirgiannis M, Batistakis Y (2000) Quality scheme assessment in the Foundation for Statistical Computing. http://www.R-project.org/
clustering process. In: Zighed DA, Komorowski J, Żytkow J (eds) Principles Ratkowsky D, Lance G (1978) A criterion for determining the number of groups in
of data mining and knowledge discovery, vol 1910. Springer, Berlin, Hei- a classification. Australian Computer Journal 10(3):115–117
delberg, p 265–276 Reintjes R, Das E, Klemm C et al. (2016) “Pandemic Public Health Paradox”: time
Harper CA, Satchell LP, Fido D, Latzman RD (2020) Functional fear predicts series analysis of the 2009/10 Influenza A/H1N1 epidemiology, media
public health compliance in the COVID-19 pandemic. Int J Ment Health attention, risk perception and public reactions in 5 european countries. PLoS
Addict. https://doi.org/10.1007/s11469-020-00281-5 ONE 11(3):e0151258. https://doi.org/10.1371/journal.pone.0151258
Hartigan J (1975) Clustering algorithms. John Wiley & Sons, New York Reynolds B, Seeger WM (2005) Crisis and emergency risk communication as an
Hartley CA, Phelps EA (2012) Anxiety and decision-making. Biol Psychiatry 72 integrative model. J Health Commun 10(1):43–55. https://doi.org/10.1080/
(2):113–118. https://doi.org/10.1016/j.biopsych.2011.12.027 10810730590904571
Heilman RM, Crişan LG, Houser D et al. (2010) Emotion regulation and decision Rousseeuw PJ (1987) Silhouettes: a graphical aid to the interpretation and vali-
making under risk and uncertainty. Emotion 10(2):257–265. https://doi.org/ dation of cluster analysis. J Comput Appl Math 20:53–65. https://doi.org/
10.1037/a0018489 10.1016/0377-0427(87)90125-7
Holuka C, Merz MP, Fernandes SB et al. (2020) The COVID-19 pandemic: does Sarle W (1983) SAS Technical Report A-108. Cubic clustering criterion. SAS
our early life environment, life trajectory and socioeconomic status determine Institute Inc, Cary, NC
disease susceptibility and severity? Int J Mol Sci 21(14):5094. https://doi.org/ Sawilowsky SS (2009) New effect size rules of thumb. J Mod Appl Stat Methods 8
10.3390/ijms21145094 (2):597–599. https://doi.org/10.22237/jmasm/1257035100
Huang F, Ding H, Liu Z et al. (2020) How fear and collectivism influence public’s Scott A, Symons M (1971) Clustering methods based on likelihood ratio criteria.
preventive intention towards COVID-19 infection: a study based on big data Biometrics 27(2):387–397. https://doi.org/10.2307/2529003
from the social media. BMC Public Health 20(1):1707. https://doi.org/ Serrano-Ripoll MJ, Meneses-Echavez JF, Ricci-Cabello I et al. (2020) Impact of viral
10.1186/s12889-020-09674-6 epidemic outbreaks on mental health of healthcare workers: A rapid systematic
Huang Y, Zhao N (2020) Generalized anxiety disorder, depressive symptoms and sleep review and meta-analysis. J Affect Disord 277:347–357. https://doi.org/10.1016/
quality during COVID-19 epidemic in China: a web-based cross-sectional sur- j.jad.2020.08.034
vey. Psychiatry Res 288:112954. https://doi.org/10.1016/j.psychres.2020.112954 Sharot T (2011) The optimism bias. Curr Biol 21(23):R941–R945. https://doi.org/
Hubert LJ, Levin JR (1976) A general statistical framework for assessing categorical 10.1016/j.cub.2011.10.030
clustering in free recall. Psychol Bull 83(6):1072–1080. https://doi.org/ Sheikh A, Sheikh Z, Sheikh A (2020) Novel approaches to estimate compliance
10.1037/0033-2909.83.6.1072 with lockdown measures in the COVID-19 pandemic. J Glob Health 10
INSEE (2020) Population présente sur le territoire avant et après le début du (1):010348. https://doi.org/10.7189/jogh.10.010348
confinement—Premiers résultats. INSEE Shinan-Altman S, Levkovich I (2020) COVID-19 precautionary behavior: the
Koh D (2020) Occupational risks for COVID-19 infection. Occup Med 70(1):3–5. Israeli case in the initial stage of the outbreak. BMC Public Health 20(1):1718.
https://doi.org/10.1093/occmed/kqaa036 https://doi.org/10.1186/s12889-020-09818-8
Krzanowski WJ, Lai YT (1988) A criterion for determining the number of groups Storopoli J, Braga da Silva Neto WL, Mesch GS (2020) Confidence in social
in a data set using sum-of-squares clustering. Biometrics 44(1):23. https://doi. institutions, perceived vulnerability and the adoption of recommended pro-
org/10.2307/2531893 tective behaviors in Brazil during the COVID-19 pandemic. Soc Sci Med
Lewnard JA, Lo NC (2020) Scientific and ethical basis for social-distancing inter- (1982), 113477. https://doi.org/10.1016/j.socscimed.2020.113477
ventions against COVID-19. Lancet Infect Dis 20(6):631–633. https://doi.org/ Strang S, Park SQ (2016) Human cooperation and its underlying mechanisms. In:
10.1016/S1473-3099(20)30190-0 Wöhr M, Krach S (eds) Social behavior from rodents to humans, vol 30.
Liao J, Fan S, Chen J et al. (2020) Epidemiological and clinical characteristics of Springer International Publishing, p 223–239
COVID-19 in adolescents and young adults Innovation (NY) 1(1):100001. Taylor MR, Agho KE, Stevens GJ et al. (2008) Factors influencing psychological
https://doi.org/10.1016/j.xinn.2020.04.001 distress during a disease epidemic: Data from Australia’s first outbreak of
López L, Rodó X (2020) The end of social confinement and COVID-19 re-emer- equine influenza. BMC Public Health 8(1):347. https://doi.org/10.1186/1471-
gence risk. Nat Hum Behav 4(7):746–755. https://doi.org/10.1038/s41562- 2458-8-347
020-0908-8 Tian H, Liu Y, Li Y et al. (2020) An investigation of transmission control measures
Marriott FHC (1971) Practical problems in a method of cluster analysis. Biometrics during the first 50 days of the COVID-19 epidemic in China. Science 368
27(3):501. https://doi.org/10.2307/2528592 (6491):638–642. https://doi.org/10.1126/science.abb6105
Martarelli CS, Wolff W (2020) Too bored to bother? Boredom as a potential threat Tibshirani R, Walther G, Hastie T (2001) Estimating the number of clusters in a
to the efficacy of pandemic containment measures. Human Soc Sci Commun data set via the gap statistic. J R Stat Soc Ser B 63(2):411–423. https://doi.org/
7(1):28. https://doi.org/10.1057/s41599-020-0512-6 10.1111/1467-9868.00293
HUMANITIES AND SOCIAL SCIENCES COMMUNICATIONS | (2021)8:81 | https://doi.org/10.1057/s41599-021-00749-2 11You can also read