Wet deposition in the remote western and central Mediterranean as a source of trace metals to surface seawater
←
→
Page content transcription
If your browser does not render page correctly, please read the page content below

Research article
Atmos. Chem. Phys., 22, 2309–2332, 2022
https://doi.org/10.5194/acp-22-2309-2022
© Author(s) 2022. This work is distributed under
the Creative Commons Attribution 4.0 License.

              Wet deposition in the remote western and central
                 Mediterranean as a source of trace metals
                            to surface seawater
          Karine Desboeufs1 , Franck Fu1 , Matthieu Bressac2,3 , Antonio Tovar-Sánchez4 , Sylvain Triquet1 ,
          Jean-François Doussin5 , Chiara Giorio6,7 , Patrick Chazette8 , Julie Disnaquet9,10 , Anaïs Feron1 ,
        Paola Formenti1 , Franck Maisonneuve5 , Araceli Rodríguez-Romero4 , Pascal Zapf5 , François Dulac8 ,
                                                and Cécile Guieu3
              1 Université   de Paris and Univ Paris Est Creteil, CNRS, LISA, UMR 7583, 75013 Paris, France
             2 Institute  for Marine and Antarctic Studies, University of Tasmania, Hobart, Tasmania, Australia
                      3 Sorbonne Université, CNRS, Laboratoire d’Océanographie de Villefranche, LOV,

                                              06230 Villefranche-sur-Mer, France
           4 Department of Ecology and Coastal Management, Institute of Marine Sciences of Andalusia (CSIC),

                                                11510 Puerto Real, Cádiz, Spain
              5 Univ Paris Est Creteil and Université de Paris, CNRS, LISA, UMR 7583, 94010 Créteil, France
                            6 Laboratoire de Chimie de l’Environnement (LCE), UMR 7376 CNRS,

                                        Aix-Marseille Université, 13331 Marseille, France
                    7 Yusuf Hamied Department of Chemistry, University of Cambridge, Lensfield Road,

                                            CB2 1EW, Cambridge, United Kingdom
           8 Laboratoire des Sciences du Climat et de l’Environnement (LSCE), UMR 8212 CEA-CNRS-UVSQ,

                        Institut Pierre-Simon Laplace, Univ. Paris-Saclay, 91191 Gif-sur-Yvette, France
        9 Marine Biology Research Division, Scripps Institution of Oceanography, UCSD, La Jolla, CA 92037, USA
                    10 Sorbonne Université, CNRS, Laboratoire d’Océanographie Microbienne, LOMIC,

                                                66650 Banyuls-sur-Mer, France
                             Correspondence: Karine Desboeufs (karine.desboeufs@lisa.ipsl.fr)

                                   Received: 22 July 2021 – Discussion started: 25 August 2021
                       Revised: 12 January 2022 – Accepted: 16 January 2022 – Published: 18 February 2022

      Abstract. This study reports the only recent characterization of two contrasted wet deposition events collected
      during the PEACETIME (ProcEss studies at the Air–sEa Interface after dust deposition in the MEditerranean
      Sea) cruise in the open Mediterranean Sea (Med Sea) and their impact on trace metal (TM) marine stocks. Rain
      samples were analysed for Al, 12 TMs (Co, Cd, Cr, Cu, Fe, Mn, Mo, Ni, Pb, Ti, V and Zn) and nutrient (N,
      P, dissolved organic carbon) concentrations. The first rain sample collected in the Ionian Sea (Rain ION) was
      a typical regional background wet deposition event, whereas the second rain sample collected in the Algerian
      Basin (Rain FAST) was a Saharan dust wet deposition event. Even in the remote Med Sea, all background TM
      inputs presented an anthropogenic signature, except for Fe, Mn and Ti. The concentrations of TMs in the two
      rain samples were significantly lower compared to concentrations in rains collected at coastal sites reported in
      the literature, due to the decrease in anthropogenic emissions during the preceding decades. The atmospheric TM
      inputs were mainly dissolved forms, even in dusty Rain FAST. The TM stocks in the mixed layer (ML, 0–20 m)
      at the FAST station before and after the event showed that the atmospheric inputs were a significant supply of
      particulate TMs and dissolved Fe and Co for surface seawater. Even if the wet deposition delivers TMs mainly
      in soluble form, the post-deposition aerosol dissolution could to be a key additional pathway in the supply of
      dissolved TMs. At the scale of the western and central Mediterranean, the atmospheric inputs were of the same
      order of magnitude as ML stocks for dissolved Fe, Co and Zn, highlighting the role of the atmosphere in their

Published by Copernicus Publications on behalf of the European Geosciences Union.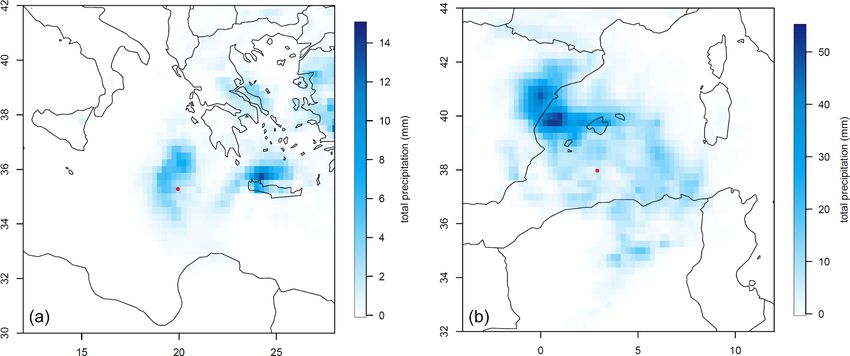
2310                                   K. Desboeufs et al.: Wet deposition in the remote western and central Mediterranean

       biogeochemical cycles in the stratified Med Sea. In case of intense dust-rich wet deposition events, the role of
       atmospheric inputs as an external source was extended to dissolved Co, Fe, Mn, Pb and Zn. Our results suggest
       that the wet deposition constitutes only a source of some of dissolved TMs for Med Sea surface waters. The
       contribution of dry deposition to the atmospheric TM inputs needs to be investigated.

1   Introduction                                                    ment of dissolved TMs (Cd, Co, Cu, Fe) in the Med Sea sur-
                                                                    face microlayer (SML) (Tovar-Sánchez et al., 2014). For the
Atmospheric deposition of continental aerosol has long been         water column, the adding of dissolved Fe and Mn was em-
recognized to influence trace element concentrations in re-         phasized in mesocosm experiments after dust addition mim-
mote oceanic surface waters (Buat-Ménard and Chesselet,             icking intense wet dust deposition (Wuttig et al., 2013). Ba-
1979; Hardy, 1982; Buat-Ménard, 1983). In particular, the           connais et al. (2019) showed that the dissolved Cu isotope
Mediterranean Sea (Med Sea) is an oligotrophic environment          signature in surface waters could be related to Saharan dust
of nutrient-limited marine microbial growth during the long         deposition in the southern Med Sea. By comparison based
Mediterranean summer season, which is characterized by a            on annual or monthly deposition measurements and marine
strong thermal stratification of surface waters (The Mermex         concentrations, the potential role of atmospheric deposition
Group, 2011). The Mediterranean atmosphere is character-            as source of dissolved Co and Fe for Mediterranean surface
ized by the permanent presence of anthropogenic aerosols            waters was also pointed out (Bonnet and Guieu, 2006; Du-
from industrial and domestic activities around the basin (e.g.      laquais et al., 2017). Due to sporadic and intense Mediter-
Sciare et al., 2003; Kanakidou et al., 2011). In addition to this   ranean storms, scavenging air masses loaded with anthro-
anthropogenic background, the Mediterranean Basin is also           pogenic aerosols or Saharan dust could lead to higher TM
subject to seasonal contributions of particles from biomass         deposition fluxes by rain than dry deposition (Desboeufs,
fires in summer (Guieu et al., 2005) and to intense sporadic        2022). Moreover, even if annual wet and dry deposition are
Saharan dust inputs (e.g. Loÿe-Pilot and Martin, 1996; Vin-         equivalent in the Mediterranean (Theodosi et al., 2010), wet
cent et al., 2016). Several studies have emphasized that the        deposition is known to provide dissolved and potentially
atmospheric deposition of aerosols, notably through wet de-         bioavailable forms of TMs (Jickells et al., 2016). Yet, to the
position, plays a significant role in the marine cycles of nu-      best of our knowledge, the direct impact of wet deposition on
trients, such as nitrogen (N) and phosphorus (P) (e.g. Pulido-      TM concentrations in surface seawater has not been studied
Villena et al., 2010; Richon et al., 2018a, b; Violaki et al.,      at same location by concurrently collecting both rainwater
2018), and micronutrients, such as iron (Fe) (Bonnet and            and seawater samples before this work (either in the Med
Guieu, 2006). Recently, atmospheric dust inputs were iden-          Sea or in other oceanic regions).
tified to have a fertilizing effect on planktonic stocks and           Two key criteria used to assess the potential impact of TMs
fluxes, even in the presence of relatively high dissolved N,        and nutrients are their respective concentrations (or fluxes)
P and Fe concentrations (Ridame et al., 2011; reviewed in           and fractional solubility (hereafter referred to as solubility),
Guieu and Ridame, 2022). Mackey et al. (2012) showed that           i.e. the partitioning between dissolved and total concentra-
trace metals (TMs) provided by dust deposition could explain        tions in rainwater. Indeed, the dissolved fraction of nutrients
this fertilizing effect. Indeed, many TMs, including Mn, Co,        and TMs is considered a surrogate for their bioavailability
Ni (Mackey et al., 2012), Cu (Annett et al., 2008) and Zn           (Jickells et al., 2016). The following studies have reported
(Morel et al., 1991), play physiological roles for phytoplank-      concentrations of TMs in rainwater samples collected around
tonic organisms. These TMs are present in very low concen-          the Mediterranean Basin: Al-Momani et al. (1998), Kanel-
trations in oligotrophic systems such as the Med Sea, possi-        lopoulou, (2001), and Özsoy and Örnektekin, (2009) in the
bly limiting (or co-limiting) phytoplankton growth (Pinedo-         eastern basin and Losno (1989), Guieu et al. (1997), Frau et
Gonzàles et al., 2015) and pointing to the importance of            al. (1996), Chester et al. (1997) and Guerzoni et al. (1999)
dust deposition as a source of TMs for planktonic communi-          in the western basin. These studies led to highly variable TM
ties. On the other hand, atmospheric deposition of European         concentrations and solubilities, illustrating the large variabil-
aerosols was identified to have a negative effect on chloro-        ity of TM inputs during wet deposition events in the Med
phyll concentrations (Gallisai et al., 2014) by providing Cu        Sea (reviewed in Desboeufs, 2022). All of these studies were
at toxic levels (Jordi et al., 2012).                               performed at coastal sites. Offshore samples of rainwater
    The atmospheric deposition of TMs in the Mediterranean          have rarely been reported in the literature. In the Mediter-
is related to both dust and anthropogenic aerosol deposition        ranean, to our knowledge, only trace element concentrations
(Desboeufs et al., 2018). The role of dust deposition as a          from three rain samples collected at sea in April 1981 have
source of TMs was observed from the correlation between             been reported in a PhD thesis (Dulac, 1986). However, due
the atmospheric deposition of mineral dust and the enrich-          to the continental and local sources of pollution, the variety

Atmos. Chem. Phys., 22, 2309–2332, 2022                                               https://doi.org/10.5194/acp-22-2309-2022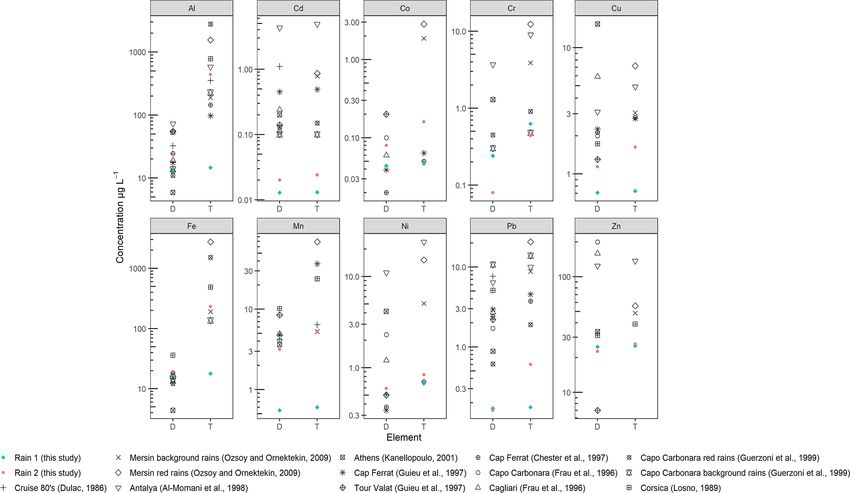
K. Desboeufs et al.: Wet deposition in the remote western and central Mediterranean                                        2311

of anthropogenic aerosol sources (Amato et al., 2016), and        avoid contamination by the ship’s exhaust, as the chimney
the physico-chemical processes during atmospheric aerosol         was situated on the lower deck and behind the collector.
transport (chemical ageing, dispersion, gravitational settling,      Immediately after sampling, the collector was disassem-
in-cloud reactivity) (Weinzierl et al., 2017), the TM rain com-   bled under a laminar flow hood inside an on-board clean-
position of the coastal zone may not be representative of at-     room laboratory. The dissolved fraction was separated into
mospheric deposition to the remote Mediterranean.                 four aliquots dedicated to (i) TM determination using induc-
   The PEACETIME cruise (ProcEss studies at the Air–sEa           tively coupled plasma-coupled (ICP) methods, (ii) major ion
Interface after dust deposition in the MEditerranean Sea) per-    analysis by ion chromatography (IC), (iii) dissolved organic
formed in spring 2017 aimed to study the impacts of atmo-         carbon (DOC) determination by high-temperature catalytic
spheric deposition, in particular Saharan dust events, on the     oxidation (HTCO) on a Shimadzu total organic carbon anal-
physical, chemical and biological processes in this marine        yser (as described in Van Wambeke et al., 2021a) and (iv) pH
oligotrophic environment (Guieu et al., 2020a). We inves-         measurement. For ICP measurements, the sample was acid-
tigated the concentration and solubility of TMs and nutri-        ified immediately to 1 % by volume of ultra-pure nitric acid
ents from two rain events sampled in the central and western      (HNO3 67 %–69 %, Ultrapur, Normatom® , VWR). For IC
Med Sea during the cruise. We compared our results with           analysis, the filtrate was immediately frozen. For DOC anal-
the existing literature on TM concentrations in offshore and      ysis, the filtrate was collected into pre-combusted glass am-
coastal rain samples dating from the 1990s to investigate the     poule and acidified to pH 2 with phosphoric acid. The am-
time evolution of TM concentrations and potential differ-         poule was immediately sealed and stored in the dark at room
ences with the open sea. Additionally, to assess the impact       temperature.
of wet deposition on the surface TM concentrations, surface          The filter (particulate fraction) was dried under the lam-
seawater and rainwater were concurrently collected. This is       inar flow hood and then put in a storage box and packed
the first time TM data for these atmospheric and marine com-      with a plastic bag to avoid contamination. After returning to
partments in the Med Sea have all been discussed at the same      the laboratory, filters were acid-digested by using the pro-
time and in the same place.                                       tocol adapted from Heimburger et al. (2012) as follows: fil-
                                                                  ters were placed in tightly capped Savillex™ PFA digestion
                                                                  vessels with 4 mL of a mixture of HNO3 (67 %–69 %, Ultra-
2     Sampling and methods                                        pur, Normatom® , VWR), H2 O and hydrofluoric (HF) acids
                                                                  (40 %, Ultrapur, Normatom® , VWR) at a ratio of 3 : 1 : 0.5
2.1    Sampling and chemical analysis of rainwater                and then heated in an oven at 130 ◦ C for 14 h. After cooling,
                                                                  the acid solution was completely evaporated on a heater plate
The        PEACETIME            oceanographic       campaign      (ANALAB, 250, A4) at 140 ◦ C for about 2 h, and thereafter
(https://doi.org/10.17600/17000300, Guieu et al., 2020b)          0.5 mL of H2 O2 (30 %–32 %, Romil-UpA™) and 1 mL of
took place in the western and central Med Sea on board the        the acidified water (2 % HNO3 ) was added to the vessels and
French R/V Pourquoi Pas? between 11 May and 10 June               heated for 30 min to dissolve the dry residue in the bottom
2017, i.e. at the beginning of the Mediterranean stratification   of the vessels. Finally, 12 mL of acidified water (1 % HNO3 )
season (Guieu et al., 2020a). The rain collector was installed    was added to obtain 13.5 mL of solution in a tube for ICP
on the upper deck (22 m above sea level) where no on-board        analyses.
activities were taking place to avoid contamination. The rain        The dissolved fractions and the solutions issued from di-
collector was equipped with an online filtration system to        gestion of the particulate fractions were analysed by ICP-
separate the dissolved and particulate fractions at the time      AES (inductively coupled plasma atomic emission spectrom-
of collection (details of the filtration system are available     etry, Spectro ARCOS Ametek® , Desboeufs et al., 2014) for
in Heimburger et al., 2012), allowing for the calculation         major elements (Al, Ca, K, Mg, Na, S) and by HR-ICP-MS
of solubility of TMs in the rainwater. The filtration device      (high-resolution inductively coupled plasma mass spectrom-
was equipped with a Nuclepore® polycarbonate membrane             etry, Neptune Plus™ at Thermo Scientific™) for P and the
filter (porosity: 0.2 µm; diameter: 47 mm). The diameter of       following TMs: Cd, Co, Cr, Cu, Fe, Mn, Mo, Ni, Pb, Ti,
the funnel of the collector was 24 cm. The rain collector         V and Zn. The dissolved fraction was analysed by IC (IC
was installed only when rain was expected and was covered         850 Metrohm) for the inorganic and organic anions (NO−       2,
                                                                      −       3−      2−
by an acid-washed sealed plastic film when not in use. All        NO3 , PO4 , SO4 , F , Cl , Br , HCOO , CH3 COO− ,
                                                                                           −     −     −          −
the sampling materials were thoroughly acid-washed in the         C2 H5 COO− , MSA, C2 O2−                             +
                                                                                             4 ) and for the cation NH4 (Mallet
laboratory prior to the cruise departure (the washing proto-      et al., 2019). Only TMs, major nutrients (i.e. N and P species)
col is described in Heimburger et al., 2012). No stabilizing      and Al are discussed in this paper. The speciation of dis-
device was used to keep the funnel level during the pitch         solved P was estimated by determining dissolved inorganic
and roll of the ship, preventing a precise assessment of the      phosphorus (DIP) from phosphate concentrations expressed
height of rainfall from the collected water volume. During        as P, and the dissolved organic phosphorus (DOP) was deter-
the rain sampling, the R/V was always facing the wind to

https://doi.org/10.5194/acp-22-2309-2022                                         Atmos. Chem. Phys., 22, 2309–2332, 2022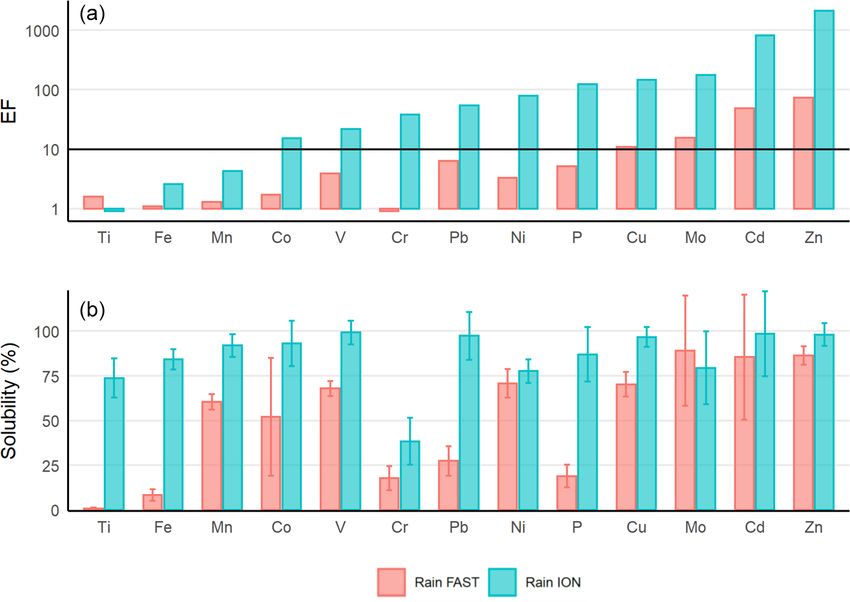
2312                                   K. Desboeufs et al.: Wet deposition in the remote western and central Mediterranean

mined from the difference between total dissolved phospho-         25 and 55 sr for the first and second layer, respectively. The
rus (TDP), obtained by HR-ICP-MS, and DIP, obtained by             vertical profile of the aerosol extinction coefficient was re-
IC. Dissolved inorganic nitrogen (DIN) was defined as the          trieved from 0.2 km a.m.s.l. upwards with a vertical resolu-
sum of NO−        −         +
            2 , NO3 and NH4 and was expressed as N.                tion of 15 m. Based on these profiles, the integrated column
   In order to estimate the contamination of sampling and          content of dust aerosols was estimated using a specific ex-
analytical protocols, three blanks of rain samples that were       tinction cross section of 1.1 m2 g−1 as proposed by Raut and
collected on board during the cruise were used and pro-            Chazette (2009).
cessed. Blank samples were prepared by rinsing the funnel             In addition, detailed meteorological data such as air and
with 150 mL of ultrapure water (18.2 m cm) with the same          sea temperature, atmospheric pressure, relative humidity, at-
protocol of rain collection. The procedural limit of detec-        mospheric pressure, heat flux, and wind speed and direction
tion (LoD) was defined as 3 times the standard deviation           were provided on a 30 s time step basis by the ship’s perma-
of blank samples both for dissolved and particulate fractions      nent instrumentation.
estimated after acid digestion. All dissolved and particulate
sample concentrations were higher than the LoD, except for         2.3   Sampling and analysis of dissolved TMs in seawater
NO− 2 in the two rain samples. The blank concentrations rep-
resented 10.2 % on average for TMs and were typically lower        TM samples were also collected in the water column using a
than 20 % of the sample concentrations, except for Cd (52 %)       titanium trace metals clean (TMC) rosette (mounted with 24
and Mo (43 %) in the dissolved fraction. Blank concentra-          teflon-coated Go-Flo bottles) before and after the rain event
tions were subtracted from all sample concentrations.              (Bressac et al., 2021). Although rosette deployments were
                                                                   performed over the whole water column, we focus here on
2.2    Atmospheric ancillary measurements
                                                                   the 0–20 m marine mixed layer (ML). Immediately after re-
                                                                   covery, the Go-Flo bottles were transferred inside a Class 100
The PEGASUS (PortablE Gas and Aerosol Sampling UnitS,              clean laboratory container. Seawater samples were directly
https://www.pegasus.cnrs.fr/, last acess: 11 February 2022)        filtered from the bottles through acid-cleaned 0.2 µm capsule
mobile platform of LISA is a self-contained facility based         filters (Sartorius Sartobran P capsule 0.45 and 0.2 µm). All
on two standard 20 ft (121.16 m) containers that are adapted       samples were acidified on board to pH < 2 with Ultrapure-
with air-conditioning, rectified power, air intake, and ex-        grade HCl under a Class 100 HEPA laminar flow hood. Met-
hausts for sampling and online measurements of atmospheric         als (namely Cd, Co, Cu, Ni, Mo, V, Zn and Pb) were pre-
aerosols and gaseous compounds and their analysis (For-            concentrated using an organic extraction method (Bruland et
menti et al., 2019). During the PEACETIME cruise, only the         al., 1979) and quantified by ICP-MS (Perkin Elmer ELAN
sampling module of the facility was deployed on the star-          DRC-e) in the home laboratory. The accuracy of the pre-
board side of deck 7 of the R/V. The PEGASUS instrumental          concentration method and analysis for TMs was established
payload of relevance to this paper included measurements of        using seawater reference material (CASS 6, NRC-CNRC)
the major gases such as NOx , SO2 , O3 and CO by online            with recoveries ranging from 89 % for Mo to 108 % for Pb.
analysers (Horiba APNA, APSA, APOA and PICARRO, re-                Due to the complexity of the analytical method, all the TMC
spectively; 2 min resolution, with a detection limit of 1 ppb      samplings were not analysed for Cd, Co, Cu, Ni, Mo, V,
for CO and 0.5 for all other gases). These gases were used to      Zn and Pb. Overall, one or two depths were obtained in the
estimate the origins of sampled air.                               mixed layer (0–20 m). Dissolved Fe and Al concentrations
   From the first of June 2017 (the device was not operational     were also measured on board. Dissolved Fe concentrations
before this date), additional measurements by an ALS450®           were measured using an automated flow injection analysis
Rayleigh–Mie lidar (Leosphere™; Royer et al., 2011) were           (FIA) with online preconcentration and chemiluminescence
used to monitor the vertical distribution of aerosols over time    detection (Bonnet and Guieu, 2006), and dissolved Al con-
and the associated integrated columns. The vertical lidar pro-     centrations were measured using the fluorometric method de-
files were analysed to yield the apparent backscatter coef-        scribed by Hydes and Liss (1976). Sampling and analysis
ficient (ABC) corrected from the molecular transmission,           for dissolved Fe and Al concentrations are fully described
as well as the volume depolarization ratio (VDR). The in-          in Bressac et al. (2021) and covered at least four depths in
version procedure (Chazette et al., 2016, 2019) to retrieve        the 0–20 m mixed layer.
the aerosol extinction coefficient (unit km−1 ) used a vertical-
dependent lidar ratio that took into account two aerosol lay-      2.4   Concurrent sampling strategy
ers. The first layer corresponded to marine aerosols in the
marine boundary layer (MBL), and the second layer corre-           Our sampling strategy of collecting seawater before and after
sponded to a desert aerosol layer that could extend between        rains was chosen to trace the fate of atmospheric TMs and
∼ 1 and 6 km above mean sea level (a.m.s.l.). In accordance        nutrients in the water column after wet deposition events in
with Chazette et al. (2016), who worked at the same wave-          an open ocean. The sampling time resolution was optimized
length and in the same region, the lidar ratios were set to        to obtain results before and after rains; however, this strategy

Atmos. Chem. Phys., 22, 2309–2332, 2022                                             https://doi.org/10.5194/acp-22-2309-2022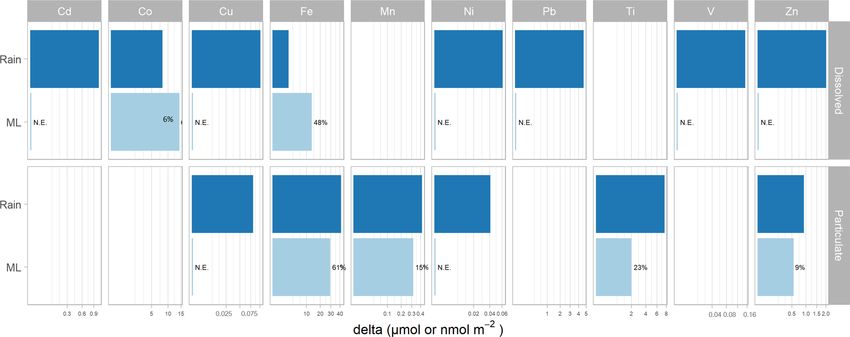
K. Desboeufs et al.: Wet deposition in the remote western and central Mediterranean                                          2313

was very dependent on meteorological conditions. The time         where SX % is the solubility (in %) of an element X in the
chart of the sampling of rain and surface water is presented      rainwater and [X]dissolved and [X]total are its soluble and total
in Fig. 1.                                                        concentration, respectively.
   The potential enrichment of the ML was estimated by
comparing atmospheric wet deposition fluxes and marine            2.6   Atmospheric wet deposition fluxes
stocks in particulate and dissolved fraction and by calcu-
lating the difference (delta) in TM stocks before and after       Impacts on biogeochemical cycles and ecosystem function-
rain. Due to the long time (48 h) between ML27 and ML29,          ing following a rain event occur on timescales of a few days
and hence the possible change of water masses between the         (2–3) and space scales of tens of kilometres (about 20–50 km
two samplings, it was excluded to obtain reliable background      within the radius of the R/V position). In the specific context
concentration levels. As a consequence, the enrichment of         of oceanographic cruising, the documentation of these im-
the ML was not calculated for the Ionian Sea (ION) station.       pacts is restricted to the vertical dimension at the prescribed
Dust rain deposition over the Algerian Basin (FAST) station       temporal scale. In this vertical dimension, the exchange of
area started on 3 June (see Sect. 3.1). Bressac et al. (2021)     TMs into the ML was controlled both by atmospheric inputs
showed that the dust signature, traced by changes in Al and       over the R/V position and by advection from surrounding wa-
Fe particulate stocks in the ML, was already visible from the     ter masses that may have been impacted by surrounding rain-
ML03 sampling but not for dissolved stocks. However, they         fall. Therefore, we had to consider this process in our estima-
also presumed that the water mass sampled before deposition       tion of the atmospheric flux contributions. For this purpose,
(ML02) was different from the one sampled during the rest         the atmospheric fluxes have to be integrated to the extent of
of the time series (ML03 to ML06) but was representative          the rain area that can impact the marine surface layers. We
of particulate background level. As a consequence, we de-         derived wet deposition fluxes by considering the total precip-
fined the enrichment of the ML as the difference between the      itation accumulated during the duration of the rain over the
stocks after rains (ML05+4) and the initial seawater stocks,      area around the R/V position (in a radius of ∼ 25 km). Thus,
i.e. ML02 for particulate stocks (before dust signature) and      the wet deposition fluxes were calculated by multiplying the
ML04 for dissolved stocks (the closest sampling before the        TM concentrations (µg L−1 or µmol L−1 ) in our rain samples
rain).                                                            by the total precipitation (mm) in this area. The total pre-
                                                                  cipitation of the rain events was issued from the hourly total
                                                                  precipitation accumulated during the rain events over the re-
2.5    Enrichment factor and solubility                           gion from ERA5 ECMWF reanalysis (Hersbach et al., 2018)
                                                                  and (where possible) from the rain rate composite radar prod-
In order to better constrain the origin of TMs in the rain sam-
                                                                  ucts from the European OPERA database (Saltikoff et al.,
ples, their enrichment factors (EFs; Rahn, 1976) relative to
                                                                  2019). Although subject to uncertainties (Morin et al., 2003),
the Earth’s crust were calculated based on their total concen-
                                                                  a surface-based weather radar is probably the best tool to
trations (dissolved + particulate fractions) as follows:
                                                                  estimate rainfall in the surroundings of the R/V since this
       ([X]/[Al])sample                                           method is a direct measurement of precipitation with both
EF =                    ,                                  (1)    the best time and spatial resolution in comparison to model
        ([X]/[Al])crust
                                                                  estimations. However, the OPERA database does not include
where [X]/[Al] is the ratio between an element X and Al           Italian radars, which did not cover the central area of the Io-
concentrations in rainwater samples (at the numerator) and        nian Sea during the cruise anyway. ERA5 data were available
in the upper continental crust (denominator) from Rudnick         on regular latitude–longitude grids at 0.25◦ × 0.25◦ resolu-
and Gao (2003). Aluminium is currently used as a reference        tion. The accumulated precipitation was taken from the grid
element as it predominantly has a crustal origin. For a given     points spanning the R/V location, i.e. ±0.25◦ around the cen-
TM, EF > 1 indicates an enrichment with respect to the aver-      tral grid point, to integrate the regional variability. Surface
age composition of the Earth’s crust. To account for the soil     rain rate radar composite images were available every 15 min
composition variability of mineral dust sources, TMs with an      with a spatial resolution of 2 km × 2 km. The accumulated
EF value > 10 are considered significantly enriched, which        precipitation was the sum of integrated rain rates during the
points to a non-crustal source (Rahn, 1976). For most met-        rain duration averaged over the radar pixels spanning the R/V
als, enrichment shows important input from anthropogenic          location within a radius of about 25 km.
sources, due to their low content in other non-crustal sources
such as sea spray or biogenic aerosols (Jickells et al., 2016).   2.7   Stocks in the surface seawater
   The fractional solubility of TMs in the two rainwater
events was calculated as follows:                                 The trace metal stocks within the ML were calculated by
                                                                  trapezoidal integrations of marine concentrations from TMC
         [X]dissolved                                             rosette samplings. The upper water column was stratified
SX % =                × 100,                               (2)    along the cruise transect (Taillandier et al., 2020), with a
           [X]total

https://doi.org/10.5194/acp-22-2309-2022                                          Atmos. Chem. Phys., 22, 2309–2332, 2022
2314 K. Desboeufs et al.: Wet deposition in the remote western and central Mediterranean
Figure 1. Sampling chronology during the ION and FAST stations for the ML and rains. The blue periods correspond to rainfall in the
vicinity of the R/V position (from ERA 5 reanalysis and radar imagery; see Sect. 3.1.), and blue triangles correspond to the rainfall on the
R/V position. Samplings were performed 4 d (ML25) and 2 d (ML27) before and 2 h (ML29) after Rain ION and at a higher frequency at
FAST, i.e. 57 (ML02), 37 (ML03) and 7.5 (ML04) hours before and 4.5 (ML05+4), 12 (ML05+12), and 24 h (ML06) after Rain FAST.
mixed-layer depth (MLD) ranging from 7 to 21 m (11 to 21 m 3.1.1 Rain ION
at ION and 11 to 19 m at FAST (Van Wambeke et al., 2021b).
The MLD fluctuations, for example due to wind peaks asso- The ERA 5 data reanalysis shows two periods of precipi-
ciated with rain events, could create rapidly changing con- tation in the vicinity of the R/V position, i.e. in the morn-
ditions of vertical advection from deeper waters. However, ing and evening of 26 June (not shown) and in the night
with no significant increase in TM concentrations being ob- between 28 and 29 June 2017, in agreement with on-board
served below the ML down to about 50 m (not shown), the visual observations. The rain event collected at ION was
enrichment observed in the ML after rain could not be at- the product of a large cloud system, covering an area of
tributed to any mixing with deeper water due to high wind. about 90 000 km2 around the R/V position and spreading
As a consequence, stocks in the ML have been integrated over the Ionian and Aegean seas (Fig. 2). As no radar mea-
over a constant depth range of 0–20 m for comparison, in ac- surements were available for this area, the accumulated pre-
cordance with Bressac et al. (2021). For Cu, Fe, Ni, and Zn cipitation (3.5 ± 1.2 mm) was estimated from ERA 5 data re-
stocks were estimated for both the dissolved and particulate analysis on the grid point corresponding to the ION station
fractions in the ML; for Co, Cd, Mo, Pb, and V for the dis- (±0.25◦ ) around the R/V position. The wash out of the at-
solved fraction only (particulate fraction was not analysed); mospheric particles was revealed by the decrease in aerosol
and for Mn and Ti for the particulate fraction only. The par- number concentrations monitored on board from about 1900
ticulate and dissolved fractions of TM stock or fluxes will be to 300 part. cm−3 (Supplement Fig. S1). Air mass back-
referred to as pTM and dTM, respectively. trajectories showed that the scavenged air masses came from
The partitioning coefficient between the particulate and Greece both in the marine boundary layer and in the free tro-
dissolved phases (Kd = [particulate]/[dissolved]) was used posphere (Fig. S1). The satellite observations also showed
to investigate exchange between the dissolved and particu- low aerosol optical thickness during this period (not shown),
late pools of TMs. meaning that there were only low amounts of aerosols in
the atmospheric column. No significant European pollution
influence was monitored by on-board measurements during
this event, with major gas mixing ratios and aerosol concen-
3 Results trations close to the average values of the cruise (Fig. S1),
i.e. below the limit of detection for NOx , 1.2 ppb for SO2 ,
3.1 Atmospheric conditions during wet deposition 51 ppb for O3 , 80 ppb for CO and 3000 part. cm−3 . On this
events basis, this wet event was representative of a Mediterranean
background marine rain event.
The general meteorological conditions during the cruise in-
dicated that the ION and FAST stations were highly affected
by cloudy weather conditions. During these periods, two sig- 3.1.2 Rain FAST
nificant rain events occurred over the R/V position and were
sampled. The first sample (Rain ION) was collected during As detailed in Guieu et al. (2020a), the FAST position was
the 4 d ION station occupation in the Ionian Sea in the early decided on the basis of regional model forecast runs and
morning of 29 May 2017 at 03:08 UTC. The second rain satellite observations, for the purpose of catching a wet dust
event (Rain FAST) occurred during the 5 d “Fast action” sta- deposition event. Significant dust emissions were observed
tion occupation (“FAST”) in the Algerian Basin during the from NASCube (http://nascube.univ-lille1.fr/, last acess: 11
night of 5 June 2017 at 00:36 UTC (Table 1). The two rain February 2022, Gonzales and Briottet, 2017) over North
sample collections coincided with peaks in relative humidity Africa from the night of 30–31 May 2017, then new dust
and wind speed and minima in air temperature (not shown). emissions in the night from 3 to 4 June 2017 in Alge-
Atmos. Chem. Phys., 22, 2309–2332, 2022 https://doi.org/10.5194/acp-22-2309-2022K. Desboeufs et al.: Wet deposition in the remote western and central Mediterranean 2315
Table 1. Information regarding the two rains datasets collected during the PEACETIME cruise.
Sample Sampling time Station name (dates) and rain Estimated total precipitation
location
Rain ION 29 May 2017, ION (25–29 May) 3.5 ± 1.2 mm
03:08–04:00 (UTC) or 35.36◦ N, 19.92◦ E
05:08–06:00 (LT)
Rain FAST 5 June 2017, FAST (2–7 June) 6.0 ± 1.5 mm
00:36–01:04 (UTC) or 37.94◦ N, 2.91◦ E
02:36–03:04 (LT)
Figure 2. Total precipitation (mm) between 28 May at 20:00 UTC and 29 May 2017 at 10:00 UTC (Rain ION, a) and between the 4 June
at 20:00 and 5 June 2017 at 09:00 UTC (Rain FAST, b) from ERA5 ECMWF reanalysis. The red circle indicates the R/V position. Note the
different scales for total precipitation.
ria and southern Morocco associated with a northward at- 0.24 ± 0.009 g m−2 , where standard deviations indicate the
mospheric flux. On 30 May, the SEVIRI Aerosol Optical temporal variability (1σ ).
Depth (AOD) satellite product (https://www.icare.univ-lille. Rain was observed by weather radar images in the area
fr/data-access/browse-images/geostationary-satellites/ last of the R/V from 3 June at 07:00 UTC. The rain recorded
acess: 11 February 2022, Thieuleux et al., 2005) confirmed around FAST was associated with two periods of rain: from
the presence of atmospheric dust in a cloudy air mass over the 07:00 to 14:00 UTC on 3 June and from 16:00 UTC on
western part of the Mediterranean, and from 2 June the ex- 4 June to 06:00 UTC on 5 June. For this latter case, a rain
port of a dust plume from North Africa south of the Balearic front (100 000 km2 ), moving eastward from Spain and North
Islands with high AOD (> 0.8) on the Alboran Sea was ob- Africa, reached the FAST station during the night between
served (Fig. S2). A dust plume with AOD < 0.5 was trans- 4 and 5 June (Fig. 4). Wet deposition between 4 and 5 June
ported to the northeast up to Sardinia on 4 June. Clear sky in the FAST station area were confirmed by radar imagery,
with low AOD remained west of 4◦ E on 5 June. showing several other instances of rain around the R/V po-
On-board lidar measurements (Fig. 3a, b, c) showed that sition before and after the rain sampling (Fig. 4). Continu-
the aerosol plume was present over the R/V position from ous on-board lidar measurements confirmed the below-cloud
2 June 2017 at 21:00 UTC until the rain event and cor- deposition during the rain event of early 5 June (Fig. 3b).
responded to a dust aerosol layer highlighted by the high Rain FAST was a wet deposition event occurring at the end
depolarization. The dust plume was concentrated between of an episode of transport of Saharan dust, whereas precip-
3 and 4 km at the beginning of the station occupation itation on the 3 June occurred during the maximum of the
and expanded down to the marine boundary layer (about dust plume (Figs. 3b and S2). The surface concentrations
500 m a.m.s.l.) by the end of the day on 3 June 2017. The of gas and particles, measured on board, suggest no clear
mass-integrated concentrations of dust aerosols derived from dust or anthropogenic influence in the atmospheric bound-
the profiles of aerosol extinction ranged from a minimum ary layer during this period of wet deposition, in agreement
of 0.18 ± 0.005 g m−2 just before the rain to a maximum of with back trajectories of low-altitude air masses (Fig. S2),
https://doi.org/10.5194/acp-22-2309-2022 Atmos. Chem. Phys., 22, 2309–2332, 20222316 K. Desboeufs et al.: Wet deposition in the remote western and central Mediterranean Figure 3. On-board lidar-derived (a) apparent backscatter coefficient (ABC); (b) temporal evolution of the lidar-derived volume depolariza- tion ratio (VDR) (in LT), where the dust plume is highlighted for values higher than ∼ 1.7 (yellow to red colours) and rain is shown by values higher than 3 (indicated by the white arrow); and (c) vertical profiles of the aerosol extinction coefficient in cloud-free conditions integrated over three periods denoted by 1, 2, and 3 in (a) along the dust plume event (c, d, e). The grey shade represents the root-mean-square (rms) variability along the time of the measurement. The dust layer is highlighted on the profiles. The mean aerosol optical thickness is given in the boxed legend with its temporal variability (1σ ). The location of the marine boundary layer (MBL) is also shown. Atmos. Chem. Phys., 22, 2309–2332, 2022 https://doi.org/10.5194/acp-22-2309-2022
K. Desboeufs et al.: Wet deposition in the remote western and central Mediterranean                                            2317

presuming no local mixing between dust and anthropogenic            respectively) due to some high concentrations. However, the
particles into rain samples. The total precipitation estimated      concentrations stayed in the typical range of values reported
from radar rainfall yields an accumulated precipitation of          for the Med Sea (Béthoux et al., 1990; Yoon et al., 1999),
6.0 ± 1.5 mm (±25 km around the R/V position), in agree-            even if we cannot exclude a possible contamination for these
ment with ECMWF reanalysis ERA5 (Fig. 2) for the wet de-            outlier concentrations.
position on the night of 4–5 June (5.7 ± 1.4 mm in the grid
point spanning the R/V position, i.e. ±0.25◦ ).
                                                                    4     Discussion
3.2   Chemical composition of rains
                                                                    4.1     Composition of rain collected over the remote Med
Dissolved and total concentrations of nutrients and TMs in
                                                                            Sea
the rain samples are presented in Table 2. Among all mea-
sured dissolved concentrations, nitrate was the most abun-          4.1.1    Concentrations
dant nutrient, followed by ammonium (Table 2). The nitrite
concentration was below the limit of detection for the two          Regarding nutrients, nitrogen species concentrations in
rain samples. Regarding TMs in rain, Fe and Zn presented            rain samples were in good agreement with those reported
the highest concentrations both in the dissolved fraction and       in Mediterranean rain samples, ranging from 1130 to
in total deposition with the same order of magnitude (10 to         5100 µg L−1 for NO−   3 and between 207 and 1200 µg L
                                                                                                                               −1 for
                                                                         +
25 µg L−1 ). Co, Cd and Mo had the lowest concentrations            NH4 (Loÿe-Pilot et al., 1990; Avila et al., 1997; Al Momani
(< 0.1 µg L−1 in both events, associated to the greatest un-        et al., 1998; Herut et al., 1999; Violaki et al., 2010; Izquieta-
certainties due to LoD), whereas the other TM concentrations        Rojano et al., 2016; Nehir and Koçak, 2018). The FAST rain
ranged between 0.1 and 10 µg L−1 (Table 2). Concentrations          concentrations were within the published range, whereas the
of nutrients and the majority of TMs were higher in the dust-       ION rain was in the low range, confirming a background
rich rain, except dissolved Pb (similar concentrations in both      signature at this station. The rainwater samples presented a
rain samples) and Cr (3 times higher concentration in Rain          large dominance of N in comparison to P, as observed from
ION relative to Rain FAST).                                         the N/P ratio derived from DIN/DIP (Table 2), ranging from
                                                                    208 at ION to 480 at FAST. Previous observations showed
3.3   Marine concentrations
                                                                    a predominance of N relative to P in the atmospheric bulk
                                                                    deposition over the Mediterranean coast, with an average ra-
All the TMs had significantly higher concentrations in the          tio of about 100, the highest reaching 170 for DIN/DIP and
ML compared to water below the ML and deeper (e.g. for Fe,          1200 for DIN/TDP (Markaki et al., 2010; Desboeufs et al.,
see Bressac et al., 2021), in agreement with a stratified profile   2018). The highest ratio could be linked to a washout effect
associated with atmospheric inputs. The pTM and dTM con-            of gaseous N species (NOx and NH3 ) by rain (Ochoa-Hueso
centrations within the ML (0–20 m) are displayed in Fig. 5.         et al., 2011). At the two stations, observed NOx concentra-
Concentrations were of the same order of magnitude at ION           tions were below the limit of detection in the boundary layer
and FAST. The TMs were mainly in dissolved forms in the             before wet deposition. The presence of nitrate and ammo-
ML (Kd from 0.006 to 0.5), except for Fe (Kd around 2) and          nium in the background aerosols has been observed during
one outlier value for Zn (1.3) (Fig. 5).                            recent campaigns in the remote Mediterranean atmosphere
   At both stations, the highest TM concentrations in the sur-      (e.g. Mallet et al., 2019). To our knowledge, no data are
face seawater were found for dMo (∼ 120 nM), these values           available on both P and N concentrations in Mediterranean
are the first measurements published for the Med Sea and            aerosols. The lowest concentrations of P relative to N in
are in agreement with the high abundance of dMo in open-            aerosol particles in the Mediterranean were observed during
sea water in other oceanic regions (∼ 107 nM, Smedley and           the cruise (DIN/TDP ranged from 13 to 790, Fu, 2018). The
Kinniburgh, 2017). Fe is the most abundant in the particulate       TDP concentrations were consistent with the average value
fraction in the ML (∼ 4 nM). All the pTM and dTM con-               of 8.4 µg L−1 measured in African dust rain samples col-
centrations measured during the cruise were within the range        lected in Spain over the 1996–2008 period (Izquierdo et al.,
previously published for the Med Sea (Sherrell and Boyle,           2012). Inorganic phosphorus predominated in the dust-rich
1988; Saager et al., 1993; Morley et al., 1997; Yoon et al.,        rain, whereas organic P was dominant in the background rain
1999; Wuttig et al., 2013; Baconnais et al., 2019; Migon            as the contribution of DOP to the TDP was 60 % and 44 %
et al., 2020, GEOTRACES-IDP, 2021). However, dCo con-               in Rain ION and Rain FAST, respectively. The DOP/TDP ra-
centrations (from 10 to 20 pM) were among the lowest ones           tio presents a very large range in Mediterranean rains, span-
measured during stratification period in the western Med Sea        ning from 6 % in Spanish dusty rain samples (Izquierdo et
(∼ 120 pM, Dulaquais et al., 2017). Zn presented the largest        al., 2012) to 75 %–92 % in rains from Crete (Violaki et al.,
range of concentrations within the ML in both the dissolved         2018). A reason for this wide range could be that Mediter-
and particulate fractions (0.6 to 19 nM and 61 to 3300 pM           ranean European aerosols, as opposed to Saharan dust parti-

https://doi.org/10.5194/acp-22-2309-2022                                            Atmos. Chem. Phys., 22, 2309–2332, 2022
K. Desboeufs et al.: Wet deposition in the remote western and central Mediterranean
https://doi.org/10.5194/acp-22-2309-2022
Table 2. Dissolved and total concentrations of nutrients and TMs in the two rain samples collected during the PEACETIME cruise (SD indicates the standard deviation from three
replicates).
Rain ION Rain FAST
Dissolved Total Dissolved Total
concentrations ±SD concentrations ±SD concentrations ±SD concentrations ±SD
Nutrients NO3− µg L−1 (µmol L−1 ) 1185 (19.1) 71 (1.1) 3694 (59.6 222 (3.6
NH4+ µg L−1 (µmol L−1 ) 366 (20.3) 11 (0.6) 654 (36.3 19 (1.1
DIN µg L−1 (µmol L−1 ) 552 (39.4) 82 (1.7) 1343 (96) 241 (17
PO43− µg L−1 (nmol L−1 ) 18.1 (189) 0.5 (6) 19.0 (200) 0.6 (6)
DIP µg L−1 (nmol L−1 ) 5.87 (189) 0.18 (6) 6.20 (200) 0.19 (6)
DOP µg L−1 (nmol L−1 ) 8.6 (278) 1.9 (75) 4.9 (158) 1.6 (57)
TP µg L−1 (nmol L−1 ) 14.5 (468) 2.5 (81) 16.6 (536) 1.0 (33) 11.1 (358) 1.9 (63) 58.7 (1894) 3.5 (111)
DIN/DIP (208) (480)
DOC (µmol L−1 ) (105.7) (2.2) (95.5) (1.2)
Metals Al µg L−1 (nmol L−1 ) 13.0 (480) 0.8 (30) 14.6 (540) 0.9 (32) 23.4 (867) 0.7 (24) 440 (16 308) 7 (244)
Cu µg L−1 (nmol L−1 ) 0.71 (11.1) 0.02 (0.3) 0.73 (11.5) 0.02 (0.3) 1.15 (18.0) 0.04 (0.6) 1.63 (25.7) 0.06 (0.9)
Fe µg L−1 (nmol L−1 ) 15.1 (270) 0.4 (6) 17.9 (321) 0.6 (11) 19.2 (344) 0.1 (2) 231 (4140) 7 (132)
Mn µg L−1 (nmol L−1 ) 0.55 (10.0) 0.02 (0.3) 0.60 (10.9) 0.02 (0.4) 3.17 (57.8) 0.07 (1.2) 5.26 (95.7) 0.12 (2.1)
Ni µg L−1 (nmol L−1 ) 0.52 (8.8) 0.02 (0.3) 0.67 (11.4) 0.02 (0.4) 0.59 (10.1) 0.02 (0.4) 0.84 (14.3) 0.03 (0.6)
µg L−1 (nmol L−1 )
Atmos. Chem. Phys., 22, 2309–2332, 2022
Ti 0.48 (10.0) 0.04 (0.8) 0.65 (13.6) 0.48 (3.2) 0.22 (4.7) 0.01 (0.1) 33.36 (697) 0.51 (11)
V µg L−1 (nmol L−1 ) 0.37 (7.4) 0.01 (0.2) 0.38 (7.42) 0.01 (0.25) 1.37 (26.9) 0.03 (0.5) 2.02 (39.7) 0.04 (0.9)
Zn µg L−1 (nmol L−1 ) 24.8 (379) 0.8 (12) 25.3 (387) 0.8 (12) 22.7 (347) 0.6 (8) 26.3 (402) 0.7 (11)
Cd ng L−1 (pmol L−1 ) 12.9 (115) 6.4 (57) 13.1 (117) 6.3 (56) 20.2 (180) 10.3 (92) 23.7 (210) 6.8 (60)
Co ng L−1 (pmol L−1 ) 44 (749) 13 (229) 47.4 (804) 14.5 (246) 82 (1386) 20 (347) 157 (2661) 28 (474)
Cr ng L−1 (pmol L−1 ) 241 (4636) 16 (300) 628 (12 079) 5 (95) 79 (1522) 14 (260) 443 (8514) 43 (819)
Mo ng L−1 (pmol L−1 ) 28 (288) 10 (106) 4.1 (43) 1.4 (14) 82 (855) 11 (113) 92.1 (960) 16.2 (169)
Pb ng L−1 (pmol L−1 ) 170 (822) 11 (54) 175.1 (845) 1.4 (7) 166 (801) 9 (41) 604 (2917) 19 (91)
2318K. Desboeufs et al.: Wet deposition in the remote western and central Mediterranean 2319 Figure 4. Rain rates (mm h−1 ) during the night between the 4 and 5 June when Rain FAST was collected on board. Issued from European rain radar composites (OPERA programme) of 5 June between 00:00 and 02:45 UTC. cles, are dominated by organic phosphorus compounds asso- on atmospheric inputs from European coasts to open sea ciated with bacteria (Longo et al., 2014). is well documented (OSPAR, 2008; Travnikov et al., 2012; The dissolved and total TM concentrations in the PEACE- Geotraces IDP21). Since the phasing out of leaded automo- TIME rains were lower than those reported in coastal areas bile gasoline, the decrease in atmospheric Pb concentrations (for the eastern basin, see Özsoy and Örnektekin, 2009; Al- is also observed in the Mediterranean atmosphere (Migon et Momani et al., 1998; Kanellopoulou et al., 2001, and for al., 2008). The low TM concentrations of ION and FAST the western basin, see Guieu et al., 1997; Guerzoni et al., rain samples, in particular Cd and Pb, suggest a pronounced 1999; Chester et al., 1997; Losno, 1989; Frau et al., 1996), decrease in TM inputs in the open Mediterranean due to especially for the background Rain ION (Fig. 6). Most of environmental mitigation on TM emissions. Moreover, the the referenced works on coastal rainwater date from the late coastal deposition is generally not representative of open- 1990s. There is a continuous decline of TM emissions since sea inputs, e.g. due to proximity of anthropogenic sources the 1990s due to regulatory efforts (Pacyna et al., 2007). The in coastal areas. Thus, the 1990s data should not be used as a subsequent decrease in the anthropogenic Cd and Pb imprint current reference for open Mediterranean rain composition. https://doi.org/10.5194/acp-22-2309-2022 Atmos. Chem. Phys., 22, 2309–2332, 2022
2320                                      K. Desboeufs et al.: Wet deposition in the remote western and central Mediterranean

Figure 5. Box plots of dissolved (a, b) and particulate (c, d) marine concentrations (pM) and Kd values (e, f) for the different TMs within
the ML at ION (b, d, f) and FAST (a, c, e). In the box plots, the box indicates the interquartile range, i.e. the 25th and the 75th percentile,
and the line within the box marks the median. The whiskers indicate the quartiles ±1.5 times the interquartile range. Points above and below
the whiskers indicate outliers outside the 10th and 90th percentile.

4.1.2   Enrichment factor                                                 studies on atmospheric deposition monitoring in the western
                                                                          Mediterranean (e.g. Guieu et al., 2010; Sandroni and Migon,
EF and solubility values of TMs and P observed during the                 2002; Desboeufs et al., 2018). For example, Desboeufs et
two rain events contrasted greatly (Fig. 7). In Rain ION, al-             al. (2018) showed that there is a large contribution of an-
most all elements were significantly enriched relative to the             thropogenic combustion sources to the P, Cr, V and Zn back-
upper continental crust (EF > 10, and up to ∼ 103 for Cd and              ground deposition fluxes. Aerosol composition monitoring
Zn), whereas in Rain FAST, only Zn (73), Cd (48), and Mo                  over the Mediterranean coastal area showed the role of land-
(15) were enriched. Only Ti, Fe, and Mn did not present                   based sources and ship traffic sources in TM contents (Bove
a significant enrichment (EF < 10) in Rain ION, in agree-                 et al., 2016; Becagli et al., 2017). As all the deposition mea-
ment with previous studies in the Mediterranean environ-                  surement sites were located in coastal areas, it was difficult
ment showing that these metals are mainly associated with                 to exclude the influence of these local sources for explain-
mineral dust in atmospheric deposition (e.g. Guieu et al.,                ing the observed anthropogenic contribution. Here, EF values
2010; Desboeufs et al., 2018). However, for Fe and Mn an                  showed a clear anthropogenic signature for P and all TMs ex-
influence of non-crustal sources in Rain ION could be sus-                cept Ti, Fe, Mn and Mo in the offshore Rain ION sample. In
pected through a clear increase in the EF values compared                 particular, the EF of Zn in Rain ION was on average 5 times
to FAST. Mo is the most abundant TM in seawater (Smed-                    higher than the EF found in the rain samples previously stud-
ley and Kinniburgh, 2017), particularly in the Med Sea (see               ied from coastal sites in the Mediterranean region (Özsoy and
Sect. 3.3). Thus, in contrast to other TMs, the non-crustal               Örnektekin, 2009; Al-Momani et al., 1998; Losno, 1989).
part of Mo could be associated with sea salt aerosols rather              Nevertheless, extremely high enrichments of Zn in rainwa-
than anthropogenic signal. The EF ratio relative to seawater              ter have been reported from island sites in the Med Sea; for
((Mo/Na)seawater = 8.9 × 10⁻⁷ in mass ratio, Millero, 2013)               example, Frau et al. (1996) reported geometric mean EF of
was 7.4 for Rain ION and 4.6 for Rain FAST, confirming the                ∼ 6500 in both dust-rich and dust-poor rains from two sites
marine origin of this element in both rain samples. The an-               in southern Sardinia, and Fu et al. (2017) reported EF > 1000
thropogenic origin of TMs and P has been reported by several              for Zn in atmospheric insoluble bulk (wet+dry) deposition

Atmos. Chem. Phys., 22, 2309–2332, 2022                                                      https://doi.org/10.5194/acp-22-2309-2022
K. Desboeufs et al.: Wet deposition in the remote western and central Mediterranean 2321 Figure 6. Comparison of dissolved (D) and total (T) TM concentrations to previous studies in the eastern and western Med Sea. on Lampedusa Island. As previously discussed (Sect. 3.1.1.), 4.1.3 Solubility Rain ION was representative of a Mediterranean background marine rain event. The Zn EF at ION was the same order of The solubility values were also higher in Rain ION than in magnitude as at these island sites, which suggests a high an- the dusty Rain FAST, except for Mo, for which the differ- thropogenic background signal of Zn even in the open Med ence between both rain samples was not significant (Fig. 7). Sea. More generally, the high EFs in Rain ION mean that For Rain ION, TMs and P presented solubility higher than the chemical composition of background aerosol particles is 78 %, except for Cr which had a solubility of 38 %. In Rain likely continuously impacted by anthropogenic sources even FAST, solubility values < 10 % were observed for Al and Fe, over the remote Med Sea. more than 10 times lower than in Rain ION. For the other The EF values of TMs for Rain FAST were significantly TMs, the highest difference in solubility was observed for lower than for Rain ION (Fig. 7) but were similar to Saharan Pb, whose solubility decreased from 97 % in Rain ION to rains (Guerzoni et al., 1999; Özsoy and Örnektekin, 2009), 27 % in Rain FAST. In a review on TM solubility in Mediter- confirming the dust signature for this rain. The comparison ranean rainwater collected in coastal areas, Desboeufs (2022) between dust-rich and background rains generally reveals a emphasize the large range of solubility for all the TMs: Fe net difference of concentrations (at least higher by a factor (0.8 %–41 %), Cr (6 %–80 %), Pb (5 %–90 %), Ni (22 %– of 3 in dust-rich rains), particularly for Al, Fe, Mn and Cr 93 %), Mn (16 %–95 %), Cu (22 %–96 %), Zn (14 %–99 %), (Guerzoni et al., 1999; Özsoy and Örnektekin, 2009). Here, V (35 %–99 %) and Cd (72 %–99 %). The solubility ranges an increase in concentrations between Rain ION and Rain found in this study were generally consistent with those re- FAST was observed for the majority of TMs: Al (×28), Ti viewed by Desboeufs (2022). Moreover, the Mn solubility (×50), Mo (×23), Fe (×13), Mn (×9), V (×5), Pb (×3.5), values in FAST (60 %) and ION (92 %) rains are close to Co(×3), and Cu (×2) and also for P(×4) (Table 2). The com- those reported by Dulac (1986) from a dust-rich (57 %) and bination of higher concentrations and EF values < 10 found anthropogenic (83 %) rain collected at sea in the Ligurian in Rain FAST show that the dust contribution was important Sea and west of Sardinia in April 1981. Only Fe solubility on deposition fluxes of many TMs and P during this event. (84 %) found in Rain ION was higher than the average val- However, the high Al concentrations in Rain FAST drives EF ues previously reported. In the Rain FAST, Fe solubility was values down mathematically, masking other potential source 8 %, this is 10 times lower than the average Fe solubility in signatures. 10 dust-rich rains collected on the southeastern coast of Sar- https://doi.org/10.5194/acp-22-2309-2022 Atmos. Chem. Phys., 22, 2309–2332, 2022
2322                                    K. Desboeufs et al.: Wet deposition in the remote western and central Mediterranean

Figure 7. Enrichment factor (EF, a) and solubility (%, b) of phosphorus (P) and TMs ordered by increasing EF in the two rainwater samples.

dinia by Guerzoni et al. (1999) but consistent with Saharan            ing in rainwater, the role of pH and of the particulate mineral
dust deposition collected in the Atlantic Ocean (Sedwick et            dust loading, reflecting the dust versus anthropogenic signa-
al., 2007; Baker et al., 2013). It is known that anthropogenic         ture, were identified as the main controls of TM solubility in
Fe is more soluble than Fe-bearing dust (Desboeufs et al.,             the Mediterranean rainwater (Özsoy and Örnektekin, 2009;
2005; Jickells et al., 2016). Regarding the evolution of TM            Theodosi et al., 2010). From our two rain samples, it is diffi-
emissions (see Sect. 4.1.1), we suspect that this difference           cult to propose a control explaining the difference in solubil-
could be due to a higher contribution of anthropogenic sig-            ity values. However, the pH values were very close in the two
nal for Fe in dust-rich rains in 1990s in Sardinia than in the         samples (Table 2), excluding a pH effect on solubility values.
recent rain samples.                                                   The much lower solubility of TMs in Rain FAST is consis-
   Few studies have compared TM solubility between dust-               tent with the EFs indicating a crustal origin of TMs in Rain
rich and anthropogenic rains in the Mediterranean. An in-              FAST (Fig. 7). As discussed before, background atmosphere
crease in solubility values from dust-rich to background rains         in the Med Sea seems to be continuously influenced by an-
was observed for Mn in offshore rains, as mentioned above              thropogenic particles. Even in dusty Rain FAST, it is highly
(Dulac, 1986), and for Al, Cr, Fe and Pb (with only a slight           probable that a part of metals presented an anthropogenic im-
increase for Cd) in Sardinia (Guerzoni et al., 1999). The de-          print is not visible on EF values but has solubility similar to
crease in solubility from background to dust-rich rains was            Rain ION. Thus, the decrease in solubility between the two
observed for P in Spain by Izquierdo et al. (2012), with val-          rain samples could either be due to the lower solubility of
ues of solubility decreasing from 25 % to 7 %. Here, our re-           TMs in mineral dust (as suggested by aerosol leaching exper-
sults for the two rain samples confirm the lowest solubility           iments) or the presence of mineral dust, which by increasing
of TMs in dust-rich rains (except for Mo). Aerosol-leaching            the TM total concentrations overwhelms the anthropogenic
experiments showed that metal dissolution from aerosol par-            background signal, or both. The case of Mo is unique, since
ticles can be also influenced by a number of parameters, such          its solubility was comparable in Rain ION and Rain FAST.
as pH, presence of dissolved organic complexing ligands, in-           As discussed with EF values, Mo was associated with sea
cloud processing, and particle origin and load (Desboeufs et           salt aerosols in both rain samples, explaining the similarity
al., 1999; Bonnet and Guieu, 2004; Desboeufs et al., 2005;             of solubility.
Paris and Desboeufs, 2013; Heimburger et al., 2013; Jick-
ells et al., 2016). However, it is known that metals that are
mainly associated with crustal aluminosilicate mineral lat-
tices such as Fe and Ti have very low solubility values, due
to the difficulties with breaking bonds in the lattices (Journet
et al., 2008; Jickell et al., 2016). Regarding metal partition-

Atmos. Chem. Phys., 22, 2309–2332, 2022                                                   https://doi.org/10.5194/acp-22-2309-2022
You can also read