Welcome! PNC Bank Presents: Dental Economic Trends & Perspectives - Virtual Venues
←
→
Page content transcription
If your browser does not render page correctly, please read the page content below
Welcome!
PNC Bank Presents: Dental Economic Trends & Perspectives

                                                           0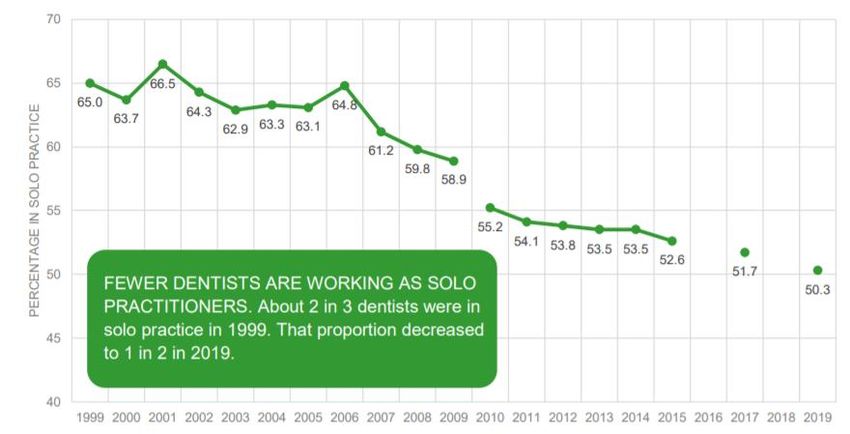
Mary Kay Schneider
Executive Vice President and Director, Industry Segmentation
PNC Bank Business Banking

                                                               1
Economic Outlook
Much Brighter Outlook With Vaccines, Big Stimulus Bill

Augustine Faucher
Chief Economist
The PNC Financial Services Group

Dental Economic Trends & Perspectives
October 28, 2021
                                                         2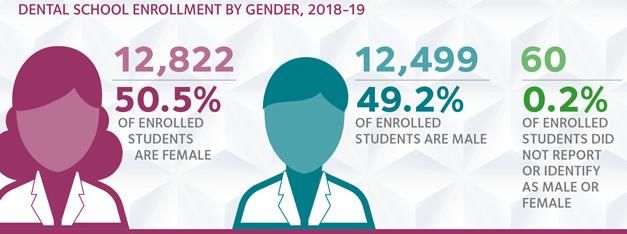
It’s Official—The U.S. Economy Is In Recovery

Length of expansion, months, by starting date of recovery

  140

  120

  100

     80

     60                                                                           120        128
                                                     106
                                                                             92
     40               80                                                                73
               50                                               58
     20                     37   45    39                  36
                                              24                                                    18
                                                                       12
        0
               3/33   6/38 10/45 10/49 5/54   4/58   2/61 11/70 3/75   7/80 11/82 3/91 11/01 6/09   4/20

Source: NBER

                                                                                                           3
Short-Term Rates Still Near Zero; Long-Term Rates
Are Up in 2021, But Still Very Low
Interest rate, %

     3.5
                                                              10-year Treasury bond
     3.0

     2.5

     2.0

     1.5

     1.0
                                                  3-month Treasury bill
     0.5

     0.0
               '16 A            J   O '17 A   J   O '18 A     J   O '19 A   J   O '20 A   J   O '21 A   J

Source: Federal Reserve Board

                                                                                                            4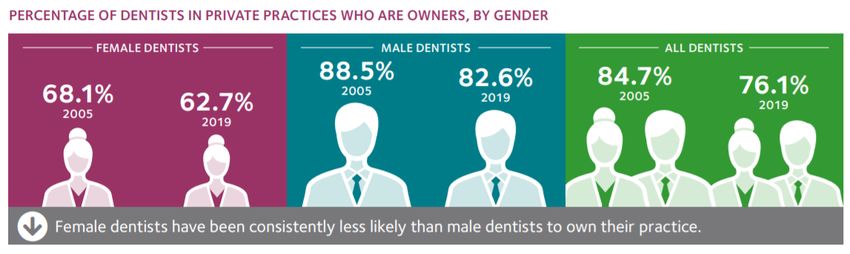
Economic Activity Now Above Pre-Pandemic Peak…

Real, % change year ago

     16

     12
                                                                      Final sales of domestic product
        8
                                Gross domestic income
        4

        0

      -4

      -8
                                                                                 Gross domestic product
    -12
              '06   '07   '08    '09   '10   '11   '12   '13   '14   '15   '16    '17   '18   '19   '20   '21

Source: BEA

                                                                                                                5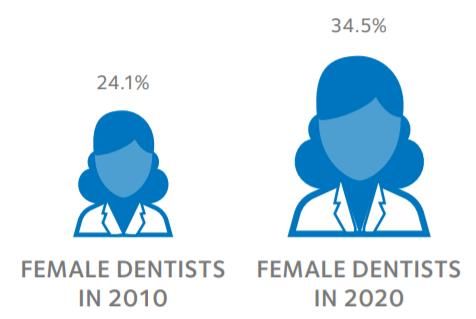
…But Consumer Spending on Services Continues to
Lag
Real, % change

              Consumer services

              Consumer durables         2019Q4 to 2020Q2

       Consumer nondurables             2019Q4 to 2021Q2

 Business fixed investment

        Residential investment

   Government cons./invest.

                        Exports

                        Imports

  After-tax personal income

                                  -30      -20        -10   0   10   20   30

Source: BEA

                                                                               6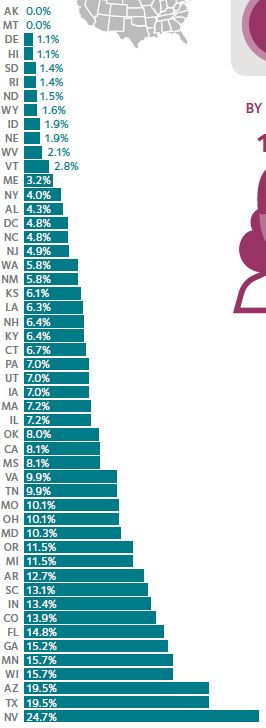
Dental Employment Has Recovered, But Not
Spending
Index, pre-recession peak=100

    110
                                            Employment, dentists’ offices
    100
       90
       80
       70
       60
       50                                        Real personal consumption
       40                                        expenditures, dental services

       30
                    '19   A   J   O   '20   A       J       O       '21     A    J

Sources: BEA, BLS

                                                                                     7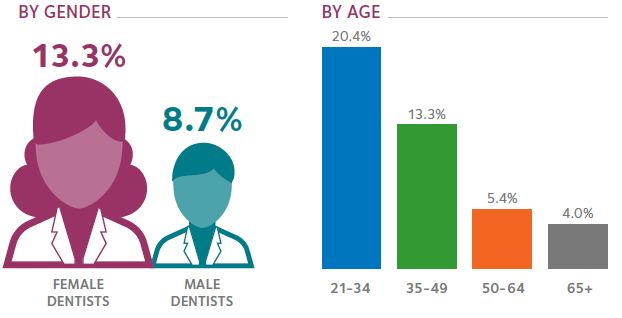
Very High Savings Rate and Great Balance Sheets
Will Power Consumer Spending This Year and Next

              28                                                                                   19

              24                                                                                   18

                                                  Financial obligations ratio,
              20                                                                                   17
                                                  % of after-tax income (R)

              16                                                                                   16

                                      Great
              12                                                                                   15
                                      Recession

                8                                                                                  14

                4                                                Personal saving rate,             13
                                                                 % of after-tax income (L)
                0                                                                                  12
                    '05                      '10                        '15                  '20

Sources: BEA; Federal Reserve Board

                                                                                                        8
Stimulus of About One-Quarter of GDP
CARES, Paycheck Protection Program and Health Care Enhancement, Consolidated
Appropriations Plan, and American Rescue Plan Acts, spending, $ bil
Small business loans/grants
Stimulus payments
Aid to states
Other
Unemployment insurance
Big business, govt. loans/guarantees
Health
Business tax cuts
0 200 400 600 800 1,000 1,200
Sources: CBO, Moody’s Analytics, PNC
9With More Stimulus, Vaccine Rollout, 2021 and 2022
Look a Lot Better…
Real GDP, % change year ago
15
12 September 2021 forecast
9
6
3
January 2021 forecast
0
-3
-6
-9
-12
'18 '19 '20 '21F '22F '23F
Sources: BEA; PNC
10…With a Faster Labor Market Recovery
Unemployment rate, %
14
12
10
8
January 2021 forecast
6
4
September 2021 forecast
2
'18 '19 '20 '21F '22F '23F
Sources: BLS; PNC
11Open Questions
▪ Pandemic
▪ Biden administration proposals
▪ Longer-run growth
▪ Housing market
12For more information from PNC Economics visit
Pnc.com/economicreports
Twitter:
@GusFaucherPNC
13Disclaimer: The material presented is of a general nature and does not constitute the provision of investment or economic advice to
any person, or a recommendation to buy or sell any security or adopt any investment strategy. Opinions and forecasts expressed
herein are subject to change without notice. Relevant information was obtained from sources deemed reliable. Such information is
not guaranteed as to its accuracy. You should seek the advice of an investment professional to tailor a financial plan to your
particular needs.
©2021 The PNC Financial Services Group, Inc. All rights reserved.
14The Impact of COVID-19 on the
Dental Care Sector
Dr.Dave PreblePatient Volume Recovery
Patient Volume
(% of pre-COVID-19 level, on average)
*
89%
88%
88%
86%
86%
84%
Patient volume reached its
81%
81%
81%
81%
80%
80%
78%
78%
77%
76%
76%
100%
73%
73%
71%
70%
highest level during the week
65%
80% of August 16th, at 89% of pre-
53%
89%
79%
79%
COVID-19 levels.
38%
60%
72%
71%
70%
69%
68%
66%
64%
62%
May 4 19% 18%
57%
57%
40% *Note that HPI changed its response
46%
7%
7%
options, allowing dentists to report
20% greater patient volumes compared to
0% pre-pandemic levels. This did not
have a big impact on results.
Apr 6
Oct 5
Jun 15
Jun 29
Jul 13
Jul 27
Jan 18
Jun 14
Jul 12
May 18
Sep 7
May 17
Oct 19
Apr 20
Apr 12
Nov 2
Dec 14
Nov 16
Nov 30
Aug 10
Aug 24
Sep 21
Feb 15
Aug 16
Jun 1
Mar 15 Private Practice Public Health
© 2021 American Dental Association. All Rights Reserved. 16Staffing Shortages are Major Issue
Staffing shortages are the most common limiting factor for practices that want to see more patients,
followed by safety protocols and low patient demand.
© 2021 American Dental Association. All Rights Reserved. 17New Report Looking at Practice Impact
www.ada.org/hpi
© 2021 American Dental Association. All Rights Reserved. 18Change in Dentist Net Income 2019-20
In 2020 net income
declined by 17.9%
across all dentists
(GPs). For women
dentists the decline was
much greater, as for
older dentists as well.
© 2021 American Dental Association. All Rights Reserved. 19Looking Ahead
“Skate to where the
puck is going…not
where it is.”
© 2021 American Dental Association. All Rights Reserved. 20Looking Ahead – 4 Big Trends
1. Intensified Consumerism
2. Shifting Demographics
3. Enabling Technology
4. Payment Reform
© 2021 American Dental Association. All Rights Reserved. 21Looking Ahead – 4 Big Trends
2. Shifting Demographics
© 2021 American Dental Association. All Rights Reserved. 22Higher Share of Dentists are Female
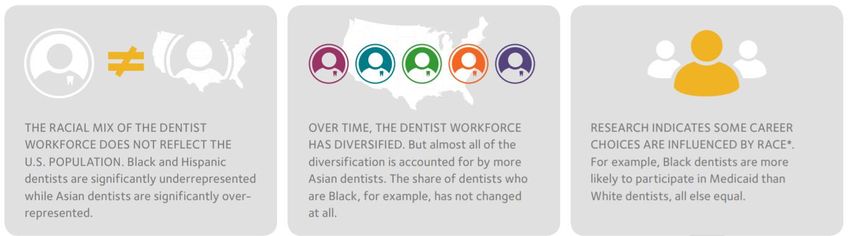
© 2021 American Dental Association. All Rights Reserved. 23More Non-White Dentists
© 2021 American Dental Association. All Rights Reserved. 24Fewer Dentists are Practice Owners
© 2021 American Dental Association. All Rights Reserved. 25Fewer Dentists in Solo Practice
© 2021 American Dental Association. All Rights Reserved. 26Fewer Dentists in Solo Practice
There is lots of variation
across states in practice
structure. ID, OK, UT,
for example, have
highest share of dentists
in solo practice.
© 2021 American Dental Association. All Rights Reserved. 27Practice Consolidation Accelerates
© 2021 American Dental Association. All Rights Reserved. 28Practice Consolidation Accelerates…Even More
© 2021 American Dental Association. All Rights Reserved. 29Kevin Wills
Sr. Vice President, Territory Practice Manager
PNC Bank Healthcare Business Banking
30Questions & Answers
31Thank you for attending today’s webcast.
32You can also read