W. P. Carey Inc. Investor Presentation - 1Q22 Investing for the Long Run - Seeking Alpha

Page created by Jim Reid
 
CONTINUE READING
W. P. Carey Inc. Investor Presentation - 1Q22 Investing for the Long Run - Seeking Alpha
W. P. Carey Inc.
Investor Presentation
1Q22

Investing for the Long Run®
W. P. Carey Inc. Investor Presentation - 1Q22 Investing for the Long Run - Seeking Alpha
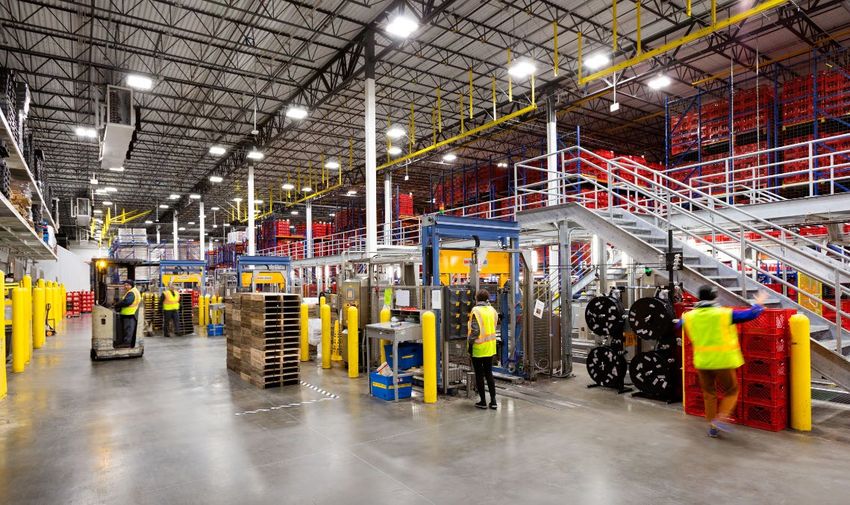
Table of Contents

Overview                                                     3

Real Estate Portfolio                                        8

Balance Sheet                                                19

ESG                                                          24

Unless otherwise noted, all data in this presentation is as of March 31, 2022.
Amounts may not sum to totals due to rounding.

Investing for the Long Run®
W. P. Carey Inc. Investor Presentation - 1Q22 Investing for the Long Run - Seeking Alpha
Overview

           3
W. P. Carey Inc. Investor Presentation - 1Q22 Investing for the Long Run - Seeking Alpha
Company Highlights
W. P. Carey (NYSE: WPC) is a REIT that specializes in investing in single-tenant net lease
commercial real estate, primarily in the U.S. and Northern and Western Europe

  One of the largest owners of net lease assets
  and among the top 25 REITs in the MSCI US REIT Index

  Highly diversified portfolio by geography, tenant, property type and
  tenant industry

  Successful track record of investing and operating through multiple    Orgill | Warehouse | Inwood, WV
  economic cycles since 1973 led by an experienced management team

  U.S. and Europe-based asset management teams

  Investment grade balance sheet with access to multiple
  forms of capital

  Stable cash flows derived from long-term leases that contain strong
  contractual rent bumps
                                                                         Turkey Hill | Industrial | Conestoga, PA

                                                                                                                    4
W. P. Carey Inc. Investor Presentation - 1Q22 Investing for the Long Run - Seeking Alpha
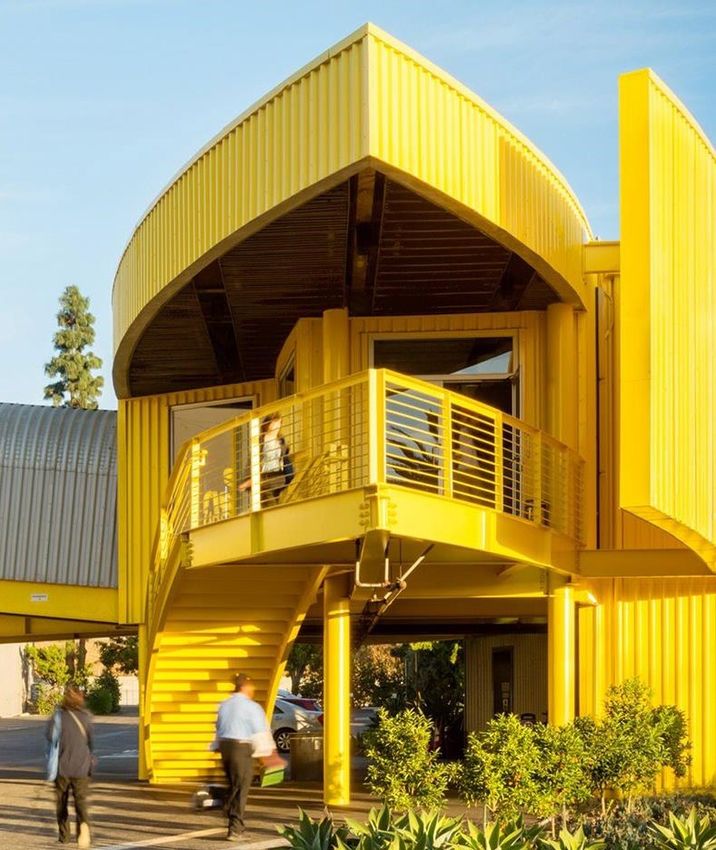
Business Model and Structure (1)
• On February 27, 2022, W. P. Carey announced a proposed merger with CPA®:18, expected to close in the third quarter,
  in an estimated $2.7 billion transaction, adding ~$2.0 billion of assets after ~$700 million of proposed asset sales (2)

                                            W. P. Carey
                                 ~$22 billion of Enterprise Value (3)

                                            Real Estate Portfolio (4)                                                                                Advisor to $2.6 billion of AUM

  1,336 net lease properties / 157 million sq. ft. / 10.8 year WALT / $1.3 billion
  of ABR                                                                                                                                        Corporate Property Associates 18 –
                                                                                                                                             Global (CPA:18) – Diversified / Net lease (2)
     • Primarily industrial, warehouse, office, retail and self-storage (net lease)
     • 356 tenants                                                                                                                                               $2.5 billion of AUM

     • Top 10 tenants represent 20.2% of ABR
     • Properties located primarily in U.S. and Europe
     • 98.5% occupancy                                                                                                                         Carey European Student Housing Fund
     • 99% of leases have contractual rent increases, including approximately                                                                   (CESH) – Net Lease Student Housing
       60% linked to CPI
                                                                                                                                                                $183 million of AUM

1. Data as of or for the quarter ended March 31, 2022 unless otherwise noted.
2. On February 27, 2022, our board of directors unanimously approved a definitive merger agreement pursuant to which CPA:18 – Global will merge with and into an indirect subsidiary of ours in a transaction
   valued at approximately $2.7 billion. The transaction has also been approved by CPA:18 –Global’s board of directors upon the unanimous recommendation and approval of a Special Committee consisting of
   CPA:18 – Global’s independent directors. On April 25, 2022, we filed a Form S-4/A, which was declared effective by the SEC on April 27, 2022. CPA:18 intends to mail the proxy statement/prospectus contained
   therein to CPA:18’s stockholders in connection with the Proposed Merger in early May 2022. The Proposed Merger and related transactions are subject to the satisfaction of a number of closing conditions,
   including approval by the stockholders of CPA:18 –Global. If this approval is obtained and the other closing conditions are met, we currently expect the transaction to close in early August 2022, although there
   can be no assurance that the transaction will be completed at such time or at all.
3. Enterprise value represents equity market capitalization based on a stock price of $80.84 as of March 31, 2022, plus pro rata debt outstanding, less consolidated cash and cash equivalents.
4. Portfolio information reflects pro rata ownership of real estate assets, excluding operating properties. “WALT” represents weighted average lease term and “ABR” represents pro rata contractual minimum
   annualized base rent (see definitions in Disclosures).                                                                                                                                                               5
W. P. Carey Inc. Investor Presentation - 1Q22 Investing for the Long Run - Seeking Alpha
Investment Strategy
• Generate attractive risk-adjusted returns by       Transactions Evaluated on Four Key Factors
  investing in net lease commercial real estate,
  primarily in the U.S. and Northern & Western                                • Industry drivers and trends
  Europe
                                                      Creditworthiness        • Competitor analysis
• Protect downside by combining credit and real       of Tenant               • Company history
  estate underwriting with sophisticated                                      • Financial wherewithal
  structuring and direct origination
• Acquire “mission-critical” assets essential to a                            • Key distribution facility or
  tenant’s operations                                                           profitable manufacturing plant
• Create upside through rent escalations, credit      Criticality of Asset    • Critical R&D or data-center
  improvements and real estate appreciation                                   • Top performing retail stores
• Capitalize on existing tenant relationships                                 • Corporate headquarters
  through accretive expansions, renovations and
  follow-on deals                                                             • Local market analysis
                                                                              • Property condition
• Hallmarks of our approach:                          Fundamental Value
                                                                              • 3rd party valuation /
   • Diversification by tenant, industry, property    of the Underlying         replacement cost
     type and geography                               Real Estate             • Downside analysis / cost
   • Disciplined                                                                to re-lease

   • Opportunistic
                                                                              • Lease terms – rent growth and
   • Proactive asset management                                                 maturity
                                                      Transaction Structure   • Financial covenants
   • Conservative capital structure                   and Pricing             • Security deposits / letters
                                                                                of credit

                                                                                                                 6
W. P. Carey Inc. Investor Presentation - 1Q22 Investing for the Long Run - Seeking Alpha
Proactive Asset Management
Domestic and international asset management capabilities to address lease expirations,
changing tenant credit profiles and asset repositioning or dispositions

• Asset management offices in New York and Amsterdam
• W. P. Carey has proven experience repositioning assets through re-leasing, restructuring and strategic disposition
• Generates value creation opportunities within our existing portfolio
• Five-point internal rating scale used to assess and monitor tenant credit and the quality, location and criticality of each asset

Asset Management Expertise                                      Asset Management Risk Analysis
 Transaction                 Operational                                                Risk Management Scale

 • Leasing                   • Lease compliance                 Tenant                                                    Implied      Investment
                                                                                 Bankruptcy    Watch List      Stable
                                                                                                                            IG
                                                                Credit                                                                    Grade

 • Dispositions              • Insurance

                                                                Asset                          Residual
 • Lease modifications       • Property inspections                               Obsolete                    Stable       Class B       Class A
                                                                Quality                          Risk

 • Credit and real estate    • Non-triple net lease
   risk analysis               administration
                                                                                        Limited Tenant                      Good          Prime
                                                                Asset              No
                                                                                          Demand /
                                                                                                            Alternative
                                                                                                                          Location /    Location /
 • Building expansions       • Real estate                                       Tenant                       Tenant
                                                                Location                 Challenging                       Active      High Tenant
                                                                                 Demand                      Demand
   and redevelopment           tax                                                         Location                        Market        Demand

 • Tenant distress and       • Projections and
   restructuring               portfolio valuation              Asset               Not        Non-         Possible
                                                                                                                          Critical-
                                                                                                                                          Highly
                                                                                                                          Renewal
                                                                Criticality        Critical   Renewal       Renewal
                                                                                                                           Likely
                                                                                                                                          Critical

                                                                                                                                                     7
W. P. Carey Inc. Investor Presentation - 1Q22 Investing for the Long Run - Seeking Alpha
Real Estate
Portfolio

              8
W. P. Carey Inc. Investor Presentation - 1Q22 Investing for the Long Run - Seeking Alpha
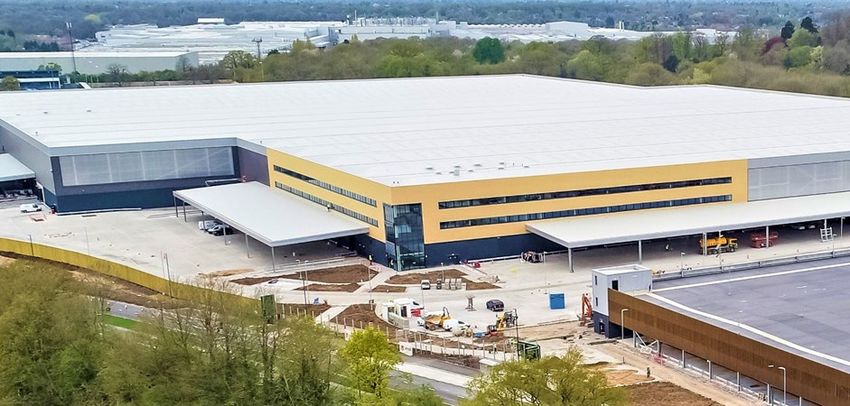
Large Diversified Portfolio (1)

                                                           Number of Properties                                                               1,336

                                                           Number of Tenants                                                                   356

                                                           Square Footage                                                               157 million

                                                           ABR                                                                          $1.3 billion

                                                           US / Europe / Other (% of ABR)                                           63% / 35% / 2%

                                                           Contractual Rent Escalation: CPI-linked / Fixed / Other                  58% / 37% / 4%

                                                           WALT                                                                         10.8 years

                                                           Occupancy                                                                        98.5%

                                                           Investment Grade Tenants (% of ABR)                                               31.4%

                                                           Top 10 Tenant Concentration (% of ABR)                                           20.2%

1. Portfolio information reflects pro rata ownership of real estate assets (excluding operating properties) as of March 31, 2022.

                                                                                                                                                       9
W. P. Carey Inc. Investor Presentation - 1Q22 Investing for the Long Run - Seeking Alpha
Property and Industry Diversification (1)
Property Type Diversification (% of ABR)                                                                              Tenant Industry Diversification (% of ABR)

                                     9%                                                     50%
                                                                                   Industrial / Warehouse                                              14%
                         5%                                                                                                                                                         22%
                                                               26%
                                                                                                                                          2%
                                                                                                                                         3%
                                                                                                                                        3%
                18%                                                                                                                    3%
                                                                                                                                       4%                                                      9%

                                                                                                                                         4%
                                                                                                                                             4%                                           6%
                                                              24%
                                                                                                                                                  4%                               6%
                            19%
                                                                                                                                                       5%
                                                                                                                                                                5%        6%

                                                                                                                                              Retail Stores (2)                            22%
                                                                                                                                              Consumer Services                             9%
                                                                                                                                              Automotive                                    6%
                           Industrial                             26%
                                                                                                                                              Beverage and Food                             6%
                           Warehouse                              24%                                                                         Grocery                                       6%
                           Office                                 19%                                                                         Cargo Transportation                          5%
                                    (2)                                                                                                       Healthcare and Pharmaceuticals                5%
                           Retail                                 18%                                                                         Construction and Building                     4%
                           Self-storage (Net Lease)                5%                                                                         Business Services                             4%
                                    (3)                                                                                                       Capital Equipment                             4%
                           Other                                   9%
                                                                                                                                              Durable Consumer Goods                        4%
                                                                                                                                              Hotel and Leisure                             3%
                                                                                                                                              Containers, Packaging and Glass               3%
                                                                                                                                              Sovereign and Public Finance                  3%
                                                                                                                                              High Tech Industries                          2%
                                                                                                                                              Other (4)                                    14%
1.   Portfolio information reflects pro rata ownership of real estate assets (excluding operating properties) as of March 31, 2022.
2.   Includes automotive dealerships.
3.   Includes education facilities, hotel (net lease), laboratory, theater, fitness facility, student housing (net lease), funeral home, restaurants and land.
4.   Includes tenants in the following industries: insurance, banking, non-durable consumer goods, aerospace and defense, metals, telecommunications, chemicals, plastics and rubber, media: broadcasting and   10
     subscription, wholesale, media: advertising, printing, and publishing, oil and gas, environmental industries, consumer transportation, forest products and paper, real estate and electricity.
Top Ten Tenants (1)
One of the lowest Top 10 concentrations among the net lease peer group

                                                                                                                Number of              ABR           WALT     % of
Tenant                      Description
                                                                                                                Properties          ($ millions)    (years)   Total

                            Net lease self-storage properties in the U.S.                                            78                $39            2.1      3.1%

                            Government office properties in Spain                                                    70                 30           12.7     2.4%
   State of Andalucia

                            Do-it-yourself retail properties in Germany                                              35                 28           14.9     2.3%

                            Business-to-business wholesale stores in Italy & Germany                                 20                 28           6.5      2.2%

                            Do-it-yourself retail properties in Poland                                               26                 23           8.4       1.8%

                            Net lease self-storage properties in the U.S.                                            27                 23           22.1      1.8%

                            Automotive dealerships in the United Kingdom                                             66                 23           12.7      1.8%

                            Net lease hotel properties in the U.S.                                                    18                21            1.8      1.7%

                            Distribution facilities in the U.S.                                                      29                 20           10.8      1.6%

                            K-12 private schools in the U.S.                                                          3                 19           21.5      1.5%

  Top 10                                                                                                            372               $255         10.7 yrs   20.2%

1. Portfolio information reflects pro rata ownership of real estate assets (excluding operating properties) as of March 31, 2022.

                                                                                                                                                                      11
Geographic Diversification (1)
W. P. Carey has been investing internationally for 23 years, primarily in Northern and
Western Europe
                                                                                   Other (2), 2%,
                                                                                     $26MM

                                                               Europe, 35%,
                                                                 $440MM

                                                                                                   United States, 63%,
                                                                                                        $797MM

                                                                            US           Europe             Other

1. Portfolio information reflects pro rata ownership of real estate assets (excluding operating properties) as of March 31, 2022.
2. Includes Canada (1.2%), Mexico (0.6%) and Japan (0.2%).
                                                                                                                                    12
Internal Growth from Contractual Rent Increases (1)
Over 99% of ABR comes from leases with contractual rent increases, including 58% linked to
CPI
                                                                                                 None, 0.6%
                                                                                       (2)
                                                                        Other, 4%

                                                                                                          Uncapped
                                                                                                           CPI, 38%
                                                              Fixed, 37%

                                                                                                                                            58% CPI-linked

                                                                                     CPI-based,
                                                                                        20%

1. Portfolio information reflects pro rata ownership of real estate assets (excluding operating properties) as of March 31, 2022.
2. Represents leases with percentage rent (i.e., participation in the gross revenues of the tenant above a stated level) and other increases.
                                                                                                                                                             13
Same-Store ABR Growth
Contractual same store growth of 2.7% (1)

                                                                                                                                                                                2.7%
 2.6%

 2.4%
                            2.2%
 2.2%
                                           2.0%
 2.0%                                                                    1.9%
                                                          1.8%                                                                                                    1.8%
 1.8%
              1.6%                                                                     1.6%                          1.6%                          1.6%
 1.6%                                                                                                 1.5%                          1.5%
 1.4%

 1.2%

 1.0%

 0.8%

 0.6%

 0.4%

 0.2%

0.0%
             2Q19           3Q19           4Q19           1Q20          2Q20           3Q20           4Q20            1Q21          2Q21           3Q21           4Q21           1Q22

1. Contractual same store portfolio includes leases that were continuously in place during the period from March 31, 2021 to March 31, 2022. Excludes leases for properties that were
   acquired, sold or vacated, or were subject to lease renewals, extensions or modifications at any time that affected ABR during that period. For purposes of comparability, ABR is
   presented on a constant currency basis using exchange rates as of March 31, 2022.                                                                                                    14
Lease Expirations and Average Lease Term (1)
Weighted-average lease term of 10.8 years

                                                                      Lease Expirations (% ABR) (2)

50%
                                                                                                                                                                                     46.5%

40%

30%

20%

 10%
                                             7.6%                                          6.8%
                                                            4.8%           4.6%                           5.0%           4.4%           5.2%            5.1%
                              3.8%                                                                                                                                    4.3%
               1.9%
     0%
               2022           2023 (3)       2024 (4)       2025           2026            2027           2028           2029           2030            2031          2032        Thereafter

1.   Portfolio information reflects pro rata ownership of real estate assets (excluding operating properties) as of March 31, 2022.
2.   Assumes tenants do not exercise any renewal or purchase options.
3.   Includes ABR of $16.1 million from a tenant (Marriott Corporation) with a lease expiration in January 2023.
4.   Includes ABR of $38.8 million from a tenant (U-Haul Moving Partners, Inc. and Mercury Partners, LP) that holds an option to repurchase the 78 properties it is leasing in April 2024.
     There can be no assurance that such repurchase will be completed.
                                                                                                                                                                                               15
Historical Occupancy (1)
Stable occupancy maintained during the global financial crisis and throughout the COVID-19
pandemic

                                                               Occupancy (% Square Feet) (2)
    100%
                                                   98.4%       98.8%      99.0%       99.2%       99.3%       99.8%      98.3%       98.9%                  98.5%       98.5%
                97.1%       96.6%       97.3%                                                                                                   98.5%

     80%

     60%

      40%

     20%

       0%
                2009        2010        2011       2012        2013        2014       2015        2016        2017       2018        2019       2020        2021        2022

1. Includes W. P. Carey and the following CPA REITs: Corporate Property Associates 12 Incorporated, Corporate Property Associates 14 Incorporated, Corporate Property Associates 15
   Incorporated, Corporate Property Associates 16 – Global Incorporated, Corporate Property Associates 17 – Global Incorporated (CPA:17) and CPA:18, as applicable. Portfolio
   information excludes operating properties.
2. Represents occupancy for each completed year at December 31; otherwise, occupancy shown is for the most recent quarter.                                                            16
Recent Acquisitions – Case Studies
Recent investment activity has been focused primarily on mission critical industrial and
warehouse properties and essential retail

                                         Recent Acquisitions

    True Value                      Coop                          Metra Aluminum
    December 2021                   February 2022                 February 2022

     Purchase Price: $44 million    Purchase Price: $34 million   Purchase Price: $21 million
     Facility Type: Industrial      Facility Type: Retail         Facility Type: Industrial
     Location: Cary, IL             Location: Various, Denmark    Location: Laval, Quebec, Canada
     Size: 571,465 square feet      Size: 121,263 square feet     Size: 162,600 square feet
     Lease Term: 20-year lease      Lease Term: 15-year lease     Lease Term: 25-year lease
     Rent Escalation: Fixed         Rent Escalation: Danish CPI   Rent Escalation: Fixed

                                                                                                    17
Capital Investments – Case Studies
Capital investments have become a more meaningful part of our investment activity and allow
us to pursue follow-on opportunities with existing tenants

                                        Recent Capital Investments

    Orgill                              Upfield Group                           Henkel
    Completed March 2022                Expected Completion Q2 2022             Completed April 2022

    Investment: $20 million expansion   Investment: $28 million build-to-suit   Investment: $70 million renovation
    Facility Type: Warehouse            Facility Type: Laboratory               Facility Type: Warehouse
    Location: Hurricane, UT             Location: Wageningen, The               Location: Bowling Green, KY
    Size: 427,680 square feet           Netherlands
                                                                                Size: N/A
    Lease Term: 20-year lease           Size: 65,734 square feet
                                                                                Lease Term: 15-year lease
    Rent Escalation: Fixed              Lease Term: 20-year lease
                                                                                Rent Escalation: Fixed
                                        Rent Escalation: Dutch CPI

                                                                                                                     18
Balance Sheet

                19
Balance Sheet Overview
     Capitalization (%)                                                                                            Capitalization ($MM)                                                          3/31/22
                                                                 3% 3%                                             Total Equity (1)                                                                  $15,553
                                                                                                                   Pro Rata Net Debt
          Equity (1)
                                                                                                                     Senior Unsecured Notes USD                                                        2,900
          Senior Unsecured Notes
                                                          25%                                                        Senior Unsecured Notes EUR                                                        2,803
          Mortgage Debt (pro rata)                                                                                   Mortgage Debt, pro rata USD                                                           219
                                                                                69%
          Unsecured Revolving Credit                                                                                 Mortgage Debt, pro rata (EUR $296 / Other $22)                                        318
          Facility / Term Loans
                                                                                                                     Unsecured Revolving Credit Facility USD                                                  –
                                                                                                                     Unsecured Revolving Credit Facility (EUR $283 / Oth. $193) 476
                                                                                                                     Unsecured Term Loans (EUR $107 / GBP $197)                                           304
         Capital Markets Activity
                                                                                                                   Total Pro Rata Debt                                                                $7,020
     •    ATM: Issued $340MM of equity through our ATM program in 2021 and
          $218MM of equity year-to-date through April 29th                                                           Less: Cash and Cash Equivalents                                                    (205)

                                                                                                                   Total Pro Rata Net Debt                                                            $6,815
     •    Oct 2021: Issued inaugural Green Bond - $350MM of 2.45% Senior
          Unsecured USD Notes due 2032                                                                             Enterprise Value                                                                 $22,368

     •    Aug 2021: Issued $404MM of equity through a forward offering                                             Total Capitalization                                                             $22,573

     •    Jun 2021: Issued $455MM of equity through a forward offering                                             Leverage Metrics
     •    Mar 2021: Issued €525MM of 0.95% Senior Unsecured EUR Notes due                                          Pro Rata Net Debt / Adjusted EBITDA (2)(4)                                             5.5x
          2030 and used the proceeds to redeem the outstanding 2.00% Senior
          Unsecured EUR Notes due 2023                                                                             Pro Rata Net Debt / Enterprise Value (1)(2)                                         30.5%
                                                                                                                   Total Consolidated Debt / Gross Assets (3)                                           39.7%
     •    Feb 2021: Issued $425MM of 2.25% Senior Unsecured USD Notes due
          2033 primarily used to prepay secured debt                                                               Weighted Average Interest Rate (pro rata)                                             2.5%
                                                                                                                   Weighted Average Debt Maturity (pro rata)                                       5.2 years

1.   Based on a closing stock price of $80.84 on March 31, 2022 and 192,394,960 common shares outstanding as of March 31, 2022.
2.   Pro rata net debt to enterprise value and pro rata net debt to Adjusted EBITDA are based on pro rata debt less consolidated cash and cash equivalents.
3.   Gross assets represent consolidated total assets before accumulated depreciation on real estate. Gross assets are net of accumulated amortization on in-place lease and above-market rent intangible assets.
4.   Adjusted EBITDA represents 1Q22 annualized Adjusted EBITDA, as reported in the Form 8-K filed with the SEC on April 29, 2022.                                                                                  20
Debt Maturity Schedule
 Principal at Maturity (1)

                                   Mortgage (2)                 Unsecured                       Unsecured                       Unsecured                       Unsecured
         1,400                     Debt                         Bonds (EUR)                     Bonds (USD)                     Term Loan                       Revolver

         1,200

                                                                476
         1,000
                                                   500
           800
                                                                              350
  $MM

                                                                304
           600

           400                                     555
                                                                              555           555                                      583
                                                                450                                      555                                      500
           200                                                                                                                                                              425
                                                                                                                       325                                       350
                         71          218
                                                   106                         31            21
                 0                                               54
                       2022         2023          2024         2025          2026          2027         2028          2029         2030          2031           2032        2033

% of Total (3)         1.0%          3.2%         16.7%         18.4%        13.4%          8.2%         7.9%          4.6%          8.3%         7.2%           5.0%        6.1%

Interest Rate (3)      3.8%          3.0%          3.3%         2.4%          3.2%          2.2%          1.4%         3.9%          1.0%         2.4%           2.5%       2.3%

 1. Reflects amount due at maturity, excluding unamortized discount and unamortized deferred financing costs.
 2. Reflects pro rata balloon payments due at maturity. W. P. Carey has one fully amortizing mortgage due in 2031 ($3MM).
                                                                                                                                                                                    21
 3. Reflects the weighted average percentage of debt outstanding and the weighted average interest rate for each year based on the total outstanding balance.
Unsecured Bond Covenants (1)
Investment grade balance sheet with Baa2/positive rating from Moody’s and BBB/positive
rating from S&P

Senior Unsecured Notes (2)
                                                                                                       Metric                                      Covenant                       March 31, 2022

                                                                                                   Total Debt /
  Total Leverage                                                                                                                                      ≤ 60%                                38.3%
                                                                                                   Total Assets

                                                                                                 Secured Debt /
  Secured Debt Leverage                                                                                                                               ≤ 40%                                  2.0%
                                                                                                  Total Assets

                                                                                         Consolidated EBITDA /
  Fixed Charge Coverage                                                                                                                               ≥ 1.5x                                 6.6x
                                                                                       Annual Debt Service Charge

                                                                                          Unencumbered Assets /
  Maintenance of Unencumbered Asset Value                                                                                                            ≥ 150%                                244.9%
                                                                                           Total Unsecured Debt

1. This is a summary of the key financial covenants for our Senior Unsecured Notes, along with estimated calculations of our compliance with those covenants at the end of the period presented. These ratios are
   not measures of our liquidity or performance and serve only to demonstrate our ability to incur additional debt, as permitted by the covenants governing the Senior Unsecured Notes.
2. As of March 31, 2022, our Senior Unsecured Notes consisted of the following note issuances: (i) $500 million 4.60% senior unsecured notes due 2024, (ii) €500 million 2.25% senior unsecured notes due 2024,
   (iii) $450 million 4.00% senior unsecured notes due 2025, (iv) $350 million 4.25% senior unsecured notes due 2026, (v) €500 million 2.25% senior unsecured notes due 2026, (vi) €500 million 2.125% senior
   unsecured notes due 2027, (vii) €500 million 1.35% senior unsecured notes due 2028, (viii) $325 million 3.85% senior unsecured notes due 2029, (ix) €525 million 0.95% senior unsecured notes due 2030, (x)      22
   $500 million 2.40% senior unsecured notes due 2031, (xi) $350 million 2.45% senior unsecured notes due 2032, and (xii) $425 million 2.25% senior unsecured notes due 2033.
History of Consistent Dividend Growth
W. P. Carey has increased its dividend every year since going public in 1998
• Current annualized dividend of $4.23 with a yield of 5.2% (1)
• Conservative and stable payout ratio since conversion to a REIT in September 2012

                                                                                   Dividends per Share (2)
                                                                                                                                                                                                          $5.00

                                                                                                                                                                                  $4.17   $4.21   $4.23
                                                                                                                                                                  $4.09   $4.14
                                                                                                                                                          $4.01
                                                                                                                                                  $3.93
                                                                                                                                          $3.83                                                           $4.00
                                                                                                                                  $3.69

                                                                                                                          $3.39

                                                                                                                                                                                                          $3.00

                                                                                                                  $2.44
                                                                                                          $2.19
                                                                                    $1.96   $2.00 $2.03
                                                                   $1.82   $1.88                                                                                                                          $2.00
                                           $1.73   $1.76   $1.79
           $1.67   $1.69   $1.70   $1.72
   $1.65

                                                                                                                                                                                                          $1.00

                                                                                                                                                                                                          $0.00
   1998 1999 2000 2001 2002 2003 2004 2005 2006 2007 2008 2009 2010 2011                                          2012 2013 2014 2015 2016 2017 2018 2019 2020 2021 2022

Note: Past performance does not guarantee future results.
1. Based on a stock price of $80.84 as of March 31, 2022, and a cash dividend of $1.057 per share declared during 1Q22.
2. Full year dividends declared per share, excluding special dividends. 2022 represents 1Q22 annualized.                                                                                                          23
ESG

      24
ESG Strategy
• Since our founding in 1973, we have maintained the commitment that acting responsibly towards our stakeholders and our
  communities is fundamental to being a good corporate citizen
• Our cross-functional ESG Committee serves to support our ongoing commitment to environmental and sustainability
  initiatives, corporate social responsibility and corporate governance

 Environmental                                                                  Social                                                                        Governance
 •      Evaluate and target new sustainability-                                 •    Corporate philosophy of Doing Good                                       •       Commitment to managing risk, providing
        linked investment opportunities, with the                                    while Doing Well® and Carey Forward                                              transparent disclosure and being
        goal of growing ABR and portfolio                                            and Carey the Torch programs promote                                             accountable to our stakeholders
        prominence from Green Buildings(1)                                           employee volunteer efforts and support                                   •       Maintained the highest QualityScore
 •      Proactively manage our portfolio’s major                                     community initiatives                                                            rating of “1” from ISS in Governance
        climate change risks by collecting tenant                               •    Signatory of CEO Act!on Pledge for
                                                                                                                                                              •       Female representation on our Board
        data and working to integrate with                                           Diversity & Inclusion; Head of DEI and
                                                                                                                                                                      represent 30% of director nominees
        benchmarking organizations, such as                                          DEI Advisory Committee lead our efforts
        GRESB and CDP(2)                                                             to facilitate conversations around race,                                 •       Key Governance Highlights
                                                                                     gender & other important topics                                              •    10 out of 11 independent directors, including
 •      Match our current and future Eligible
        Green Projects(3) with green-linked                                     •    Prioritize our employees and maintain a                                           a separate independent chairman
        financing, including the completion of                                       safe and inclusive work environment,                                         •    No related-party transactions
        our inaugural $350MM Green Bond                                              where we can attract and retain a high-                                      •    Independence of Directors reviewed
        offering in October 2021                                                     caliber workforce                                                                 annually
 •      Recent sustainability-linked investments                                •    Recognized as a constituent again in                                         •    Limitation on over-boarding
        include:                                                                     Bloomberg Equality Index for 2022                                            •    Proxy access with “3/3/20/20” market
      • $20MM expansion / solar roof                                            •    Our workforce:                                                                    standard
        installation for a BREEAM “Excellent”                                            180+                 39%                39                               •    Opted out of Maryland staggered board
        certified distribution facility                                                  Global          Racial / Ethnic   Average                                     provisions, annual director elections
      • $28MM expansion for a LEED Gold                                                Employees          Diversity (4)  Employee Age
                                                                                                                                                                  •    No poison pill
        certified supermarket warehouse                                         •    Women represent:
        distribution center                                                          48%             42%             33%             30%
      • $195MM acquisition of a targeted                                            of Global of Managers of Executive of our director
        BREEAM “Very Good” logistics facility                                       Workforce                 Team       nominees

1.   For a building to be considered “green certified” under our investment criteria, it must at a minimum be certified by LEED, BREEAM or a similarly recognized organization or certification process.
2.   GRESB – “Global Real Estate Sustainability Benchmark” and CDP – “Carbon Disclosure Project”.
3.   Eligible Green Projects are defined in WPC’s Green Financing Framework, available on our website.                                                                                                                 25
4.   Data is collected by our Human Resources Department and is only for our U.S.-based employees.
Investment Case Study
In 2021, we acquired a “BREEAM® Very Good” certified, Class-A logistics facility leased to Jaguar Land Rover Ltd.,
the U.K.’s largest premium automotive manufacturer

  Jaguar Land Rover
  Solihull, United Kingdom

   1.1-million-square-foot, newly constructed facility adjacent to
    JLR’s largest U.K. manufacturing plant

   LED motion-sensitive lighting

   Targeted Energy Performance Certificate (EPC) Rating: “A”

   90 bicycle spaces; 1,150 space multi-story car park

   Includes wellness facilities

   Lease Term: 30 years with inflation-based rent escalations

   Total Investment: $195 million

                                                                                                                     26
Cautionary Statement Concerning Forward-Looking Statements
Certain of the matters discussed in this communication constitute forward-looking statements within the meaning of the Securities Act of 1933 (as
amended, the “Securities Act”) and the Securities Exchange Act of 1934 (as amended, the “Exchange Act”), both as amended by the Private Securities
Litigation Reform Act of 1995. The forward-looking statements include, among other things, statements regarding the intent, belief or expectations of
the Company and can be identified by the use of words such as “may,” “will,” “should,” “would,” “will be,” “will continue,” “will likely result,” “believe,”
“project,” “expect,” “anticipate,” “intend,” “estimate” “opportunities,” “possibility,” “strategy,” “maintain” or the negative version of these words and
other comparable terms. These forward-looking statements include, but are not limited to, statements regarding: the anticipated benefits of the
proposed merger with Corporate Property Associates 18 – Global Incorporated (“CPA:18”), and any other comments made by representatives of
W. P. Carey Inc. (“W. P. Carey”); our ability to close the proposed merger; the impact of the proposed merger on our earnings and on our credit profile;
the strategic rationale and transaction benefits; and other statements that are not historical facts.

These statements are based on the current expectations of our management, and it is important to note that our actual results could be materially
different from those projected in such forward-looking statements. There are a number of factors that could have material adverse effects on our
future results, performance or achievements and cause our actual results to differ materially from the forward-looking statements. These factors
include, but are not limited to, the ability of the parties to satisfy the conditions precedent and consummate the proposed merger, the timing of
consummation of the proposed merger, the ability of the parties to secure any required stockholder approval in a timely manner or on the terms
desired or anticipated, the ability to achieve anticipated benefits and savings, risks related to the potential disruption of management’s attention due
to the pending merger, operating results and businesses generally, the outcome of any legal proceedings related to the proposed merger and the
general risks associated with the respective businesses of W. P. Carey and CPA:18 including the general volatility of the capital markets, terms and
employment of capital, the volatility of W. P. Carey’s share price, changes in the real estate investment trust industry, interest rates or general
economy, potential adverse effects or changes to the relationships with W. P. Carey or CPA:18 tenants, employees, service providers or other parties
resulting from the announcement or completion of the proposed merger, unpredictability and severity of catastrophic events, including but not limited
to the risks related to the effects of pandemics and global outbreaks of contagious diseases (such as the current COVID-19 pandemic) and domestic or
geopolitical crises, such as terrorism, military conflict (including the recent invasion of Ukraine by Russia), war or the perception that hostilities may be
imminent, political instability or civil unrest, or other conflict. Discussions of some of these other important factors and assumptions are contained in
W. P. Carey’s filings with the SEC and are available at the SEC’s website at http://www.sec.gov, including Part I, Item 1A. Risk Factors in W. P. Carey’s
Annual Report on Form 10-K for the fiscal year ended December 31, 2021, and Part II, Item 1A. Risk Factors in W. P. Carey’s Quarterly Report on Form
10-Q for the quarterly period ended March 31, 2022. Investors are cautioned not to place undue reliance on these forward-looking statements, which
speak only as of the date of this communication, unless noted otherwise. Except as required under the federal securities laws and the rules and
regulations of the SEC, W. P. Carey does not undertake any obligation to release publicly any revisions to the forward-looking statements to reflect
events or circumstances after the date of this communication or to reflect the occurrence of unanticipated events.

                                    All data presented herein is as of March 31, 2022 unless otherwise noted.
                                                  Amounts may not sum to totals due to rounding.
                                                Past performance does not guarantee future results.

                                                                                                                                                                27
Disclosures
The following non-GAAP financial measures are used in this presentation

EBITDA and Adjusted EBITDA
We believe that EBITDA is a useful supplemental measure to investors and analysts for assessing the performance of our business segments because
(i) it removes the impact of our capital structure from our operating results and (ii) it is helpful when comparing our operating performance to that of
companies in our industry without regard to such items, which can vary substantially from company to company. Adjusted EBITDA as disclosed
represents EBITDA, modified to include other adjustments to GAAP net income for certain non-cash charges, such as impairments, non-cash rent
adjustments and unrealized gains and losses from our hedging activity. Additionally, we exclude gains and losses on sale of real estate, which are not
considered fundamental attributes of our business plans and do not affect our overall long-term operating performance. We exclude these items from
adjusted EBITDA as they are not the primary drivers in our decision-making process. Adjusted EBITDA reflects adjustments for unconsolidated
partnerships and jointly owned investments. Our assessment of our operations is focused on long-term sustainability and not on such non-cash and
noncore items, which may cause short-term fluctuations in net income but have no impact on cash flows. We believe that adjusted EBITDA is a useful
supplemental measure to investors and analysts, although it does not represent net income that is computed in accordance with GAAP. Accordingly,
adjusted EBITDA should not be considered as an alternative to net income or as an indicator of our financial performance. EBITDA and adjusted
EBITDA as calculated by us may not be comparable to similarly titled measures of other companies.

Other Metrics

Pro Rata Metrics
This presentation contains certain metrics prepared on a pro rata basis. We refer to these metrics as pro rata metrics. We have a number of
investments, usually with our affiliates, in which our economic ownership is less than 100%. On a full consolidation basis, we report 100% of the assets,
liabilities, revenues and expenses of those investments that are deemed to be under our control or for which we are deemed to be the primary
beneficiary, even if our ownership is less than 100%. Also, for all other jointly owned investments, which we do not control, we report our net
investment and our net income or loss from that investment. On a pro rata basis, we generally present our proportionate share, based on our
economic ownership of these jointly owned investments, of the assets, liabilities, revenues and expenses of those investments. Multiplying each of our
jointly owned investments’ financial statement line items by our percentage ownership and adding or subtracting those amounts from our totals, as
applicable, may not accurately depict the legal and economic implications of holding an ownership interest of less than 100% in our jointly owned
investments.

ABR
ABR represents contractual minimum annualized base rent for our net-leased properties and reflects exchange rates as of December 31, 2021 or
March 31, 2022. If there is a rent abatement, we annualize the first monthly contractual base rent following the free rent period. ABR is not applicable
to operating properties and is presented on a pro rata basis.

                                                                                                                                                            28
You can also read