US Shopping Center Sales Volume & Buying Trends - March 2021
←
→
Page content transcription
If your browser does not render page correctly, please read the page content below
US Shopping Center Sales Volume &
Buying Trends – March 2021
COVID-19 surfaced in the United States in Mid-March 2020. Federal, state, and local governments
responded by issuing strict stay-at-home orders and closing nonessential business. Trends in retail sales,
vacancy rates, rent collection rates, and unemployment underscore the crippling effects of COVID-19 on
American consumers and businesses alike. Pre-crisis, there was uncertainty surrounding the retail market
as well. Given the rise in e-commerce, shopping patterns and preferences have changed, questioning
the demand for brick-and-mortar retail, and multi-tenant shopping centers in particular.
With COVID at the forefront, fundamentals in many major markets have been greatly altered. This report
analyzes trends in investment sales in the United States shopping center market from January 2019
through March 2021.
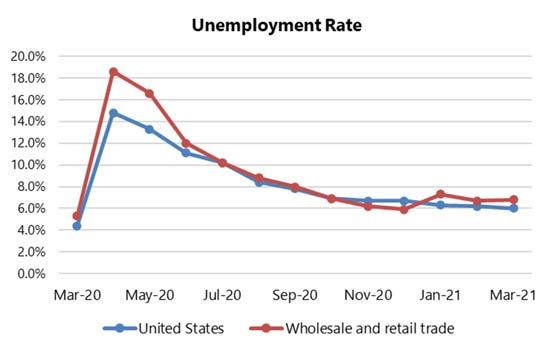
National unemployment
increased significantly since
the start of 2020, from 3.5% in
January to a peak of 14.8% in
April. Job losses in the
wholesale and retail trade
sector were particularly
significant. Since April,
businesses have started to re-
open and unemployment is
showing signs of
improvement. This metric will
be watched carefully as we
continue into 2021.
Empire State Building, 350 Fifth Avenue, Suite 4320, New York, NY 10118 212.425.4300 marshall-stevens.com
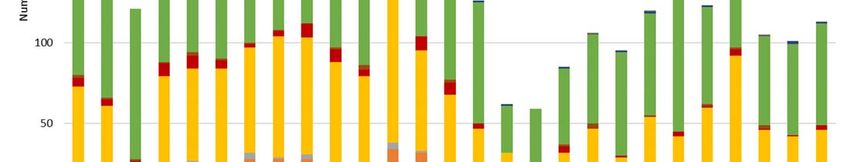
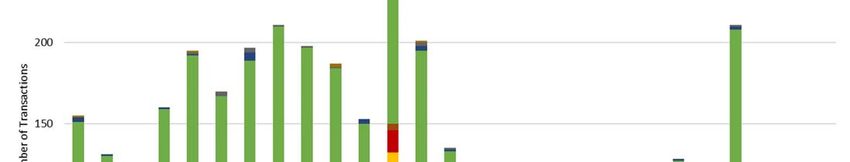
Number of Sales Transactions
Parameters: Multi-tenanted, shopping center, investment sales from January 2019 through March 2021, segmented by type of
shopping center.
Leading into 2020, shopping centers were viewed as a relatively risky property type, and the ongoing crisis is perpetuating this trend.
Originally focused on traditional retail use, shopping centers are looking at more work, play, live uses, and interim uses such as drive-
through movie theaters, as the outlook for dry retail is grim.
April 2020- initial COVID shockwaves grip market, number of transactions plummets.
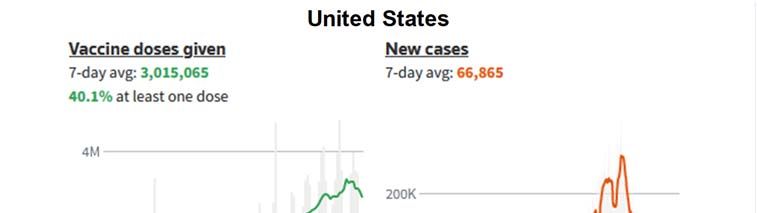
Uptick in transaction volume from May 2020 to October 2020 coincides with lower case counts.
December 2020- 211 total transactions- the highest number of sales seen since December 2019.
March 2021- 113 total transactions, slightly lower than the 126 transactions seen in March 2020, one year prior.
The market remains in flux and volume will be watched carefully throughout 2021.
The pandemic has caused consumer spending habits to change dramatically, with ecommerce offering convenience and safety to consumers.
Dry retail has suffered and will face a lot of questions in the near term, likely leading to revised store formats and greater use of in-store
technology. Grocery anchored centers, and centers having “essential” services have fared better than most other segments. So far this year,
sales volume has been relatively low and fluctuating coming out of 2020.
Empire State Building, 350 Fifth Avenue, Suite 4320, New York, NY 10118 212.425.4300 marshall-stevens.com
Dollar Volume of Sales Transactions
In 2019, the average monthly sales volume was approximately $1.9 billion, with the peak occurring in December 2019 at $3.9 billion.
Comparatively, the average monthly sales volume in 2020 was roughly $0.9 billion, reflecting a decrease of approximately 53%. Q1 2021
Volume averaged $744 million, which is 17% below the 2020 Average.
Monthly Dollar Volume - United States Shopping Center
YEAR 2019 2020 2021 (Jan‐Mar)
Min $873,381,448 $214,186,891 $538,151,686
Max $3,881,909,114 $2,545,692,745 $854,253,750
Average $1,887,257,965 $897,227,979 $744,230,915
% Difference ‐ ‐52.5% ‐17.1%
The category with the highest transaction volume is in the “Neighborhood Center” category, which comprises approximately 35% of
total dollar volume. There were 34 sales in this category in March 2021.
The category that recorded the second highest amount of transaction volume was in the “Community Center” category, which
comprises approximately 21% of total dollar volume. There were only 11 sales in this category in March 2021, reflecting a slight
increase compared to February 2021, as well as March 2020.
There were zero sales in the Airport Retail, Regional Mall, Outlet Center, and Theme/Festival Center categories in March 2021.
Empire State Building, 350 Fifth Avenue, Suite 4320, New York, NY 10118 212.425.4300 marshall-stevens.com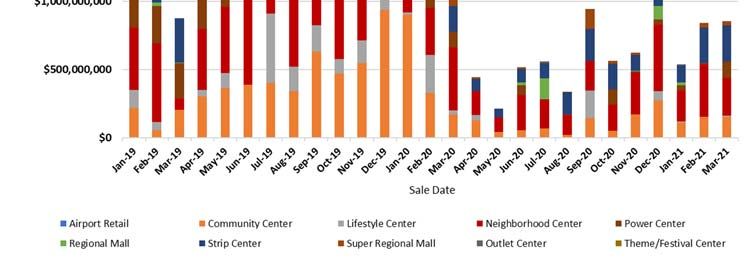
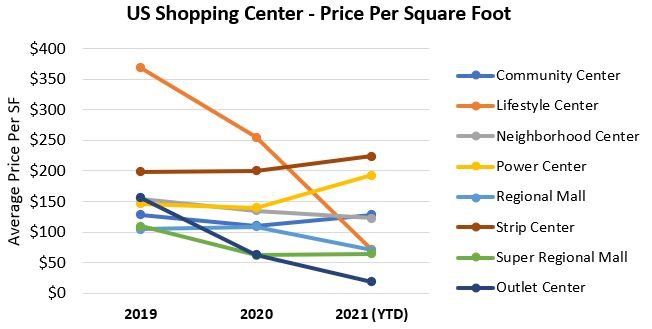
Price Per Square Foot

In 2019, the average price per square foot was $181, which is higher than 2020 figures at an average price per square foot figure of $142, and
higher than year to date figures as of March 2021. For all property types, overall price per square foot has dropped 38% when comparing 2019
to 2021.

  Price Per Square Foot from 2019 to 2021
  Average $ Per SF         2019      2020    2021 (YTD) % Change
  Airport Retail           $142       N/A        N/A       N/A
  Community Center         $128      $111       $128      0.3%
  Lifestyle Center         $369      $255        $71     -80.6%
  Neighborhood Center      $154      $135       $123     -20.2%
  Power Center             $146      $140       $193      31.8%
  Regional Mall            $105      $109        $70     -32.9%
  Strip Center             $199      $201       $224      12.7%
  Super Regional Mall      $109      $62         $65     -40.9%
  Outlet Center            $156      $63         $19     -87.6%
  Theme/Festival Center    $297      $205        N/A     -31.1%
  Average                  $181      $142       $112     -38.1%

The “Outlet Center” category demonstrated an 87.6% decrease in average price per square foot from 2019 to 2021 YTD, the most significant
decrease seen in the various shopping center types. Almost every segment is seeing declines compared to the past two years. The “Strip
Center” category has seen slight growth, with a 12.7% increase in average price per square foot over the past two years.

Average Capitalization Rates

In 2019, the average cap rate for the US shopping center market was 8.51%. This figure dropped to 8.47% in 2020, but so far there have been
significant increases in 2021.

  Average Capitalization Rate from 2019 to 2021
  Average OAR              2019      2020 2021 (YTD) Basis Point Change
  Airport Retail          8.47%       N/A    N/A              N/A
  Community Center        8.34%     8.13%   9.54%          119.76
  Lifestyle Center        7.31%     6.83%   8.83%          151.80
  Neighborhood Center     8.03%     8.01%   8.77%            73.21
  Power Center            8.22%     8.41%    N/A             19.52
  Regional Mall           11.65%    9.75%   9.31%          -233.50
  Strip Center            7.49%     7.40%   7.19%           -30.59
  Super Regional Mall     11.43%   12.20%    N/A             77.50
  Outlet Center           9.19%     7.00%    N/A           -219.22
  Theme/Festival Center   5.00%       N/A    N/A              N/A
  Average                 8.51%     8.47%   8.73%            21.36

Given the large amount of uncertainty, price discovery has proven to be an area of difficulty and landlords may wait for the dust to settle
before they trade their assets at low valuations. Given the current climate, which has been marked by rent collection issues, and vacancy
increases, we could see cap rates push upwards as 2021 continues. The magnitude to which cap rates move is still up in the air and market
participants will be eager to see what the data shows, as more transaction information becomes available.

                                                                 Patrick T. Craig, MAI, MRICS                                   Emily Ferreira
                                                                 Executive Managing Director                                    Director
                                                                 Real Estate Valuation Practice                                 Real Estate Valuation Practice
                                                                 212.897.9481                                                   646.438.7605
                                                                 ptcraig@marshall-stevens.com                                   eferreira@marshall-stevens.com

                                                                    SOURCE: CoStar, STDB, US Bureau of Labor Statistics, The Motley Fool and Marshall & Stevens

                                                  Empire State Building, 350 Fifth Avenue, Suite 4320, New York, NY 10118   212.425.4300   marshall-stevens.com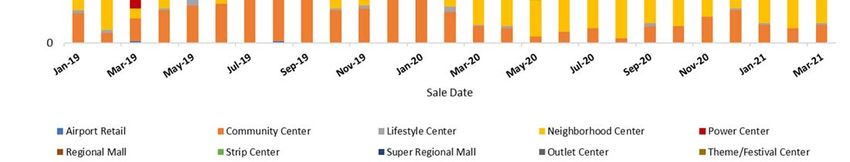
You can also read


