University of Birmingham The Physcomitrella patens gene atlas project - University of ...
←
→
Page content transcription
If your browser does not render page correctly, please read the page content below
University of Birmingham

The Physcomitrella patens gene atlas project
Perroud, Pierre-François; Haas, Fabian B; Hiss, Manuel; Ullrich, Kristian K; Alboresi,
Alessandro; Amirebrahimi, Mojgan; Barry, Kerrie; Bassi, Roberto; Bonhomme, Sandrine;
Chen, Haodong; Coates, Juliet C; Fujita, Tomomichi; Guyon-Debast, Anouchka; Lang,
Daniel; Lin, Junyan; Lipzen, Anna; Nogué, Fabien; Oliver, Melvin J; Ponce de León, Inés;
Quatrano, Ralph S
DOI:
10.1111/tpj.13940

Document Version
Peer reviewed version

Citation for published version (Harvard):
Perroud, P-F, Haas, FB, Hiss, M, Ullrich, KK, Alboresi, A, Amirebrahimi, M, Barry, K, Bassi, R, Bonhomme, S,
Chen, H, Coates, JC, Fujita, T, Guyon-Debast, A, Lang, D, Lin, J, Lipzen, A, Nogué, F, Oliver, MJ, Ponce de
León, I, Quatrano, RS, Rameau, C, Reiss, B, Reski, R, Ricca, M, Saidi, Y, Sun, N, Szövényi, P, Sreedasyam, A,
Grimwood, J, Stacey, G, Schmutz, J & Rensing, SA 2018, 'The Physcomitrella patens gene atlas project: large-
scale RNA-seq based expression data', The Plant Journal, vol. 95, no. 1, pp. 168-182.
https://doi.org/10.1111/tpj.13940

Link to publication on Research at Birmingham portal

Publisher Rights Statement:
Checked for eligibility: 15/05/2018
This is the peer reviewed version of the following article: Perroud, P. , Haas, F. B., Hiss, M. , Ullrich, K. K., Alboresi, A. , Amirebrahimi, M. ,
Barry, K. , Bassi, R. , Bonhomme, S. , Chen, H. , Coates, J. , Fujita, T. , GuyonDebast, A. , Lang, D. , Lin, J. , Lipzen, A. , Nogué, F. , Oliver,
M. J., Ponce de León, I. , Quatrano, R. S., Rameau, C. , Reiss, B. , Reski, R. , Ricca, M. , Saidi, Y. , Sun, N. , Szövényi, P. , Sreedasyam, A.
, Grimwood, J. , Stacey, G. , Schmutz, J. and Rensing, S. A. (2018), The Physcomitrella patens gene atlas project: large scale RNAseq
based expression data. Plant J., which has been published in final form at doi:10.1111/tpj.13940. This article may be used for non-
commercial purposes in accordance with Wiley Terms and Conditions for Use of Self-Archived Versions.

General rights
Unless a licence is specified above, all rights (including copyright and moral rights) in this document are retained by the authors and/or the
copyright holders. The express permission of the copyright holder must be obtained for any use of this material other than for purposes
permitted by law.

•Users may freely distribute the URL that is used to identify this publication.
•Users may download and/or print one copy of the publication from the University of Birmingham research portal for the purpose of private
study or non-commercial research.
•User may use extracts from the document in line with the concept of ‘fair dealing’ under the Copyright, Designs and Patents Act 1988 (?)
•Users may not further distribute the material nor use it for the purposes of commercial gain.

Where a licence is displayed above, please note the terms and conditions of the licence govern your use of this document.

When citing, please reference the published version.
Take down policy
While the University of Birmingham exercises care and attention in making items available there are rare occasions when an item has been
uploaded in error or has been deemed to be commercially or otherwise sensitive.

If you believe that this is the case for this document, please contact UBIRA@lists.bham.ac.uk providing details and we will remove access to
the work immediately and investigate.

Download date: 06. Mar. 2022

DR PIERRE-FRANÇOIS PERROUD (Orcid ID : 0000-0001-7607-3618)

             DR FABIAN B. HAAS (Orcid ID : 0000-0002-7711-5282)
Accepted Article
             DR J. C. COATES (Orcid ID : 0000-0002-2381-0298)

             PROFESSOR STEFAN A RENSING (Orcid ID : 0000-0002-0225-873X)

             Article type      : Resource

             The Physcomitrella patens gene atlas project: large scale RNA-seq based expression
             data.

             Pierre-François Perroud1,*, Fabian B. Haas1, Manuel Hiss1, Kristian K. Ullrich1, 18, Alessandro
             Alboresi2,   19
                            , Mojgan Amirebrahimi3, Kerrie Barry3, Roberto Bassi2, Sandrine Bonhomme4,
             Haodong Chen5, Juliet Coates6, Tomomichi Fujita7, Anouchka Guyon-Debast4, Daniel Lang8,
             Junyan Lin3, Anna Lipzen3, Fabien Nogué4, Melvin J. Oliver9, Inés Ponce de León10, Ralph
             S. Quatrano11, Catherine Rameau4, Bernd Reiss12, Ralf Reski13,17, Mariana Ricca14,
             Younousse Saidi6,20, Ning Sun5,            Peter Szövényi14, Avinash Sreedasyam15, Jane
             Grimwood15, Gary Stacey16, Jeremy Schmutz3,15, Stefan A. Rensing1, 17,*

             1
                 Plant Cell Biology, Faculty of Biology, University of Marburg, Marburg, Germany.
             2
                 Dipartimento di Biotecnologie, Università di Verona, Verona, Italy.
             3
                 DOE Joint Genome Institute, Walnut Creek, CA, USA.
             4
                 Institut Jean-Pierre Bourgin, INRA, AgroParisTech, CNRS, Université Paris-Saclay, RD10,
             Versailles, France.
             5
                 School of Advanced Agriculture Sciences, and School of Life Sciences, Peking University,
             Beijing, China.
             6
                 School of Biosciences, University of Birmingham, Edgbaston, Birmingham, UK.
             7
                 Department of Biological Sciences, Hokkaido University, Hokkaido, Japan.
             8
                 Helmholtz Zentrum München, Munich, Germany.
             9
                  USDA-ARS-MWA, Plant Genetics Research Unit, University of Missouri, Columbia MO,
             USA.
             10
                   Department of Molecular Biology, Clemente Estable Biological Research Institute,
             Montevideo, Uruguay.

             This article has been accepted for publication and undergone full peer review but has not
             been through the copyediting, typesetting, pagination and proofreading process, which may
             lead to differences between this version and the Version of Record. Please cite this article as
             doi: 10.1111/tpj.13940
             This article is protected by copyright. All rights reserved.
11
Department of Biology, Washington University in St Louis, St Louis, USA
12
Max Planck Institute for Plant Breeding Research, Köln, Germany.
13
Plant Biotechnology, Faculty of Biology, University of Freiburg, Freiburg, Germany.
Accepted Article
14
Department of Systematic and Evolutionary Botany, University of Zurich, Switzerland.
15
HudsonAlpha Institute for Biotechnology, Huntsville, AL, USA.
16
Divisions of Plant Science and Biochemistry, National Center for Soybean Biotechnology,
University of Missouri, Columbia, MO, USA.
17
BIOSS Centre for Biological Signaling Studies, University of Freiburg, Germany.
18
Present address: Max Planck Institute for Evolutionary Biology, Ploen, Germany.
19
Present address: Dipartimento di Biologia, Università di Padova, Padova, Italy.
20
Present address: Bayer Crop Science, Technologiepark, Gent (Zwijnaarde), Belgium.
* Authors for correspondence:
pierre-francois.perroud@biologie.uni-marburg.de
stefan.rensing@biologie.uni-marburg.de
Running head: A RNA-seq transcriptome for Physcomitrella patens
Keywords:
Physcomitrella patens, RNA-seq, transcriptome analysis, developmental stage, stress,
differential expression
Abstract
High throughput RNA sequencing (RNA-seq) has recently become the method of choice to
define and analyse transcriptomes. For the model moss Physcomitrella patens, although this
method has been used to help the analysis of specific perturbations, no overall reference
dataset has been established yet. In the framework of its Gene Atlas project, the Joint
Genome Institute selected P. patens as a flagship genome, opening the way to generate the
first comprehensive transcriptome dataset for this moss. The first round of sequencing
described here is composed of 99 independent libraries spanning 34 different developmental
stages and conditions. Upon dataset quality control and processing through read mapping,
28,509 of the 34,361 v3.3 gene models (83 %) were detected to be expressed across the
This article is protected by copyright. All rights reserved.samples. Differentially expressed genes (DEGs) were calculated across the dataset to
permit perturbation comparisons between conditions. The analysis of the three most distinct
and abundant P. patens growth stages, protonema, gametophore and sporophyte, allowed
Accepted Article
us to define both general transcriptional patterns and stage-specific transcripts. As an
example of variation of physico-chemical growth conditions, we detail here the impact of
ammonium supplementation under standard growth conditions on the protonemal
transcriptome. Finally, the cooperative nature of this project allowed us to analyse inter-
laboratory variation, as 13 different laboratories around the world provided samples. We
compare the differences between single-laboratory experiment replication with the
comparison of the same experiment between different laboratories.
Introduction
Since the discovery of its intrinsically efficient gene targeting (Schaefer and Zrÿd, 1997),
followed by its genome sequencing (Rensing et al., 2008, Lang et al., 2018), the moss
Physcomitrella patens has become the leading reference non-seed plant model. It is now
notably integrated in studies focused on the water-to-land plant transition (e.g. (Renault et
al., 2017) or establishment of tri-dimensional growth in plants (for review (Harrison, 2017),
both fields of study integrating detailed functional cell biology investigation with kingdom-
wide gene and genome comparison. As these multiple research fields grew, so did their
associated technical approaches. Amongst them, RNA–seq (deep sequencing of cDNA) is
now dominating the field of RNA detection and quantification at the transcriptome level,
replacing the probe-based microarray technology. Detailed knowledge of the transcriptome
of a given organism is being used to improve genome assemblies (Song et al., 2016), to
better understand and describe RNA splicing pattern (Gaidatzis et al., 2015), and to
characterize spatiotemporal transcriptome variation (expression profiling), both with respect
to development and environmental perturbations.
In the green lineage, RNA-seq approaches to assess transcriptome-wide patterns were
initially used in models such as Arabidopsis thaliana (Lister et al., 2008) or Chlamydomonas
reinhardtii (González-Ballester et al., 2010), followed by major crop plants such as maize
(Eveland et al., 2010) and rice (Zhang et al., 2010), for which a complete genome sequence
was available. Furthermore, the improvement of de novo assembly of transcriptomes
allowed use of this approach to characterize transcriptomes in organisms without genome
sequence available (e.g. Cassia angustifolia, (Rama Reddy et al., 2015), gaining knowledge
of both the raw sequence information and about biological processes in species previously
limited by the lack of a transcriptome. The most wide-spread de novo transcriptome
This article is protected by copyright. All rights reserved.assembly effort so far is the 1KP project, covering more than 1,300 species of the green
algae and the land plant lineage with low RNA-seq sequencing coverage (Matasci et al.,
2014).
Accepted Article
In non-seed plants, RNA-seq based transcriptomic studies have been reported in multiple
species both in parallel to genome sequencing projects and via de novo analysis. Besides P.
patens (see below), other mosses have published transcriptomes: Sphagnum spp. (Devos
et al., 2016), Bryum argenteum (Gao et al., 2014), Ceratodon purpureus (Szövényi et al.,
2015), Funaria hygrometrica (Szövényi et al., 2011) or Syntrichia caninervis (Gao et al.,
2015). Published datasets are also available for liverworts, including Pellia endiviifolia (Alaba
et al., 2015) and Marchantia polymorpha (Sharma et al., 2014), the genome of which has
recently been published (Bowman et al., 2017). The transcriptome of the lycophyte
Selaginella moellendorffii, for which a draft genome is available (Banks et al., 2011) has also
been subjected to extensive RNA-seq study (Zhu et al., 2017). Due to their large genome
size, ferns form a group reporting exclusively de novo transcriptome datasets so far, e.g.
Acrostichum spp., Ceratopteris thalictroides (Zhang et al., 2016), Ceratopteris richardii
(Bushart et al., 2013) and Lygopodium japonicum (Aya et al., 2015).
In P. patens, RNA-seq datasets have been released in multiple experimental contexts,
unfortunately with no systematic multiple experimental replication (for review see (Hiss et al.,
2017)). For example, the P. patens transcriptome profile has been studied with respect to
developmental stage (Xiao et al., 2011) in addition to stress treatments including bleomycin
(Kamisugi et al., 2016). Analysis of heat stress impact on alternative splicing has also
benefited from the RNA-seq approach (Chang et al., 2014). Recently, transcriptomic
responses to plant hormone treatments with abscisic acid (Stevenson et al., 2016) and auxin
(Lavy et al., 2016) have been studied. Additionally, comparative transcriptomic approaches
have been applied to mutant analysis (Chen et al., 2012, Demko et al., 2014) and to analyze
and catalogue small RNAs in P. patens (e.g. (Coruh et al., 2015, Lang et al., 2018)).
The present study describes the first part of the P. patens dataset of the JGI Gene Atlas
Project (http://jgi.doe.gov/doe-jgi-plant-flagship-gene-atlas/). After reviewing the dataset we
focus on experiment comparisons underscoring different aspects of such large scale
projects. In terms of tissue specific expression profiling we show the possibility of defining
specific transcripts for the three dominant life stages of P. patens: protonema, gametophore
and sporophyte. We also tackle two aspects of transcriptome comparison experiments. We
evaluate the impact of nitrogen supplementation in single-laboratory settings and show here
the power of such an approach. Moreover, the diversity of the sample sources permitted us
This article is protected by copyright. All rights reserved.to compare two experimental replica sets of the same growing conditions performed by two
different laboratories to evaluate inter-laboratory replication.
Accepted Article
Results and discussion
Overview of the dataset
The P. patens Gene Atlas dataset comprises 99 sequenced libraries of 34 different
experiments. All but three experiments are composed of three biological replicates. For
experiments XIV, XVIII and XXII one of the libraries failed for technical reasons, hence they
are formed of biological duplicates. 13 laboratories actively working with P. patens around
the world contributed to the samples described in the Materials and Methods section. The
detailed description of all samples and primary sequencing statistics are presented in Table
S1 and Table S2. The sampling covers the three dominant P. patens stages, protonema (the
gametophytic two-dimensional filamentous stage emerging from the spore), gametophore
(the gametophytic tridimensional leafy shoot stage) and sporophyte (the sporophytic tissue
developing after sexual reproduction that forms spores by meiosis). It must be noted that the
age of the protonema at harvest varies from 7 to 21 days. Since gametophore buds typically
start to emerge after 7 days of growth, most of the protonemal samples are a mixture of
protonemal cells and gametophore cells (see Table S2 for detailed harvesting times for each
experiment). With this time criteria, the samples VII, XI, XVIII, XIX and XXI to XXIV are the
only samples that are potentially pure protonema. The sequencing output (raw sequenced
reads) was analyzed in silico using the standardized procedure schematized in Figure 1.
Overall, 4.2 billion raw reads were generated, with each condition represented by 76 to 150
million raw reads. 99.02 % of the reads were mapped successfully to the genomes of P.
patens (nuclear, chloroplast and mitochondrial). Furthermore, 90.04% of the reads mapped
uniquely to the P. patens nuclear genome V3 and were used for further data analyses. After
mapping, 22,610 to 26,012 out of 34,361 gene models of the P. patens v3.3 genome
annotation, i.e. 65.8 to 75.7 % of the gene models, are observed with more than one read.
All conditions considered, more than 80% of all predicted gene models are detected with
more than one read. Subsequently, normalized (RPKM) counts were calculated for each
individual gene model (see Data S1 for the full RPKM dataset).
A Principal Component Analysis (PCA) performed with the RPKM normalized counts of all
libraries (Figure 2) allows detection of three major sample clusters. The largest cluster
(circled in red) is formed by the protonema and gametophore samples regardless of the
perturbation (except ABA/drought). The second distinct cluster comprises the six sporophytic
This article is protected by copyright. All rights reserved.samples (circled in green). Finally, both ABA treatment and dehydrated/rehydrated
gametophore samples form a third cluster (circled in blue), probably linked to water stress
and its hormonal signal integrator, ABA. Biological replicates are expected to be tightly
Accepted Article
grouped and for most of them this is the case (see for example triplicate of exp. XIX in
Figure 2, dotted ellipse a). Yet, it is to note that several triplicates are more scattered than
expected (see for example triplicate of exp. XVI in Figure 2, dotted ellipse b), potentially
making the comparison between experiments challenging, particularly within some of the
protonemal treatments (Figure 2 red ellipse). Finally to complement and confirm the
expected experimental sample clustering, we performed a hierarchical clustering of all 99
RNA-seq samples (Figure S1). Here, 95% of the replicas grouped properly. The exception
are restricted to two groups of closely related samples, V and VIII, XII and XIII, that form two
clusters of six libraries but do not group by experiment. Also, the clustering of experiment XI
is scattered, suggesting a potential problem with these samples.
The last computing step of our pipeline (Figure 1) was the detection of differentially
expressed genes (DEGs) between experiments. The DEGs were called using a strict
consensus approach of three callers (see Material and Methods for computational details).
Overall, 50 relevant experiment comparisons (Table S3 for general overview) were
generated. The complete list of detected DEGs are shown in Data S1 next to the individual
RPKM library counts. The highest number of DEGs were detected in experiments associated
with very strong perturbations such as gametophore compared to dehydrated gametophore
(exp. XIII compared to XVII) with 9,305 DEGs, protoplast compared to protonema with 7,746
DEGs (exp. VIII compared to IX) or protonema compared to ABA treated protonema with
6,940 DEGs (exp. XIX compared to XVIIII). At the other extreme, a few comparisons
displayed a very limited number of DEGs. Of note, the comparison between dehydrated and
rehydrated gametophore showed only 10 DEGs (exp. XIII compared to XII). The treatment
itself is not lethal and the gametophores restart to grow after the treatment. However, the
two hours of rehydration prior to harvesting are probably too short to generate significant
transcriptional changes. More puzzling is the detection of a single DEG between the tissue
treated with the strigolactone analogue G24 and its solvent control (exp. V compared to
XXXVIII). This 24 h treatment has been shown to affect transcript accumulation as well as
tissue morphology in P. patens (Hoffmann et al., 2014, Decker et al., 2017) as well as in
angiosperms (in A. thaliana (Mashiguchi et al., 2009) or in tomato (Mayzlish-Gati et al.,
2010), for example), indicating that the assay may not have worked properly for this specific
treatment. On the other hand, the actual P. patens regulatory network under strigolactone
influence appears reduced in size compared to those of other hormones (Waldie et al.,
2014), and the detection of specific transcript accumulation variation upon strigolactone
This article is protected by copyright. All rights reserved.treatment is dependent on light conditions during growth as well as on the endogenous level
of strigolactone (Lopez-Obando et al., 2016). In this context it is possible that three-week old
tissue could be insensitive to the strigolactone treatment. In comparison with most of the
Accepted Article
other comparisons with higher DEG number, these two cases with almost no detected DEGs
show that near perfect replication can be achieved with such comparative experiments.
Stage-specific transcriptome
Protonema, gametophore and sporophyte are the three dominant life stages of P. patens.
We choose experiment VII, XVII and XV (Table S1 and S2) as representative of these
tissues based on three criteria. First, all cultures were performed on Knop medium. Second,
the timing was strictly controlled, particularly the harvesting time for protonema, which was at
seven days to ensure an absence of early gametophore development. Finally, the
protonemata were visually checked for the absence of gametophores. To get a bird’s eye
overview of the differences between the three most abundant P. patens tissues we
performed a Gene Ontology (GO) term enrichment analysis on the pair-wise up- or down-
regulated DEGs between these tissues (Data S1 for DEG, Data S2 for GO term list) The
most obvious detectable signals are differences in metabolism as illustrated in the word
cloud in Figure S2. Foremost, the reduction in photosynthetic activity in the sporophyte
compared to both protonema (Figure S2B) and gametophore (Figure S2D) is easily
observable. The two most the two most abundant enriched GO terms among the DEGs of
lower abundance in sporophytic tissue compared to both gametophytic tissues are identical:
photosynthesis and photosynthesis light reaction. Together with other terms directly linked to
photosynthesis, such as photosystem assembly, generation of precursor metabolites and
energy or plastid organization, they are dominating the term list associated with down-
regulated transcripts in sporophytic tissue. The protonemata–sporophyte comparison
complements and validates the previously observed pattern between gametophore and
sporophyte in P. patens (O'Donoghue et al., 2013) and in another moss, Funaria
hygrometrica (Szövényi et al., 2011). This trend is in line with the known nutritional
dependency of the sporophyte on the gametophore.
The GO term analysis also detects a sporophyte-specific carbon consumption-related
pathway up-regulation, which has been previously described in P. patens (O'Donoghue et
al., 2013). Compared to protonemata and gametophore, carbohydrate metabolism is the
most over-represented term in the up-regulated transcripts of the sporophyte. However, the
type of carbon use appears to differ between the two comparisons. Terms associated with
fatty acid (metabolism, biosynthesis or general lipid metabolism) characterize the difference
This article is protected by copyright. All rights reserved.between sporophyte and protonema (Figure S2C), while terms associated with coumarin
(biosynthesis, metabolism) are abundant in the over-accumulated transcripts in sporophyte
as compared to gametophore (Figure S2D). Furthermore, the term coumarin covers the
Accepted Article
biosynthesis of the phenylpropanoids, a large group of secondary metabolites with protective
functions such as lignin precursors or sporopollenin (Colpitts et al., 2011, Daku et al., 2016,
de Vries et al., 2017, Niklas et al., 2017), all of which are enriched in or specific to
sporophytes.
The dominant GO term enrichment between protonemata and gametophore is linked to
carbon fixation and use too. Carbon metabolism is the most frequent GO term associated
with the up-regulated transcripts in protonema (Figure S2E). The nature of this seven day
old tissue, young cells dividing and expanding constantly, requires a carbon conversion to
cell wall compounds (e.g. the GO term external encapsulating structure organization) that is
not present in most of the more mature cells of gametophores. Concurrently, GO terms
associated with lipid, amino acid and nucleic acid biosynthesis are associated with up-
regulated protonemal DEGs, all marking actively growing tissue. Overall a similar signal was
detected previously (Xiao et al., 2011) between three days old and 14 days old protonemal
culture. In contrast, GO terms associated with photosynthesis are dominating the protonemal
low / gametophore high abundance transcript list (Figure S2F). These GO terms reflect the
fact that on the contrary to protonema, the leafy gametophore is a mature structure
dedicated to photosynthesis as principal function. Photosynthates are used not only to
maintain viability of the tissue, but will be used to feed the sporophyte during its development
(Hiss et al., 2014, Regmi et al., 2017).
From the GO term enrichment analysis to the single transcript level, the challenge to define
stage-specific transcripts resides in the fact that even a transcript that is highly abundant in a
given stage, for example the sporophyte, and absent in others, e.g. protonema or
gametophore grown in standard growth conditions, can be induced by a variation of the
growth conditions. For example, the transcript Pp3c7_6750V3.1, which encodes a Ferritin-
like domain containing protein, displays a very high accumulation in sporophyte (RPKM >
1,500) and is below detection level in protonema and gametophore under standard growing
conditions. However, this transcript can be induced in protonema treated with ABA or in
dehydrated gametophores to even higher level than in the sporophyte (> 3,000 RPKM in
both cases). Hence, we used two criteria to define stage-specific transcripts: 1) presence in
the given tissue (RPKM > 2) and the absence in the other two (RPKM = 0-2) and 2) absence
in all other samples across the dataset that do not contain the specific tissue. Figure 3
displays the six transcripts selected to represent protonema, gametophore and sporophyte
stages (two each) using the present dataset. Pp3c2_4100V3.1 encodes one copy (out of 25
This article is protected by copyright. All rights reserved.in P. patens) of the ribulose-bisphosphate carboxylase small chain (rbcS) protein that
appears to be specifically expressed in protonemal tissue. The protonemal cell wall is
essentially formed of primary cell wall that provides a reduced protection to light, specific
Accepted Article
expression of high turnover proteins of the photosystem may be a way to cope with this
higher light exposure. The other protonema specific selected transcript, Pp3c1_10720V3.1,
encodes a protein without known annotation and only detected in in bryophytes by
Phytozome gene ancestry list. Its specific presence in protonema probably explains the lack
of data about it, but makes it a good marker for such tissue. Pp3c26_11940V3.1, specifically
expressed in gametophores, encodes a putative SF7 - FASCICLIN-LIKE
ARABINOGALACTAN PROTEIN 11, a cell wall component, in a group that appears to be
specific to bryophytes too. Pp3c26_11940V3.1 is one of the four homologs coding for such
proteins showing similar accumulation pattern, but the only one indicating a complete
specificity to gametophore tissue. Pp3c7_9490V3.1 encodes a carbonic anhydrase:dioscorin
precursor protein and is accumulating specifically in gametophores. Finally, transcripts
specific to sporophyte tissue are more abundant, with more than 150 transcripts found only
in that tissue. General morphology (capsule and seta are the only enclosed multilayer
tissues in moss), the unique presence of meiosis and generation of secondary metabolites
such as oleosin and sporopollenin (Daku et al., 2016, Hiss et al., 2017) may explain this
observation. Pp3c6_15559V3.1, the first chosen sprorophyte-specific transcript, reflects a
potential metabolic need, the transport of carbohydrate across the sporophyte as it encode
for a member of the Nodulin-like protein family (Denancé et al., 2014). These integral
proteins are known to transport carbohydrates such as sucrose across membranes and thus
allow optimal allocation of reserve between cells. The second transcript selected for
sporophyte identity is Pp3c5_26440V3.1, which encodes for the MKN1-3 protein, a class II
knotted1-like homeobox transcription factor (Champagne and Ashton, 2001). This gene has
been extensively studied in P. patens (Singer and Ashton, 2007, Sakakibara et al., 2008)
and is involved in sporophyte patterning, a developmental network specific to this organ.
These six tissue markers were part of previously conducted microarray experiments and
analyzed from a tissue specific perspective (Hiss et al., 2014, Ortiz-Ramirez et al., 2016,
Hiss et al., 2017). While they all were confirmed to be expressed in the respective tissue, the
tissue specificity does not match perfectly with the present dataset, except for the
sporophyte-specific genes (Table S4). Notably, non-tissue-specific expression was detected
for the four gametophytic markers (in sporophytic tissue). The differences in both tissue
preparations and technologies (in particular the higher sensitivity of RNA-seq) may be the
cause of these varied expression pattern.
This article is protected by copyright. All rights reserved.Impact of ammonium supplementation on the protonemal liquid culture transcriptome
The comparison between P. patens liquid cultures grown under identical conditions but for
Accepted Article
the source of nitrogen (exp. XXIII and XXIV, respectively supplemented Knop medium
containing 5 mM ammonium tartrate and 4.2 mM nitrate compared to standard Knop
medium containing only 4.2 mM nitrate) yielded 357 DEGs with more than a two-fold
change, with 289 down-regulated DEGs and 68 up-regulated DEGs by the ammonium
supplementation (Data S1). The GO term enrichment analysis performed on each subset
concurs with the well-known plant response to ammonium supplementation (Data S3). The
addition of ammonium in the medium is clearly reflected by the repression of genes involved
in nitrate assimilation and metabolism as it is generating an accumulation of transcripts
related to primary carbon metabolism (Figure 4A and B respectively for the 15 most
abundant GO terms present in the down- and up regulated DEGs induced by the ammonium
supplementation, Figure S3A and B for complete set of enriched GO terms).
More specifically, the effect of the addition of NH4 to the medium corresponds with previous
studies: the gene expression associated with nitrate cell import, nitrate primary metabolism
and some associated genes is strongly reduced, in some cases to the absence of detectable
transcripts. Tsujimoto et al. (2007) analyzed nitrate transporter transcript accumulation under
different nitrogen sources in P. patens, and their results are recapitulated in the present
dataset: NRT2 and the Nar2 nitrate transporter family members show strong down-
regulation upon ammonium treatment (Figure 4C) (Tsujimoto et al., 2007). Plant nitrate to
ammonium conversion is an energetically costly process, hence upon ammonium
supplementation both necessary enzymes are transcriptionally repressed in all analyzed
plants (Hachiya and Sakakibara, 2016). This pattern is as well detected in the present
dataset where both nitrate reductase coding genes (Pp3c10_9670V3.1, Pp3c10_9540V3.1,
Pp3c14_9410V3.1) and nitrite reductase coding genes (Pp3c27_6610V3.1,
Pp3c16_15880V3.1) are strongly inhibited by the ammonium supplementation (Figure S4A).
On the other hand, we also observe loss of transcript abundance for genes involved in
ammonium assimilation: both ammonium transport genes, AMT2s (Pp3c18_18460V3.1,
Pp3s397_40V3.1, Pp3c16_12080V3.1, and Pp3c18_18460V3.1) and primary ammonium
assimilation genes, glutamate synthase (Pp3c14_8740V3.1), glutamine synthetase
(Pp3c18_10780V3.1) and asparagine synthetase (Pp3c20_17620V3.1) display a reduction
of transcript abundance upon ammonium treatment (Figure S4A). This reduction may be the
result of the ammonium concentration used in the experimental setting (5 mM ammonium
tartrate), a concentration high enough that it may require an overall regulatory repression of
the ammonium metabolism.
This article is protected by copyright. All rights reserved.Indirect effects of different trophic conditions are also detected in this dataset. The two
genes most induced by the ammonium treatment (> 30-fold), Pp3c20_19940V3.1 and
Pp3c20_1770V3.1, belong to transporter gene families involved in salt and metabolite
Accepted Article
homeostasis. Pp3c20_19940V3.1 encodes a gene coding for a Na P-type ATPase protein
demonstrated to be necessary for active Na+ cell export in P. patens (Lunde et al., 2007).
The repression of nitrate import under ammonium supplementation affects K+ import
(Coskun et al., 2015), hence the cytoplasmic Na+/K+ ratio may be adjusted as a result of this
specific transcript increase. Pp3c20_1770V3.1 encodes for a member of the nodulin family.
The solute specificity is not well established for all members of this family (Denancé et al.,
2014), but specific homologs of nodulin genes in angiosperm are involved notably in amino
acid transport (Ladwig et al., 2012). Thus, Pp3c20_1770V3.1 abundance increase hints at
amino acid relocation upon ammonium treatment.
In parallel to nitrate and ammonium related processes, a cluster of genes associated with
cell wall modification appears down-regulated under ammonium supplementation. This
repression may reflect the morphological change observed upon ammonium addition: in
presence of nitrate only, P. patens tip cells rapidly differentiate into caulonemal cells, the
faster elongating and longer protonemal cell type (Figure S3D). In the presence of
ammonium, the tip cell mostly comprise of chloronemal cells of shorter size (Figure S3C).
Indeed, we observed a reduction of transcript accumulation of known cell wall loosening
genes such as xyloglucan endotransglucosylase hydrolase (Pp3c16_20960V3.1), pectin
methylesterases (Pp3c3_30560V3.1, Pp3c3_35240V3.1, Pp3c4_22420V3.1) and extensins
(Pp3c16_3130V3.1, Pp3c27_3570V3.1) (Figure S3B), all involved in cell elongation and
modification of cell shape (Lamport et al., 2011, Cosgrove, 2016).
The addition of ammonium promotes transcript over-accumulation as well. Although this list
is much shorter, we can detect a trend to primary carbon metabolism genes such as
Ribulose-1,5-bisphosphate carboxylase/oxygenase (RuBISCO) small subunit
(Pp3c15_22730V3.1, , Pp3c12_7010V3.1, Pp3c3_12530V3.1) or carbonate dehydratase
(Pp3c26_6810V3.1, Pp3c26_6990V3.1) (Figure S3C). Carbon and Nitrogen metabolism are
closely linked (Coskun et al., 2016). The increase of primary carbon metabolism associated
transcripts in P. patens is similar to what is observed in angiosperms. This expression bias is
also reflected in the difference in appearance of the P. patens tissue between the two
conditions. The chloronemal cells are dominant under presence of ammonium, in which
smaller cells are filled with numerous chloroplasts, while in nitrate-only condition the tissue is
dominated by caulonemal cells displaying a reduced number of chloroplasts (Figure S3D
and C respectively).
This article is protected by copyright. All rights reserved.Intra- and inter-laboratory comparison
The present dataset allows to compare identical experiments performed within a single
Accepted Article
laboratory and between two different laboratories. Experiments VII and XXI and XXII (Table
S1 and S2) are true replicas. Unfortunately, experiment XXI is only formed of two replica as
mentioned previously. Hence the comparison of results needs to be regarded as indicative of
a trend only. Each of the two laboratories involved generated protonemal liquid culture in
Knop medium and sampling was performed at day seven after tissue homogenization. The
RNA was subsequently extracted by the laboratory and sent to the JGI for uniform library
construction and sequencing. Hence, the two main sources of variation are the cultures
themselves and the RNA extraction. Experiments VII and XXI samples were isolated using
the same standardized protocol (see Methods), experiment XXII the Trizol step was omitted.
RNA samples passed a rigorous quality control (carried out by a single lab) prior to library
construction. Post sequencing quality control indicates no major differences in read length,
GC content and total number of sequenced reads (see Figure S5 for the read length profile
and number for each libraries), indicating that detected differences should be mostly
attributed to laboratory (culture) variation.
The within-laboratory comparison, experiment XXII compared to XXI, displays a limited
number of DEGs, 42 with a fold change > 0 - 2 equally distributed between up (23) and
down (19) DEGs (Data S1). This low number could be attributed at least partially to the
absence of biological triplicate for experiment XXI or to the Trizol omission in the experiment
XXII. Nevertheless, the amplitude of the variation remains in a single order of magnitude,
contrary to most of the other comparison in which the calculated fold change can span up to
five orders of magnitude. The GO term enrichment analysis (Data S4, Figure S6) performed
on these DEGs point to a potential trophic variation source: experiment XXII displays an
increase of GO terms associated with response to external nitrogen processes (nitrate
transport, response to nitrate) as well as to cell death and protein recycling (regulation of cell
death, positive regulation of cell death or regulation of cellular processes). On the other
hand, iron import-related terms dominate the down regulated DEGs. Together, these terms
point to a potential nitrogen source depletion leading to metabolic and metal homeostasis
redirection. Since both iron and nitrate are added separately in the medium, a slight variation
in the media could potentially explain these DEGs. However, the low number of observed
DEGs and their low fold change indicates good reproducibility, given the sensitivity of RNA-
seq to detect minor changes in transcript abundance.
This article is protected by copyright. All rights reserved.In contrast, 1,262 DEGs were detected in total (727 up, 535 down) with a fold change > 2
between experiments VII and XXII (Data S1). The number and the amplitude of the DEGs
(up to 500) suggest a clear difference between these samples. Two major sources of
Accepted Article
variation could generate such difference: a contamination with other P. patens tissue, and a
variation in growing condition generating a stress response. To assess these two
possibilities, we compared the DEG list between the two experiments and the DEGs
obtained by comparing them to protonemata compared to gametophore (exp. VII compared
to XX) to test the tissue hypothesis. We also compared them to three different stress
conditions: the effect of ABA on protonemata (exp. XIX compared to XVIII), the effect of high
light on protonemata + gametophores (exp. II compared to I) and the effect of elevated
temperature (heat stress) to protonemata + gametophores (exp. XXV compared to XXVI).
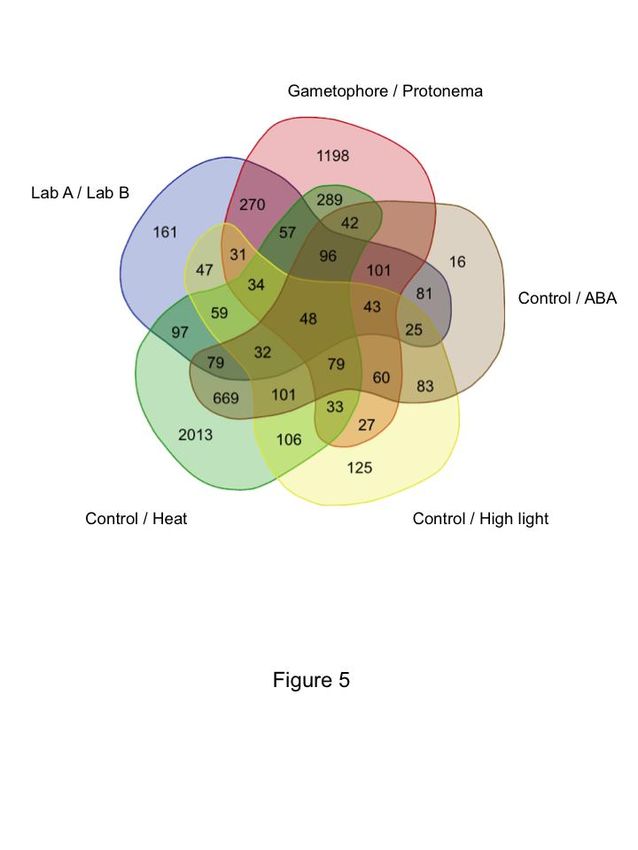
Figure 5 illustrates that the observed differences can indeed come from different sources.
1,101 out of 1,262 DEGs detected in the inter laboratory comparison can be seen in other
experiments. Focusing on the comparison with developmental stage only, 680 (54 %) of
these DEGs are also seen in the DEGs identified in the protonema to gametophore
comparison. A clear example of gametophore presence are transcripts for
Pp3c27_3570V3.1, a gene coding for a putative extensin precursor that displays a 250 fold
increase between protonemal and gametophore tissues and shows more than 64 fold
difference between experiment XXI and VII. The source of such gametophore contamination
could be explained in differences of weekly grinding of the tissue to maintain a pure
protonemata culture. Continuously cultured protonema in liquid culture sometimes develops
gametophore buds after seven days and thus the culture needs to be blended regularly to
reset the protonema to day one of the culture cycle. Yet, the difference between experiments
VII and XXII cannot be attributed to this kind of tissue contamination alone. The three
stresses compared in the same figure, ABA treatment, heat and high light also display DEG
overlap. Each stress displays a specific signature as well as overlap with other experiments,
but we can identify 32 DEGs between the three stress conditions and the laboratory
comparison that should reflect a general stress response. It is difficult to evaluate exactly the
cause of these stresses, but differences between laboratories such as temperature and
humidity regime of the growth chamber and type / age of the white light system used can
potentially generate the stresses detected in this comparison. It should be noted that in a
within lab comparison it was previously shown that liquid culture (with regular blending) as
such does not seem to represent a stress condition for P. patens (Hiss et al., 2014). The
relatively large number of DEGs detected in the inter-lab comparison thus demonstrates the
sensitivity of RNA-seq and hence the fact that minor fluctuations in growth conditions can
result in well detectable changes to the transcriptome.
This article is protected by copyright. All rights reserved.Conclusions and outlook
The present transcriptome dataset represents an important addition to the existing
Accepted Article
expression profiling data for the moss P. patens. By its sample size and sequencing depth,
covering more than 80% of the v3.3 P. patens gene models, the dataset will, along with
others, permit improvement of future gene annotation versions. The RPKM values for all
individual v3.3 P. patens gene models in addition to 50 DEG sets are published with this
study, representing a valuable benchmark reference for future RNA-seq studies. Cross-
comparison across large datasets is an important approach to confirm transcript specificity to
any biological phenomenon, be it developmental, as exemplified in the present study by the
stage comparisons or environmental as pointed out by the laboratory replica case. As more
datasets are published, the body of data will permit better understanding of variable
parameters, but it is clear that the RNA-seq approach is sensitive enough to detect
differences in growth conditions, qualitative or quantitative, that can escape careful
laboratory observation. Therefore, experimental replica conditions should be very carefully
controlled and documented to allow comparison within and between laboratories. More P.
patens Gene Atlas data are forthcoming, representing, for example, additional
developmental stages such as non-germinated spores and gametophores bearing
gametangia (sexual organs), as well as further perturbation experiments looking into the
plants’ response to variation in phosphate concentration in the medium, which will further
enhance the usefulness of the present set of expression profiling data. The data presented
here are currently available as a supplement to this paper (Data S1). Moreover, expression
values assigned to genes can be accessed at Phytozome (https://phytozome.jgi.doe.gov/).
Other large scale P. patens expression data are available at Genevestigator (Hiss et al.,
2014) and the eFP browser (Ortiz-Ramirez et al., 2016). It will be a valuable future goal to
unify these data into a single resource.
Experimental procedures
Plant material
Physcomitrella patens Gransden (Engel, 1968) was used for all samples apart from the two
sporophyte sets, for which P. patens Reute was used (Hiss et al., 2017). The protonemata
cultures were systematically entrained by two successive weeks of culture prior to treatment
in order to obtain a homogeneous culture. Medium referred to as BCD uses the composition
described by (Cove et al., 2009), and medium referred to as Knop uses the composition
described by (Reski and Abel, 1985) based on Knop’s medium (Knop, 1868). Solid medium
This article is protected by copyright. All rights reserved.(medium with 1% [w/v] agar) protonemal cultures were grown atop a cellophane film to allow
tissue transfer for specific treatments (e.g. with hormones), and for easy harvesting. If not
otherwise mentioned, Petri dishes were sealed with parafilm during the growing period and
Accepted Article
plates and flasks were cultivated at 22°C with a 16-h-light/8-h-dark regime under 60-80 µmol
m-2 s-1 white light (long-day conditions). All harvests were performed in the middle of the light
photoperiod (+8 hours of light in long day conditions), followed by immediate flash freezing in
liquid nitrogen, unless otherwise stated. All experiments, referred to by Roman numerals,
consist of biological triplicates of the given condition.
Sample description
Table S1 presents a simplified version of the experiments with the associated libraries’
repository references.
Light treatments
Light quality:
Prior to treatment, P. patens protonemata were cultivated for one week on solidified
supplemented BCD medium (BCD supplemented with 5mM ammonium tartrate and 0.5%
sucrose (for dark treated samples) or 0.5% glucose (for light treatments). Plants were
cultivated in long-day conditions. Subsequently, the cultures were transferred into the
following light conditions:
Dark treated samples were grown in darkness for 1-2 weeks (exp. XXIX).
Far red light samples were grown under continuous 2 µmol m-2 s-1 far red light at 720-740
nm for 1-2 weeks and harvested (exp. XXXIII).
Red light samples were grown under continuous 10 µmol m-2 s-1 red light at 660-680 nm for
1-2 weeks and harvested (exp. XXX).
Blue light samples were grown under continuous 5 µmol m-2 s-1 blue light at 460-480 nm for
1-2 weeks and harvested (exp. XXXI).
UV-B light samples were grown under continuous 4 µmol m-2 s-1 white light supplemented
with 1 µmol m-2 s-1 UV-B light at 300-320 nm for 1-2 week and harvested (exp. XXVIII).
This article is protected by copyright. All rights reserved.Light quantity:
Prior to treatment, P. patens protonemata were cultivated for 10 days under standard long-
Accepted Article
day conditions on solidified Knop medium.
High light samples were transferred to 850 µmol m-2 s-1 white light for 2 hours and harvested
(exp. II).
Low light samples were transferred to 10 µmol m-2 s-1 white light for 2 hours and harvested
(exp. III).
Control light samples were maintained at 70 µmol m-2 s-1 white light for 2 hours and
harvested (exp. I).
Tissues:
Germinating spores
P. patens mature sporophytes were harvested, opened and spores suspended in sterile
water. Spores were distributed on Petri dishes containing solid Knop medium supplemented
with 5 mM ammonium tartrate. Spores were germinated for 4 days at 24°C under continuous
light and harvested (exp. IV).
Protonemata grown on solid medium
Protonema was cultivated on solidified BCD medium, in Petri dishes sealed with 3M
Micropore tape under standard conditions. Protonema was cultivated for 7 days and
harvested (exp. XVIII).
Protonemata grown in liquid medium
Protonema was cultivated in liquid Knop medium in flasks with continuous shaking under
standard conditions. Protonema was cultivated for 7 days and harvested by filtering with a
100µm sieve (exp. VII, XXI, XXII).
This article is protected by copyright. All rights reserved.Gametophores
Gametophores were cultivated on solidified BCD medium without cellophane, in Petri dishes
Accepted Article
sealed with 3M Micropore tape under standard conditions. Gametophores were cultivated for
5 weeks and the aerial part of the plant was harvested (exp. XVII).
Gametophores were cultivated on solidified Knop medium without cellophane, under
standard conditions. Gametophores were grown for 5 weeks and the aerial part of the plant
was harvested (exp. XX).
Leaflets (phyllids, non-vascular leaves of the gametophore)
Gametophores were cultivated on solidified Knop medium without cellophane, under
standard conditions. After 5 weeks of growth, leaflets were separated from the gametophore
stem using forceps, harvested, and stored into RNAlater solution (Qiagen) before liquid
nitrogen flash freeze as a single sample (exp. XIV).
Sporophytes
P. patens Reute sporophytes were induced as initially described by Hohe and collaborators,
modified by Hiss and collaborators (Hohe et al., 2002, Hiss et al., 2017). Shortly,
gametophytic tissue was grown for 5 weeks on solidified mineral Knop medium under
standard conditions. Gametangia production was induced by transferring the plates at 16°C,
8-h-light/16-h-dark regime with 20 µmol m-2 s-1 white light (short-day conditions). After 3
weeks in this regime, plants were watered regularly to promote efficient fertilization and let
develop under short-day conditions.
Green sporophytes with a round capsule shape and green colour were harvested after 5
weeks of short day growth (immature post meiotic stage M (Hiss et al., 2017)) and stored
into RNAlater solution (Qiagen) before liquid nitrogen flash freeze as a single sample (exp.
XV).
Brown sporophytes with a round capsule shape and brown colour were harvested after 7
weeks of short day growth (mature stage stage B (Hiss et al., 2017)) and stored into
RNAlater solution (Qiagen) before liquid nitrogen flash freeze as a single sample (exp. XVI)
This article is protected by copyright. All rights reserved.Hormones
Auxin
Accepted Article
Gametophores were cultivated on a sieve above liquid Knop medium in Magenta boxes
(Sigma-Aldrich, St. Louis, US) sealed with parafilm under standard conditions for 10 months.
At that time point, auxin samples were treated with 10 µM naphthaleneacetic acid (NAA) and
cultivated for 10 days before harvesting. Samples with and without NAA were generated
(exp. XXXIII and XXXIV).
Strigolactone
Protonemata were cultivated on solidified BCD medium in Petri dishes sealed with 3M
Micropore tape under standard conditions. The tissue was cultivated for 21 days. Cellophane
discs containing tissue were transferred to BCD plates containing either 1 µM racemic GR24
(synthetic strigolactone) or acetone without GR24 as control, incubated for 24 hours and
harvested (exp. V and XXXVIII).
Gibberellin
Protonemata was cultivated on solidified BCD medium, supplemented with 20µM GA9-
methylester under standard conditions. GA9-methylester was synthesized and donated by
Peter Hedden’s group at Rothamstead Research, Harpenden, UK. Protonema was
cultivated for 7 days and harvested (exp. XI).
Abscisic acid
Protonemata were cultivated on solidified BCD medium, in Petri dishes sealed with 3M
Micropore tape under standard conditions. Protonema was cultivated for 6 d. Cellophane
disk containing tissue were transferred to BCD plates containing 50 µM abscisic acid (ABA)
and incubated for 24 h. before harvesting (exp. XIX).
This article is protected by copyright. All rights reserved.OPDA
Protonemata were cultivated on solidified BCD medium, supplemented with 5 mM
Accepted Article
ammonium tartrate with or without 50 µM 12-oxo-phytodienoic acid (OPDA) in Petri dishes
sealed with 3M Micropore tape under standard conditions. Protonemata were cultivated for
14 days. Cellophane discs containing tissue were transferred to ammonium tartrate-
containing BCD plates with or without 50 µM 12-oxo-phytodienoic acid (OPDA) and
incubated for 6 h. before harvesting (exp. X and IX respectively).
Perturbations:
Protoplasts
Protonemata were cultivated for 6 days on solidified mineral medium BCD supplemented
with ammonium tartrate (2.7 mM) and glucose (0,5%), in Petri dishes sealed with 3M
Micropore tape under standard conditions. Protoplasts were released using driselase
treatment (Cove et al., 2009) and harvested (exp. VIII).
Ammonium treatment
Protonemata cultivated in liquid Knop medium was used to inoculate two parallel cultures:
one with Knop medium and a second with Knop medium supplemented with 5 mM
ammonium tartrate in flasks with continuous shaking under standard conditions. Protonema
was cultivated for 7 days and harvested 2 hours after the lights were turned on (exp. XXIV
without ammonium, exp. XXIII, with ammonium).
De- and Rehydration
Gametophores were cultivated on cellophane discs on solidified BCD medium under
standard conditions for 5 weeks prior to the dehydration treatment. The gametophores on
the cellophane discs were placed in empty Petri dishes that were sealed in chambers
containing an atmosphere of 91% RH generated by a saturated solution of MgSO 4 in an
incubator at 17°C with a 16 h light, 8 h dark cycle. Gametophores were exposed to the
dehydrating atmosphere until they reached a constant weight (equilibrium). Equilibrium was
reached at approximately 150h (Koster et al., 2010) and gametophores were sampled at
180h (exp. XII). The water potential of the gametophore tissue at equilibrium was -13 MPa.
This article is protected by copyright. All rights reserved.Rehydration was achieved by floating the cellophane discs containing the dehydrated
gametophores on sterile water in a Petri dish for 5 minutes to ensure full rehydration. Once
fully rehydrated the discs were placed on solid BCD media and incubated under standard
Accepted Article
conditions in the light for 2h before harvest (exp. XIII).
Heat
Protonemata was cultivated on solidified BCD medium supplemented with 5 mM ammonium
tartrate under continuous light for the duration of the treatment. The heat treatment was
applied after 5 days of pre-growth for 5 days with heat shock cycles of 6 hours repeating 5
hours at 22°C and 1 hour at 37° before harvesting (exp. XXVI treatment and XXVII control).
RNA extraction, RNA processing and sequencing.
Frozen samples were pulverized with mortar and pestle and total RNA was extracted in two
steps: 1) total RNA was extracted using Trizol reagent (Invitrogen), using the manufacturers’
instruction (maximum of 100 mg of tissue per ml of Trizol reagent) 2) total RNA was purified
using the RNeasy Plant Mini Kit (Qiagen), omitting the shredding step of the kit.Total RNA
was checked for integrity using a BioAnalyzer with an Agilent RNA 6000 Nano Chip following
manufacturer’s instruction (Agilent technologies, Santa Clara, CA, USA). Plate-based RNA
sample preparation was performed on the PerkinElmer Sciclone NGS robotic liquid handling
system using Illumina's TruSeq Stranded mRNA HT sample prep kit utilizing poly-A selection
of mRNA following the protocol outlined by Illumina in their user guide:
http://support.illumina.com/sequencing/sequencing_kits/truseq_stranded_mrna_ht_sample_
prep_kit.html, and with the following conditions: total RNA starting material was 1 g per
sample and 8 cycles of PCR was used for library amplification. The prepared libraries were
then quantified by qPCR using the Kapa SYBR Fast Illumina Library Quantification Kit (Kapa
Biosystems) and run on a Roche LightCycler 480 real-time PCR instrument. The quantified
libraries were then prepared for sequencing on the Illumina HiSeq sequencing platform using
a TruSeq paired-end cluster kit, v4, and Illumina’s cBot instrument to generate a clustered
flowcell for sequencing. Sequencing of the flowcell was performed on the Illumina
HiSeq2500 sequencer using HiSeq TruSeq SBS sequencing kits, v4, following a 2x150
indexed run recipe.
This article is protected by copyright. All rights reserved.RNA-seq processing
The RNA-seq processing steps described below are presented in a condensed view in the
Accepted Article
illustrating pipeline in Figure 1.
Quality trimming and adapter removal
Each library was initially checked with FastQC version 0.11.2 to evaluate read quality
(http://www.bioinformatics.babraham.ac.uk/projects/fastqc/). Subsequently, lower quality
bases and sequencing adapters were removed using Trimmomatic version 0.33 (Bolger et
al., 2014) with the following parameters: ILLUMINACLIP:TruSeq3-PE-2.fa:2:30:10
SLIDINGWINDOW:4:15 HEADCROP:12 MINLEN:50. Finally, a read length of minimum 50
nt per read was required for further processing.
Poly-A tail trimming
Due to the nature of RNA-seq data, poly-A tails are expected. With PRINSEQ version 0.20.4
(Schmieder and Edwards, 2011) poly-A tails with a minimum length of 12 were identified and
removed.
Paired-end read merging
During an Illumina paired-end sequencing, fragmented RNA will be sequenced from both
sides. If the fragments are smaller than the double read length, the reads are overlapping
each other. Such overlapping reads were merged with the help of COPEread version 1.2.5
(Liu et al., 2012).
Mapping
The read mapping was performed using GSNAP version 2015-12-31.v5 (Wu and Nacu,
2010) using the options -A sam -N 1 --split-output --failed-input. The read mapping was
performed in two steps: all reads were mapped first against P. patens organellar genomes
and rRNA sequences (mitochondrial NC_007945.1; chloroplast NC_005087.1; ribosomal
HM751653.1, X80986.1, X98013.1). The remaining reads were then mapped against P.
This article is protected by copyright. All rights reserved.patens genome V3 ((Lang et al., 2018), https://phytozome.jgi.doe.gov/pz/portal.html) and
concordant unique mapped read pairs were kept.
Accepted Article
File converting
The conversion of the mapping output files from SAM to BAM format and the sorting by
positions was done using samtools version 1.2 (Li et al., 2009).
Read count
For read counting, HTSeq-count version 0.6.1p1 (Anders et al., 2015), in combination with
the P. patens gene model v3.3 (Lang et al., 2018), was applied. Additionally to default
options the following parameters were set: -s reverse -r pos -t exon -i Parent.
Differential expression analysis
DEG calling approaches can generate different results (Zhang et al., 2014, Schurch et al.,
2016). Hence, in order improve confidence in the DEGs used here, several algorithms were
tested. DEG analysis was performed in R version 3.2.0 using three R packages, egdeR
v3.14.0 (Robinson et al., 2010), DESeq2 v1.12.3 (Love et al., 2014) and NOISeq v2.12.0
(Tarazona et al., 2011). P-value cutoffs for edgeR and DESeq2 were 0.001, for NOISeq the
probability of differential expression (“prob”) was > 0.9. Genes with zero counts in all
replicates were removed. The previously detected array DEGs are known to be of high
quality (Hiss et al., 2014). The higher sensitivity of RNA-seq based approaches often leads
to calling of DEGs that exhibit very low expression levels, the biological significance of which
might be questionable. In order to rely on a trustworthy set of DEGs we decided to use the
NOISeq RPKM normalized DEGs because they capture the majority of the array DEGs,
overlap with a high fraction of DEGs also detected by EdgeR and DeSeq2, but exclude a
high number of DEGs detected only by the latter two tools (see Figure S7 for the Venn
diagram representation of the four ways DEG call comparison), which are characterized by a
particularly low average expression level (3.5 FPKM, as compared to the 51.7 FPKM
average for the overlap of array and all three RNA-seq DEG callers). The number of DEGs
called exclusively by NOISeq (not overlapping with other approaches) is the lowest one of all
approaches. Thus, for further analysis NOISeq RPKM normalized DEGs were used.
This article is protected by copyright. All rights reserved.You can also read