Unique Solid Dispersions by Microwave Fusion Technique with Etoricoxib and Thiocolchicoside
←
→
Page content transcription
If your browser does not render page correctly, please read the page content below
Advances in Pharmacology and Pharmacy 10(2): 104-113, 2022                                                http://www.hrpub.org
DOI: 10.13189/app.2022.100204

         Unique Solid Dispersions by Microwave Fusion
        Technique with Etoricoxib and Thiocolchicoside:
            In vivo Evaluation and Comparison with
                     Marketed Formulation
                                 Hemanth Annepogu1, Hindustan Abdul Ahad2,*

     1
       Department of Pharmaceutics, St. Johns College of Pharmaceutical Sciences, Yerrakota, Yemmiganur-518360, AP, India
   2
    Department of Industrial Pharmacy, Raghavendra Institute of Pharmaceutical Education and Research (RIPER)-Autonomous,
                                                  Ananthapuramu-515001, AP, India

                         Received July 6, 2021; Revised November 22, 2021; Accepted March 28, 2022

Cite This Paper in the following Citation Styles
(a): [1] Hemanth Annepogu, Hindustan Abdul Ahad , "Unique Solid Dispersions by Microwave Fusion Technique with
Etoricoxib and Thiocolchicoside: In vivo Evaluation and Comparison with Marketed Formulation," Advances in
Pharmacology and Pharmacy, Vol. 10, No. 2, pp. 104 - 113, 2022. DOI: 10.13189/app.2022.100204.
(b): Hemanth Annepogu, Hindustan Abdul Ahad (2022). Unique Solid Dispersions by Microwave Fusion Technique
with Etoricoxib and Thiocolchicoside: In vivo Evaluation and Comparison with Marketed Formulation. Advances in
Pharmacology and Pharmacy, 10(2), 104 - 113. DOI: 10.13189/app.2022.100204.
Copyright©2022 by authors, all rights reserved. Authors agree that this article remains permanently open access under the
terms of the Creative Commons Attribution License 4.0 International License

Abstract        Aim: The primary objective of the study is to   Keywords        Solid Dispersions, Microwave Fusion, In
evaluate solid dispersion (SDs) made into tablets               vivo, Bioavailability, Rabbits
containing Etoricoxib (ECB) and Thiocolchicoside (TCS)
for different in vivo parameters and in vitro drug release as
an extension of the work described by Annepogu et al., in
2018. Methods: The in vitro study was constructed on
various evaluation parameters of SDs of ECB and TCS.            1. Introduction
From earlier study results, we have selected formula-5 SDs
of ECB and TCS for in-vivo study and comparison with               Formulation experts in industries do plenty of trials to
marketed ones. Results: Plasma drug availability was            improve poorly soluble drugs economically [1]. Among the
performed on 6 healthy rabbits of both sexes (weighing          innumerable tactics for augmenting solubility, the solid
2.0-2.5 kg). They were aimlessly alienated into 2 groups of     dispersion (SDs) methodology [2] is ahead of all as it is
alike size by parallel design. Later, the study was HPLC        meeker and entails fewer struggles than the other tactics
analysis of the drug in the plasma, which involved              [3].
preparation of the spiked plasma sample, and an analytical         Etoricoxib (ECB) is a Non-Steroidal Anti Inflammatory
technique was established (simple and cost-effective            Drug (NSAID) used to tackle all the diversities of pain and
method for ECB and TCS simultaneous estimation). The            arthritic tenderness [4]. ECB is poorly water-soluble with
plasma samples were assessed for pharmacokinetic                92% binding to protein [5] and poor bioavailability [6].
parameters. Finally, the F-5 formulation was assessed for       Thiocolchicoside (TCS) is a colchicoside derivative of
in vitro drug release by comparison with the marketed           Gloriosa superba and Colchicum autumnale [7]. TCS is a
preparation (Recox tablets-Hochest Biotech India).              muscle relaxant used to challenge sore muscle reductions
Conclusion: The study summarizes that TCS and ECB               [8], acute and arthritic glitches [9], and pains [10], and it is
reached systemic circulation better than the pure drugs, and    devoid of sedative issues [11] compared with other muscle
the kinetic values were appreciable. The drug discharge         relaxants. It can be co-administered with many NSAIDs.
from the SDs was identical to the marketed one.                 TCS is a yellow crystalline powder that is merely soluble in
Advances in Pharmacology and Pharmacy 10(2): 104-113, 2022 105
ethanol and poorly in water [12]. Ethics Committee (SJC/2017/COL-16R) ratified by
The old style of making SDs is by fusion [13], in which CPCSEA (1561/PO/RE/S/11/CPCSEA) for performing
the polymer carriers used for SDs are not open to uniform animal experiments.
heat from the heat source [14]. To overwhelm this, an
innovative microwave (MW) melting procedure was In vitro Study
adopted as described by Annepogu et al., [17].
Electromagnetic irradiation was pragmatic in an MW oven The dissolution conditions of SDs of ECB and TCS were
with 0.3 to 300 GHz of infrared and radio frequencies [15] performed using a USP-II dissolution apparatus (Lab
at wavelengths of 1 mm to 1 m. This practice can be India Instruments, India) with a paddle speed of 100 rpm
assumed for procurement of fast and incessant heating even using 0.1M HCl as a dissolution medium at 37±0.5°C. At
in materials bestowing low heat conductivity (e.g., frequent intervals of every 10 minutes till 1h, a sample of
polymers) because the movement of energy is not 5 mL was withdrawn (sink conditions were maintained),
contingent on heat diffusion [16]. Thus, this innovative filtered (0.45µ nylon disc filter) and absorbance was
MW melting process was assumed in the planning of SDs. measured at 25.2 nm (isobestic point for ECCB and TCS)
Much research has been accomplished on augmenting the using a UV-Visible spectrophotometer and the amount of
solubility of drugs using PEG 8000, PVP K-30 and P188. drug released was read from calibration curves.
Therefore, it is important to enhance the solubility of
ECB and TCS, with faster discharge, absorption, and In vivo Study
exploitation to relieve acute patients. It also helps to find
out what proportions are effective in augmenting the The in vivo studies on various evaluation parameters
solubility of drugs. The ratios of drugs and excipients were were achieved as designated by Sharma et al., [18]. We
as per table 1. have selected formula-5 SDs (F-5) for in vivo study.
Table 1. Drug poly blend ratios in solid dispersions In vivo Bioavailability Study
Drug: Carrier
Drug: Carrier Formulation 6 white New Zealand rabbits of any gender (weighing
ratio code 2.0-2.5 kg) were haphazardly alienated into 2 groups of
1:1 F-1 identical size by parallel design. The work was agreed to
match the pharmacokinetics of ECB and TCS from
1:2 F-2
selected SDs (F-5) containing 90 mg of ECB and 4 mg of
ECB+ TCS: carrier 1:3 F-3 TCS. Food was taken off 10±1 h prior to the in vivo study,
blend* 1:4 F-4 with water ad libitum. Group A of rabbits orally received
SDs (F-5), whereas group B received pure drug suspension
1:5 F-5
in water [19]. Blood samples (2 mL) were collected into
1:6 F-6 heparinized tubes at 0, 0.5, 1, 2, 4, 6, and 8 h after
ECB- Etoricoxib; TCS- Thiocolchicoside;
administration of the treatment. The plasma was detached
from the heparinized whole blood by centrifugation at
Carrier blend* contains an equal mixture of PEG 8000+PVP K-30+P188
4,000 rpm for 15 min [20]. After parting, plasma samples
Among all the above formulations, F-5 possesses all the were immediately transferred to Eppendorf tubes and
characteristics of an ideal solid dispersion like improved stored at -20°C until analysis.
solubility, good physicochemical/ flow properties, in vitro Plasma concentration of drug was dogged by HPLC
drug discharge, and uniformity in their contents as analysis [21] and the following steps were used for HPLC
described by Annepogu et al., [17]. So, F-5 was subjected analysis.
to in vivo trials.
Estimation of ECB and TCS in serum samples
ECB and TCS in serum samples were estimated
2. Materials and Methods according to the High-Performance Liquid
Chromatographic (HPLC) process [22, 23].
Materials
Acetonitrile and o-Phosphoric acid and triple glass Instrument Conditions
distilled water (HPLC grade) were delivered by Merck The instrument (HPLC) was used for the study. The
chemicals and other chemicals were of analytical grade. conditions were submitted as supplementary files.
The New Zealand Wistar rabbits for the in vivo study were
from Krishna Rabbit Farms, Bengaluru. The in vivo study
Preparation of standard solution and plotting of
was steered in harmony with animal ethical guidelines for
correction curves
investigations in the laboratory.
An approval was taken from the Institutional Animal The procedure adopted was as established by Pushparaj106 Unique Solid Dispersions by Microwave Fusion Technique with Etoricoxib and
Thiocolchicoside: In vivo Evaluation and Comparison with Marketed Formulation
et al., 2017 with little modification [24]. Weighed [AUC]8-∞ = Concentration at 8thh / Kel (1)
accurately 90 mg of ECB (for stock solution A) and 4 mg Then [AUC] 0-∞ = [AUC] h + [AUC] h (2)
0–8 8– ∞
of TCS (for stock solution B) and transferred to a 100 mL
volumetric flask, dissolved using the mobile phase with the In Vivo investigation protocol
aid of sonication, and final volume was made with the
mobile phase. From these stock solutions, working Calculation of Animal Equivalent Dose from Human Dose
standard solutions were prepared with suitable dilution To calculate animal equivalent dose (AED) using human
with mobile phase to get concentrations of 5-40 µg of ECB dose [32-34] by eq.3 was employed.
and 0.5 to 4 µg of TCS.
0.33
(3)
Preparation of the spiked plasma sample
Using the above equation, considering the average
This was performed by using the procedure explained by human weight of 70 kg, animal equivalent dose
Bhothra et al., 2018 [25]. 250µl of rabbit plasma, 50 µL of calculations were carried out. Human dose of Drugs in mg:
internal standard, 10 µL of ECB and 10 µL of TCS were ECB (90 mg) and TCS (4 mg). Calculated Animal
pipetted into a 10 mL centrifuge tube and to this 2 mL of Equivalent Dose (AED): ECB (3.98 mg) and TCS (0.18 mg)
Acetonitrile was added. A 10 μL of the supernatant layer per kg body weight of the animal.
was collected (after centrifugation at 3200 rpm for 10min)
and injected into HPLC. A typical chromatogram is Treatment of Animals
achieved from a sample solution. Healthy rabbits of either sex were fasted overnight. ECB
and its SDs were administered at a dose equivalent to 3.98
Process development mg/kg of ECB. TCS and its SDs were administered at a
The mobile phase used was a 70:30 (v/v) mixture of dose equivalent to 0.18 mg/kg of TCS. Each product was
freshly prepared buffer 0.1% o-Phosphoric acid and repeated 4 times (n = 4). The in vivo experiments were
Acetonitrile, which indicated an effective mixture used for accompanied by a crossover investigation. The treatment
the parting. Then, the flow rate tested was 0.4, 0.8, 1.0, 1.2, and sampling intervals are revealed in fig.1.
and 1.5 mL/min. 1.0 mL/min was selected for the
determination of ECB and TCS as it has better resolution of
the peaks. The stated chromatographic situations were the
best to deliver resolution between ECB and TCS at a
reasonable time of 4.912 and 2.805 min respectively at the
optimum wavelength for detection was 220 nm and no
native nosey composites eluted at the retention times of
ECB and TCS.
Determination of various pharmacokinetic
parameters:
From the time versus serum concentration facts,
numerous pharmacokinetic parameters such as peak
concentration (Cmax), time at which drug peaks (tmax), area
under the curve (AUC), elimination rate constant Kel,
biological half-life (t½), %absorbed at various times, and
absorption rate constant (Ka) [26] were calculated in each
case. The peak serum concentration (Cmax) and time at peak
attained (tmax) were strong minded [27,28] with the help of
correction curves. The serum concentration and time
values were plotted on a semi-logarithmic graph paper. The Figure 1. Treatment and sampling intervals for in vivo studies
Kel was calculated from the slope of the linear line in the
elimination phase (the best fit linear regression line for the The blood samples (0.5mL) were taken from the
points in the elimination phase was haggard by the process marginal ear veins of rabbits. The blood samples were
of fewest squares) [29]. The consistent t½ was indorsed to clot and centrifuged at 5000 rpm and the serum
premeditated with the equation t1/2 = 0.693/Kel. %absorbed disjointed was unruffled into dry tubes. All the samples
at various times and Ka was calculated [30] from serum were stored under refrigerated conditions before the assay.
concentration facts by the Wagner and Nelson equation. The serum concentration of the drugs (ECB & TCS) was
The AUC was resolute by using the trapezoidal rule. The resolute by the HPLC process. Various pharmacokinetic
remaining area from 8 h to ∞ time was calculated [31] parameters were calculated in each case based on the time
using the following eq. 1 and 2. vs. serum concentration facts [35].Advances in Pharmacology and Pharmacy 10(2): 104-113, 2022 107
3. Results and Discussion
Results of calibration curves and isobestic point
The standard correction curve of the ECB was revealed in fig. 2. The standard correction curve of TCS is revealed in fig.
3.
Figure 2. Correction curve for the estimation of ECB in serum by HPLC
Figure 3. Correction curve for the estimation of TCS in serum by HPLC108 Unique Solid Dispersions by Microwave Fusion Technique with Etoricoxib and
Thiocolchicoside: In vivo Evaluation and Comparison with Marketed Formulation
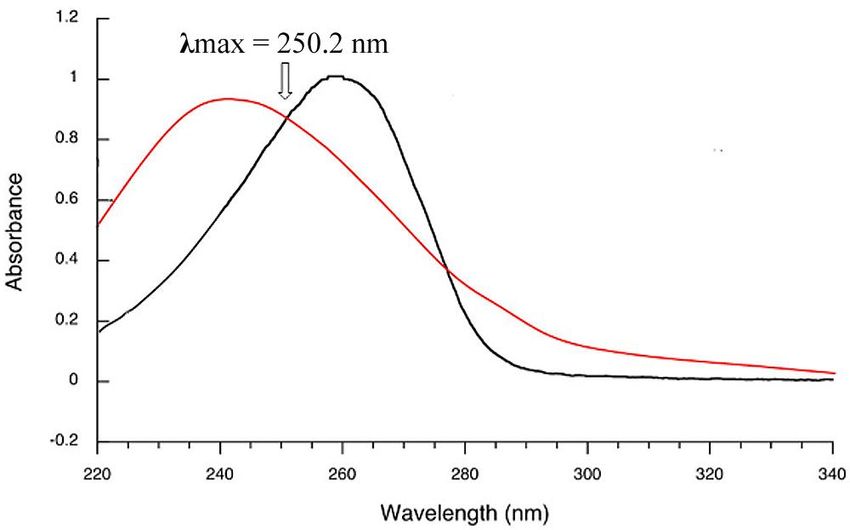
Figure 4. A UV-Overly spectrum of ECB and TCS
Figure 5. HPLC chromatogram of serum sample (F-5)
An overlay spectrum of ECB and TCS indicated λ max at The HPLC conditions for a simultaneous guesstimate of
250.2 nm. The Simultaneous approximation of ECB and ECB and TCS were revealed in table 2. The chromatogram
TCS was done by RP-HPLC. The retention time of ECB of the serum sample was revealed in fig.5. The regression
was found to be 4.912 min and 2.805 min for TCS and the equation was found to be 24841x+13613 for ECB and
asymmetric factor was within limits. The UV-Overly 9219.x+377.8 for TCS with a correlation of 0.999 for both.
spectrum of ECB and TCS was revealed in fig. 4. The asymmetric values for ECB and TCS were observed to
be 1.62 and 1.35 respectively. The description of the HPLC
Simultaneous estimation of ECB and TCS by graph and statistical facts about the HPLC chromatogram
RP-HPLC were revealed in tables 3 and 4. The concentration of ECBAdvances in Pharmacology and Pharmacy 10(2): 104-113, 2022 109
in serum with pure ECB and SDs (F-5) after oral Table 3. Description of the HPLC graph
administration was revealed in fig.6. The concentration of Retention Asymmetric
Name Peak Area
TCS in serum with pure TCS and SDs (F-5) after oral Time (min) factor
administration was represented in fig. 7. The
ECB 4.912 1037568 1.62
pharmacokinetic parameters estimated with ECB/TCS and
its SDs (F-5) in serum after oral administration were TCS 2.805 37281 1.35
revealed in table 5.
Table 4. Statistical facts of HPLC chromatogram
Table 2. Instrument (HPLC) Conditions for simultaneous estimation of
ECB and TCS
Parameters ECB TCS
Parameter Chromatographic condition Linearity (μg/mL) 10 – 60 1–6
Instrument Shimadzu y= y=
Regression equation
24841x+13613 9219.x+377.8
Chemstation/ Software LC Solutions
Phenomenex Luna C18 Correlation coefficient 0.999 0.999
Column
(250x4.6 mm; 5μ) Slope 24841 9219
Water (0.1% o-Phosphoric acid) Intercept 13613 377.8
Mobile phase
and Acetonitrile (70:30 v/v)
Limit of Detection (μg/mL) 1.76 0.24
Wavelength (nm) 250.2
Limit of Quantification
Flow rate (mL/min) 9.0 5.35 0.72
(μg/mL)
Run time (min) 7.0 Values in mean ±SD; trials made (n=3)
Figure 6. Serum concentration of ECB and its SDs (F-5) in rabbits (p.o)110 Unique Solid Dispersions by Microwave Fusion Technique with Etoricoxib and
Thiocolchicoside: In vivo Evaluation and Comparison with Marketed Formulation
Figure 7. Serum concentration of TCS and its SDs (F-5) in rabbits (p.o)
Table 5. Pharmacokinetic parameters estimated with ECB/ and its SDs (F-5) in serum when administered orally
Pharmacokinetic Concentration of ECB in Serum Concentration of TCS in Serum
parameter ECB SDs (F-5) TCS SDs (F-5)
Cmax (µg/mL) 11.260±0.62 061.370±1.35 09.840±0.23 041.260±1.28
Tmax (h) 02.000±0.00 002.000±0.00 02.000±0.00 002.000±0.00
-1
Kel(h ) 00.126±0.01 000.205±0.01 01.223±0.05 000.135±0.01
1/2
T (h) 02.451±0.05 003.380±0.09 01.573±0.03 001.648±0.05
0-8
(AUC) (µg.h/mL) 57.408±2.48 283.705±5.65 36.433±1.28 148.167±5.26
0-∞
(AUC) (µg.h/mL) 60.530±5.95 295.085±6.59 37.453±0.97 152.317±4.95
-1
Ka(h ) 00.506±0.02 001.710±0.03 01.938±0.06 001.746±0.09
Values in mean ±SD; trials made (n=3)
After a single dose of design F-5 (ECB: 3.98 mg/kg and folds more than ECB and ~4 times more than TCS. These
0.18 mg/kg of TCS), the symmetrical mean C max values of fallouts suggest that the absorption rate and bioavailability
design F-5 (61.37±1.35 µg/mL for ECB and 41.260±1.28 of SD design F-5 are remarkably quicker and greater than
µg/mL for TCS), were higher than those of pure drugs that of pure drugs. In vivo animal trials in rabbits revealed
{ECB (PAdvances in Pharmacology and Pharmacy 10(2): 104-113, 2022 111
Figure 8. Comparison of in vitro drug dissolution of optimized design (F-5) with the marketed sample
4. Conclusions Authors Contribution
A combination of Etoricoxib (ECB) and Hemanth Annepogu performed the work, and Hindustan
Thiocolchicoside (TCS) was prepared as solid dispersions Abdul Ahad reviewed, revised, and arranged the work as
(SDs). The best design (among F-1 to F-6) i.e., F-5, was per the journal format.
subjected to in vivo studies in rabbits. The simultaneous
appraisal of ECB and TCS was urbanized by RP-HPLC. In
vivo animal trials in rabbits revealed good levels of ECB
and TCS in serum associated with pure ECB and TCS. The
pharmacokinetic parameters, viz., Cmax, AUC were REFERENCES
enriched relative to pure ECB/TCS drug. The drug [1] Annepogu H, Hindustan Abdul AH, Nayakanti D.
reaching the systemic circulation from the SDs was quicker Determining the Best Poloxamer Carrier for
and appreciable than the pure drugs. Thiocolchicoside Solid Dispersions. Turkish Journal of
Pharmaceutical Sciences. 2020 Aug;17(4):372.
[2] Dhirendra K, Lewis S, Udupa N, Atin K. Solid dispersions: a
Abbreviations review. Pakistan journal of pharmaceutical sciences. 2009
Apr 1;22(2).
ECB- Etoricoxib
[3] Jwalapuram R, Ahad HA, Haranath C, Thadipatri R,
TCS- Thiocolchicoside Varshitha CV, Kumar YB. A desktop reference to the
NSAID- Non-Steroidal Anti-Inflammatory Drugs solubility enhancement of drugs with the aid of surfactants.
SDs- Solid Dispersions (2020). Int. J. Life Sci. Pharma Res.;11(5): P11-16.
MW- Microwave
[4] Theodoridou A, Gika H, Diza E, Garyfallos A, Settas L. In
AUC- Area Under Curve vivo study of the synovial membrane penetration index from
AED- Animal Equivalent Dose celecoxib and etoricoxib and their impact on pain control in
patients with inflammatory arthritis. Mediterranean Journal
of Rheumatology. 2016;27(1).
Acknowledgements [5] Seal P, Sikdar J, Ghosh N, Biswas P, Haldar R. Exploring the
The authors are thankful to the college management for binding dynamics of etoricoxib with human hemoglobin: A
spectroscopic, calorimetric, and molecular modeling
providing the facilities for performing this research work. approach. Journal of Biomolecular Structure and Dynamics.
2019 Jul 24;37(11):3018-28.
Declaration of Competing Interest [6] Chandok N, Watt KD. Pain management in the cirrhotic
patient: the clinical challenge. InMayo Clinic Proceedings
The author declared no conflict of interest. 2010 May 1 (Vol. 85, No. 5, pp. 451-458). Elsevier.112 Unique Solid Dispersions by Microwave Fusion Technique with Etoricoxib and
Thiocolchicoside: In vivo Evaluation and Comparison with Marketed Formulation
[7] Jana S, Shekhawat GS. Critical review on medicinally potent Influence of a niosomal formulation on the oral
plant species: Gloriosa superba. Fitoterapia. 2011 Apr bioavailability of acyclovir in rabbits. AAPS PharmSciTech,
1;82(3):293-301. 2007; 8(4), 206-212.
[8] Umarkar AR, Bavaskar SR, Yewale PN. Thiocolchicoside as [21] Almeida, A., Campos, D., Bernasconi, G., Calafatti, S.,
muscle relaxant: a review. History. 2011;8(9):11-2. Barros, F., Eberlin, M., . .Pedrazzoli, J. Determination of
memantine in human plasma by liquid chromatography–
[9] Paradkar M, Vaghela S. Thiocolchicoside Niosomal Gel electrospray tandem mass spectrometry: Application to a
Formulation for the Pain Management of Rheumatoid bioequivalence study. Journal of Chromatography B, 2007;
Arthritis through Topical Drug Delivery. Drug Delivery 848(2), 311-316.
Letters. 2018 Aug 1;8(2):159-68.
[22] Andraws, G., & Trefi, S. Ionisable substances
[10] Tüzün F, Ünalan H, Öner N, Özgüzel H, Kirazli Y, chromatography: A new approach for the determination of
İçağasioğlu A, Kuran B, Tüzün Ş, Başar G. Multicenter, Ketoprofen, Etoricoxib, and Diclofenac sodium in
randomized, double-blinded, placebo-controlled trial of pharmaceuticals using ion–pair HPLC. Heliyon, 2020; 6(8),
thiocolchicoside in acute low back pain. Joint Bone Spine. e04613.
2003 Sep 1;70(5):356-61.
[23] Attimarad, M., Ahmed, K. M., Aldhubaib, B. E., & Harsha, S.
[11] Aksoy C, Karan A, Dıraçoğlu D. Low back pain: results of an High-performance thin layer chromatography: A powerful
open clinical trial comparing the standard treatment alone to analytical technique in pharmaceutical drug discovery.
the combination of standard treatment and thiocolchicoside. Pharmaceutical methods, 2011; 2(2), 71-75.
Journal of Orthopaedics and Traumatology. 2002 Dec
1;3(2):103-8. [24] Pushparaj, M. Simultaneous Estimation of Etoricoxib and
Serratiopeptidase by RP-HPLC Method. Cherraan’s College
[12] Artusi M, Nicoli S, Colombo P, Bettini R, Sacchi A, Santi P. of Pharmacy, Coimbatore. 2017.
Effect of chemical enhancers and iontophoresis on
thiocolchicoside permeation across rabbit and human skin in [25] Bothra, S., Babu, L. T., Paira, P., Kumar, S. A., Kumar, R., &
vitro. Journal of pharmaceutical sciences. 2004 Oct Sahoo, S. K. A biomimetic approach to conjugate vitamin B
1;93(10):2431-8. 6 cofactor with the lysozyme cocooned fluorescent AuNCs
and its application in turn-on sensing of zinc (II) in
[13] DiNunzio JC, Brough C, Hughey JR, Miller DA, Williams environmental and biological samples. Analytical and
III RO, McGinity JW. Fusion production of solid dispersions bioanalytical chemistry, 2018; 410(1), 201-210.
containing a heat-sensitive active ingredient by hot melt
extrusion and Kinetisol® dispersing. European journal of [26] Liu, L., Yin, X., Wang, X., & Li, X. Determination of
pharmaceutics and biopharmaceutics. 2010 Feb dihydromyricetin in rat plasma by LC-MS/MS and its
1;74(2):340-51. application to a pharmacokinetic study. Pharmaceutical
biology, 2017; 55(1), 657-662.
[14] Serajuddin AT. Solid dispersion of poorly water‐soluble
drugs: Early promises, subsequent problems, and recent [27] Moussa, B. A., Mahrouse, M. A., & Fawzy, M. G. A
breakthroughs. Journal of pharmaceutical sciences. 1999 validated LC-MS/MS method for simultaneous
Oct;88(10):1058-66. determination of linagliptin and metformin in spiked human
plasma coupled with solid phase extraction: Application to a
[15] Maurya D, Belgamwar V, Tekade A. Microwave induced pharmacokinetic study in healthy volunteers. Journal of
solubility enhancement of poorly water soluble atorvastatin Pharmaceutical and Biomedical Analysis, 2019; 163,
calcium. Journal of Pharmacy and Pharmacology. 2010 153-161.
Nov;62(11):1599-606.
[28] Kumar, T. R., Shitut, N. R., Kumar, P. K., Vinu, M. C.,
[16] Zawar LR, Bari SB. Preparation, characterization and in vivo Kumar, V. V. P., Mullangi, R., & Srinivas, N. R.
evaluation of antihyperglycemic activity of microwave Determination of rosuvastatin in rat plasma by HPLC:
generated repaglinide solid dispersion. Chemical and validation and its application to pharmacokinetic studies.
Pharmaceutical Bulletin. 2012 Apr 1;60(4):482-7. Biomedical Chromatography, 2006; 20(9), 881-887.
[17] Hemanth A., Ahad, H. A., Nayakanti, D., & Ahad, H. A. [29] Weaver, R., & Riley, R. J. Identification and reduction of ion
Appraising Best Poly Ethylene Glycol Carrier for suppression effects on pharmacokinetic parameters by
Thiocolchicoside Solid Dispersions. Journal of polyethylene glycol 400. Rapid Communications in Mass
Pharmaceutical, Chemical and Biological Sciences. 2018, Spectrometry: An International Journal Devoted to the Rapid
6(4):355-364 Dissemination of Up‐to‐the‐Minute Research in Mass
Spectrometry, 2006; 20(17), 2559-2564.
[18] Patra, S., Roy, E., Karfa, P., Kumar, S., Madhuri, R., &
Sharma, P. K. Dual-responsive polymer coated [30] Lin, H. S., Yue, B. D., & Ho, P. C. Determination of
superparamagnetic nanoparticle for targeted drug delivery pterostilbene in rat plasma by a simple HPLC‐UV method
and hyperthermia treatment. ACS applied materials & and its application in pre‐clinical pharmacokinetic study.
interfaces, 2015; 7(17), 9235-9246. Biomedical Chromatography, 2009; 23(12), 1308-1315.
[19] Fernandes, C. M., Ramos, P., Falcao, A. C., & Veiga, F. J. B. [31] Hokama, N., Hobara, N., Kameya, H., Ohshiro, S., &
Hydrophilic and hydrophobic cyclodextrins in a new Sakanashi, M. Rapid and simple micro-determination of
sustained release oral formulation of nicardipine: in vitro carvedilol in rat plasma by high-performance liquid
evaluation and bioavailability studies in rabbits. Journal of chromatography. Journal of Chromatography B: Biomedical
controlled release, 2003; 88(1), 127-134 Sciences and Applications, 1999; 732(1), 233-238.
[20] Attia, I. A., El-Gizawy, S. A., Fouda, M. A., & Donia, A. M. [32] Zeeb, M., Farahani, H., & Papan, M. K. Determination ofAdvances in Pharmacology and Pharmacy 10(2): 104-113, 2022 113
atenolol in human plasma using ionic ‐ liquid ‐ based clinical pharmacy, 2016; 7(2), 27.
ultrasound ‐ assisted in situ solvent formation
microextraction followed by high ‐ performance liquid [34] Reagan‐Shaw, S., Nihal, M., & Ahmad, N. Dose translation
chromatography. Journal of separation science, 2016; 39(11), from animal to human studies revisited. The FASEB journal,
2138-2145. 2008; 22(3), 659-661.
[33] Nair, A. B., & Jacob, S. A simple practice guide for dose [35] Shin, J.-W., Seol, I.-C., & Son, C.-G. Interpretation of animal
conversion between animals and human. Journal of basic and dose and human equivalent dose for drug development. The
Journal of Korean Medicine, 2010; 31(3), 1-7.You can also read