Opposite correlation of 25 hydroxy vitamin D and 1,25 dihydroxy vitamin D metabolites with gestational age, bone and lipid biomarkers in ...
←
→
Page content transcription
If your browser does not render page correctly, please read the page content below
www.nature.com/scientificreports

                OPEN             Opposite correlation
                                 of 25‑hydroxy‑vitamin D‑
                                 and 1,25‑dihydroxy‑vitamin
                                 D‑metabolites with gestational
                                 age, bone‑ and lipid‑biomarkers
                                 in pregnant women
                                 Oleg Tsuprykov1,2, Saban Elitok2, Claudia Buse2,3, Chang Chu2, Bernhard Karl Krämer2 &
                                 Berthold Hocher2,4,5,6*

                                 25-Hydroxyvitamin D (25OHD) and 1,25-dihydroxyvitamin D (1,25(OH)2D) need to be bound to
                                 carrier proteins to be transported to their target cells. The majority of either 25OHD or 1,25(OH)2D
                                 is bound to vitamin D-binding protein (DBP), a smaller fraction is bound to albumin and only very
                                 small amounts of 25OHD or 1,25(OH)2D are free. Albumin-bound 25OHD or 1,25(OH)2D is relatively
                                 easily available after dissociation from albumin. Thus, the sum of free and albumin-bound forms is
                                 called bioavailable 25OHD and bioavailable 1,25(OH)2D. Total 25OHD and 1,25(OH)2D are defined as
                                 the sum of free, albumin-bound and DBP-bound 25OHD and 1,25(OH)2D, respectively. This cross-
                                 sectional study in 427 pregnant women compared the correlation of the six vitamin D compounds
                                 with biomarkers of bone health, lipid metabolism, kidney function, endocrine parameters, and group
                                 B water-soluble vitamins. Among the 25OHD metabolites analysed, total 1,25(OH)2D showed clearly
                                 the best correlation with calcium, bone-specific alkaline phosphatase, adiponectin, LDL, HDL, urea,
                                 thyroxine, and group B water-soluble vitamins. When comparing the three 25OHD metabolites, both
                                 free 25OHD and bioavailable 25OHD showed overall good correlations with calcium, bone-specific
                                 alkaline phosphatase, adiponectin, LDL, HDL, urea, thyroxine, triiodothyronine, and group B water-
                                 soluble vitamins, The correlations of 1,25(OH)2D and 25OHD metabolites went always in opposite
                                 directions. Only PTH correlates always inversely with all six vitamin D compounds. In conclusion,
                                 free 25(OH)D and bioavailable 25(OH)D are more precise determinants of the vitamin D status than
                                 total 25(OH)D in normal pregnancy, whereas total 1,25(OH)2D is superior to free and bioavailable
                                 1,25(OH)2D. Except for PTH, correlations of 25(OH)D and 1,25(OH)2D metabolites with typical clinical
                                 chemistry readouts go in opposite directions.

                                 Abbreviations
                                 125(OH)2D	1,25-Dihydroxyvitamin D
                                 25OHD	25-Hydroxyvitamin D
                                 ANOVA	Analysis of variance
                                 B25OHD	Bioavailable 25-hydroxyvitamin D
                                 B125(OH)2D	Bioavailable 1,25-dihydroxyvitamin D
                                 BSAP	Bone-specific alkaline phosphatase

                                 1
                                  Institute for Laboratory Medicine, IFLB, Berlin, Germany. 2Fifth Department of Medicine
                                 (Nephrology/Endocrinology/Rheumatology), University Medical Centre Mannheim, University of Heidelberg,
                                 Heidelberg, Germany. 3LADR GmbH, MVZ Berlin, Berlin, Germany. 4Key Laboratory of Study and Discovery of Small
                                 Targeted Molecules of Hunan Province, Department of Pharmacy, School of Medicine, Hunan Normal University,
                                 Changsha, Hunan, China. 5Reproductive and Genetic Hospital of CITIC-Xiangya, Changsha, China. 6Institute of
                                 Medical Diagnostics, IMD Berlin, Berlin, Germany. *email: berthold.hocher@medma.uni‑heidelberg.de

Scientific Reports |   (2021) 11:1923               | https://doi.org/10.1038/s41598-021-81452-9                                            1

                                                                                                                                        Vol.:(0123456789)
www.nature.com/scientificreports/
CE Conformité Européene
DBP Vitamin D-binding protein
ELISA Enzyme-linked immunosorbent assay
F25OHD Free 25-hydroxyvitamin D
F125(OH)2D Free 1,25-dihydroxyvitamin D
fT3 Free triiodothyronine
fT4 Free thyroxine
HDL High-density lipoprotein cholesterol
IVD In-Vitro-Diagnostic Medical Device
LC–MS/MS Liquid chromatography–tandem mass spectrometry
LDL Low-density lipoprotein cholesterol
MCH Mean corpuscular hemoglobin
MCHC Mean corpuscular hemoglobin concentration
MCV Mean corpuscular volume of red blood cells
PTH Parathyroid hormone
RBC Red blood cell
RDW Red blood cell distribution width
SD Standard deviation
T25OHD Total 25-hydroxyvitamin D
T125(OH)2D Total 1,25-dihydroxyvitamin D
VDR Vitamin D receptor
WBC White blood cell
Both 25OHD and 1,25(OH)2D, being lipophilic molecules, have a special carrying protein, enabling their trans-
port in the circulation, protection from hepatic degradation and accumulation of circulating reserves, called
vitamin D-binding protein (DBP). In the serum, 85–90% of the whole 25OHD/1,25(OH)2D pool is present in the
DBP-bound condition. The remaining 10–15% are loosely bound to serum albumin and lipoproteins (10–15%),
and just a tiny fraction of 25OHD/1,25(OH)2D (less than 0.1% of 25OHD and about 0.4% of 1,25(OH)2D1,2) is
available in the free, unbound condition. Thus, from this point of view, the terminology “total 25OHD” “total
1,25(OH)2D”, which will be used throughout this manuscript, refers to a sum of three 25OHD/1,25(OH)2D frac-
tions: DBP-bound, albumin-bound (the latter fraction is also called bioavailable, since this binding is very weak
and spontaneous dissociation of vitamin D metabolites from albumin is very easy to occur), and free compounds.
Since serum levels of liver-produced DBP is subject to substantiate changes under numerous physiologic and
pathologic conditions (genetic background, endocrine status in particular with regards to estrogens, liver diseases
and kidney diseases), the values of total 25OHD—the current gold standard vitamin D status marker—might not
precisely clarify the status of vitamin D, particularly in such conditions as normal pregnancy, estrogen-containing
oral contraceptive intake, as well as liver and renal pathologies.
Since the mid-1980s it is known that free 25OHD/1,25(OH)2D determination is possible based on the laws of
protein–ligand binding kinetics using a formula employing serum concentrations of total 25OHD, DBP, albumin,
as well as 25OHD/1,25(OH)2D-DBP and 25OHD/1,25(OH)2D-albumin binding affinity constants, which was
originally suggested by Bikle et al.3.
The present study was designed to perform for the first time a systematic head-to-head comparison of three
ways of measuring 25-hydroxyvitamin D (free, bioactive, ant total 25OHD) with three ways to measure 1,25-dihy-
droxyvitamin D (free, bioactive, ant total 1,25(OH)2D) using pregnant women as a test system, because vitamin
D binding protein is incresed in this population.
Materials and methods
Study population. The study was a part of the Berlin Birth Cohort (BBC) s tudy4,5. This study was approved
by the local ethical committee of the Charité—Universitätsmedizin Berlin, Campus Mitte, Berlin, Germany and
written informed consent was obtained from all participants. The study cohort consisted of 427 Caucasian preg-
nant healthy women aged > 18 years. All methods were carried out in accordance with relevant German guide-
lines and regulations.
The study participants were categorized into three trimester groups according to their gestational age: the 1st
trimester (≤ 12 weeks + 6 days), the 2nd trimester (13 weeks–27 weeks + 6 days), and the 3rd trimester (≥ 28 weeks
until delivery). The mean gestational age of the entire study cohort was 18.49 weeks (n = 427). The group sizes
were 211, 78, and 135 participants in 1st, 2nd, and 3rd pregnancy trimesters, respectively.
The study was carried out at clinical laboratory medical institution in Berlin, Germany. Venous blood samples
were collected in the period from May till June 2016. The study was approved by the local ethics committee.
Measurement of 25OHD and 1,25(OH)2D metabolites, DBP, and albumin. All analytes were
measured in serum samples. Total 25OHD (hereafter “25OHD” is referred to as a sum of 25OHD2 and 25OHD3
metabolites) was measured by Abbott Architect i2000 (Abbott Laboratories, Wiesbaden, Germany) using
Abbott Architect 25OHD automated chemiluminescent microparticle immunoassay (Abbott Laboratories,
Wiesbaden, Germany). As declared by the assay manufacturer, the kit has the following cross-reactivities with
vitamin D metabolites: 98.6–101.1% with 2 5OHD3, 54.0% with 2 5OHD2, 101.9–189.2% with 24,25OH2D3,
71.4–114.2% with 24,25OH2D2, and < 1% with other vitamin D forms (vitamin D3, vitamin D2, 1,25(OH)2D3,
and 1,25(OH)2D2). Total 1,25(OH)2D (hereafter “1,25(OH)2D” is referred to as a sum of 1,25(OH)2D2 and
1,25(OH)2D3 metabolites) was determined using IDS-iSYS 1,25 VitDXP chemiluminescence-immunoassay on
Scientific Reports | (2021) 11:1923 | https://doi.org/10.1038/s41598-021-81452-9 2
Vol:.(1234567890)www.nature.com/scientificreports/
the IDS-iSYS Multi-Discipline Automated system (both by IDS Immunodiagnostic Systems GmbH, Frankfurt
am Main, Germany). According to the manufacturer’s data sheet, this assay has the following cross-reactivities
with 1,25(OH)2D metabolites: 97% with 1,25(OH)2D3, 72% with 1,25(OH)2D2, 106.7% with 1,24,25OH3D3,
and < 1% with other vitamin D metabolites. Serum DBP was determined by a polyclonal antibody immunoas-
say (Immundiagnostik AG, Bensheim, Germany). Serum albumin was assessed using an automated analyzer
(Beckman Coulter Inc., Krefeld, Germany). Regarding the quality control in total 25OHD, total 1,25(OH)2D
and albumin measurement, our lab constantly fulfill the requirements of the round robin tests organized by the
Reference Institute for Bioanalytics (RfB)—one of the two German proficiency testing organizations which have
been officially charged by the German Medical Association, in which our lab participates regularly. Regarding
DBP, this analyte does not belong to the list of routine clinical biomarkers and was measured exclusively for the
present study. However, this kit is IVD- (“In-Vitro-Diagnostic Medical Device”) and CE- (“Conformité Euro-
péene”) certified, which means that it can be used in-vitro for the examination of specimens, including blood-
and tissue donations, derived from the human body within the European Economic Area.
Free 25OHD was measured based on the laws of protein–ligand binding kinetics by calculation method
using a formula employing serum concentrations of total 25OHD, DBP, albumin, as well as 25OHD-DBP and
25OHD-albumin binding affinity constants, which was originaly suggested by Bikle et al.6:
Total 25(OH)D
Free 25(OH)D =
1 + Kalb × albumin + KDBP × DBP
where Free 25OHD = concentration of free 25OHD in mol/L; K alb = affinity constant between 25OHD and albu-
min equal to 6 × 10⁵ M−1; KDBP = affinity constant between 25OHD and DBP, equal to 7 × 10⁸ M−16,7; albumin = con-
centration of total serum albumin in mol/L; DBP = concentration of total vitamin D-binding protein in mol/L;
Total 25OHD = concentration of total 25OHD in mol/L.
Utilizing exactly the same principle, but using 1,25(OH) 2D-specific binding affinity constants—
KDBP = 4.0 × 10⁷ M−1 and Kalb = 5.4 × 10⁴ M−1—we calculated free 1,25(OH)2D6,7:
Total 1, 25(OH)2 D
Free1, 25(OH)2 D =
1 + Kalb × albumin + KDBP × DBP
Bioavailable 25OHD and bioavailable 1,25(OH)2D were calculated using the following formula based on
precalculated free 25OHD or free 1,25(OH)2D levels, respectively8,9:
Bioavailable D = Free D + albumin − bound D = Free D + Kalb × albumin × Free D
where D = concentration of vitamin D metabolite (25OHD or 1,25(OH)2D) in mol/L; Kalb = affinity constant
between a respective vitamin D metabolite (6 × 10⁵ M−1 for 25OHD and 5.4 × 10⁴ M−1 for 1,25(OH)2D) and
ol−1; albumin = concentration of serum albumin in mol/L.
albumin in m
Measurement of other serum analytes. The detailed data on diagnostic assays and instrumental
devices used for measurement of other serum parameters (calcium, PTH, bone-specific alkaline phosphatase,
LDL, HDL, hemoglobin, etc.) are provided in Supplementary Table 1.
Statistical analyses. Statistical analyses were performed using SPSS 20.0 (IBM, New York, NY, USA) and
GraphPad Prism version 5 software (GraphPad Software, San Diego, CA, USA) as recently described10,11. All
relevant parameters were tested for normality using a D’Agostino and Pearson omnibus normality test and were
found to be not normally distributed (p < 0.05) in the majority of the cases. For this reason, we used Spearman’s
rank correlation analysis to assess bivariate associations between vitamin D metabolites with each other and with
other analytes. The correlation strength (measured as Spearman’s rho values) was classified as follows: ≤ 0.1 no
correlation; 0.1–0.3 weak to modest; 0.3–0.49 moderate; > 0.5 strong correlation. To assess statistical differences
among three trimester groups we used either one-way ANOVA followed by Tukey post hoc test (in cases when
all three trimester groups were normally distributed, as determined by D’Agostino and Pearson omnibus nor-
mality text), or Kruskal–Wallis analysis with Dunn’s multiple comparison test (in cases when at least one group
out of three analyzed groups was found to be not normally distributed). In both correlation and group compari-
son analyses, correlations/group differences were considered significant if p values were < 0.05.
Results
Study participant characteristics. The mean values of participant’s age and gestational age, as well as
selected serum biomarkers for the pregnancy overall and for early, mid-, and late pregnancy are presented in
Table 1.
Changes in serum parameters throughout pregnancy. The data on changes of biochemical and bio-
chemical parameters throughout pregnancy (split by three trimesters) are presented in Table 1. Importantly, a
progressive increase in DBP during pregnancy was observed (43% increase in 3rd trimester compared to the 1st
trimester, p < 0.001, Table 1).
Regarding 25(OH)D metabolites, we found no significant changes in total 25OHD throughout pregnancy. In
contrast, free 25OHD and bioavailable 25OHD were both significantly decreased with gestational age (Table 1).
The dynamics in changes of 1,25(OH)2D isoform levels was totally different compared to the behavior of 25OHD
compounds. Indeed, total 1,25(OH)2D showed a progressive increase throughout pregnancy. The same trend
Scientific Reports | (2021) 11:1923 | https://doi.org/10.1038/s41598-021-81452-9 3
Vol.:(0123456789)www.nature.com/scientificreports/
1st trimester of pregnancy, 2nd trimester of pregnancy, 3rd trimester of pregnancy,
Variable, units mean ± SD mean ± SD mean ± SD Changes throughout pregnancy
T25OHD, ng/mL 18.80 ± 9.96 20.26 ± 11.09 20.55 ± 11.56 ↔
F25OHD, pg/mL 2.84 ± 1.54 2.41 ± 1.41 2.31 ± 1.48*** ↓
B25OHD, ng/mL 1.05 ± 0.57 0.76 ± 0.47*** 0.69 ± 0.44*** ↓
T1,25(OH)2D, pg/mL 105.80 ± 42.59 150.95 ± 47.28*** 163.28 ± 43.68*** ↑
F1,25(OH)2D, pg/mL 0.27 ± 0.10 0.30 ± 0.10** 0.31 ± 0.10*** ↑
B1,25(OH)2D, pg/mL 9.05 ± 3.47 8.84 ± 2.93 8.58 ± 2.68 ↔
Age, years 30.63 ± 6.36 29.54 ± 5.28 29.87 ± 5.86 ↔
Gestational age, weeks 7.98 ± 1.84 21.29 ± 4.06*** 33.25 ± 2.19§§§, *** ↑
PTH, pg/mL 15.37 ± 10.76 14.60 ± 13.48 17.93 ± 13.98 ↔
BSAP, µg/mL 12.93 ± 5.12 13.97 ± 5.86 18.01 ± 8.21§§§,*** ↑
Calcium, mmol/L 2.38 ± 0.12 2.25 ± 0.13*** 2.24 ± 0.10*** ↓
Phosphate, U/L 4.39 ± 1.65 4.07 ± 1.24 4.33 ± 2.23 ↔
DBP, mg/L 532.56 ± 138.73 690.00 ± 171.15*** 762.70 ± 254.08*** ↑
LDL, mg/dL 118.04 ± 34.00 158.52 ± 39.12*** 184.16 ± 40.60§§,*** ↑
HDL, mg/dL 59.36 ± 13.25 65.10 ± 12.40** 67.48 ± 12.64*** ↑
LDL/HDL ratio 2.05 ± 0.61 2.49 ± 0.63*** 2.83 ± 0.82*** ↑
Adiponectin, µg/mL 9.28 ± 4.15 8.06 ± 3.73* 8.41 ± 3.97 ↓
Free T3, pg/mL 3.10 ± 0.38 3.15 ± 0.38 3.03 ± 0.38§ ↓
Free T4, ng/dL 1.02 ± 0.14 0.87 ± 0.12*** 0.85 ± 0.11*** ↓
TSH, uU/mL 1.48 ± 0.97 1.54 ± 0.79 1.45 ± 0.66 ↔
Hemoglobin, g/dL 12.55 ± 0.94 11.53 ± 0.83*** 11.66 ± 0.93*** ↓
RBC count, 106/µL 4.34 ± 0.39 3.90 ± 0.35*** 4.00 ± 0.34*** ↓
WBC count, 103/µL 8.54 ± 2.14 9.55 ± 2.83* 9.75 ± 2.33*** ↑
Platelet count, 103/µL 232.55 ± 50.51 214.12 ± 42.94 220.68 ± 54.10 ↔
MCV, fL 89.13 ± 5.42 89.77 ± 5.67 89.34 ± 5.39 ↔
MCH, pg 29.18 ± 1.96 29.73 ± 2.12 29.32 ± 1.95 ↔
MCHC, g/dL 32.75 ± 0.97 33.15 ± 0.96* 32.93 ± 1.11 ↔
RDW, % 13.97 ± 1.23 13.99 ± 1.11 13.87 ± 1.16 ↔
Hematocrit, % 38.57 ± 2.85 34.86 ± 2.39*** 35.51 ± 2.96*** ↓
Urea, mg/dL 23.07 ± 5.85 17.97 ± 4.89*** 17.93 ± 4.58*** ↓
Albumin, g/dL 4.09 ± 0.38 3.45 ± 0.30*** 3.30 ± 0.24*** ↓
Vitamin B6, ng/mL 14.43 ± 18.70 7.34 ± 7.78*** 5.55 ± 13.11§,*** ↓
Vitamin B12, pg/mL 368.63 ± 157.81 279.23 ± 123.68*** 275.75 ± 121.83*** ↓
Sodium, mmol/L 137.80 ± 4.46 138.03 ± 2.80 137.77 ± 3.43 ↔
Zinc, µmol/L 12.50 ± 2.83 10.13 ± 2.21** 9.86 ± 2.13*** ↓
Table 1. Biochemical characteristics of the study population. Mean values ± standard deviation of age
and gestational age, vitamin D metabolites and biochemical, hematological, and endocrinological serum
parameters in 1st, 2nd, and 3rd pregnancy trimesters. B25OHD, bioavailable 25OHD; B1,25(OH)2D,
bioavaialble 1,25(OH)2D; BSAP, bone-specific alkaline phosphatase; F25OHD, free 25OHD; F1,25(OH)2D,
free 1,25(OH)2D; fT3, free triiodothyronine; fT4, free thyroxine; HDL, high-density lipoprotein cholesterol;
LDL, low-density lipoprotein cholesterol; MCH, mean corpuscular hemoglobin; MCHC, mean corpuscular
hemoglobin concentration; MCV, mean corpuscular volume of red blood cells; PTH, parathyroid hormone;
RBC, red blood cell; RDW, red blood cell distribution width; T25OHD, total 25OHD; T1,25(OH)2D, total
1,25(OH)2D; WBC, white blood cell. *p < 0.05 versus 1st trimester; **p < 0.01 versus 1st trimester; ***p < 0.001
versus 1st trimester; §§p < 0.01 versus 2nd trimester; §§§p < 0.001 versus 2nd trimester.
revealed free 1,25(OH)2D with however weaker numerical rise. In contrast, bioavailable 1,25(OH)2D showed
no significant differences between early and late gestation groups (Table 1).
Associations between 25OHD and 1,25(OH)2D metabolites. In general, absolutely all analyzed
compounds of 25OHD and 1,25(OH)2D showed a significant positive correlation with each other, however, the
degree of such association (characterized by Spearman’s rho) varied from 0.15 until 0.98 (p < 0.001 for all pairs
of comparison, except of the pair total 1,25(OH)2D versus bioavailable 25OHD with p = 0.002, Table 2). Regard-
ing 25OHD isoforms, total 25OHD, free 25OHD, and bioavailable 25OHD revealed very strong correlation
between each other (0.813 < rho < 0.976, Table 2). Regarding interrelations between 1,25(OH)2D compounds,
the correlation was substantially weaker (0.588 < rho < 0.923, p < 0.001 for all pairs of comparison) compared to
the ones between 25OHD isoforms and more variable depending on certain pair of comparison. In addition,
Scientific Reports | (2021) 11:1923 | https://doi.org/10.1038/s41598-021-81452-9 4
Vol:.(1234567890)www.nature.com/scientificreports/
Spearman’s
T25OHD, F25OHD, B 25OHD, T1,25(OH)2D, F1,25(OH)2D, B1,25(OH)2D,
rho color
ng/mL pg/mL ng/mL pg/mL pg/mL pg/mL
gradient
T25OHD, 0.1 < rho < 0.2
– rho = 0.886, rho = 0.813, rho = 0.572, rho = 0.560, rho = 0.543,
ng/mL
p < 0.001 p < 0.001 p < 0.001 p < 0.001 p < 0.001
0.2 < rho < 0.3
F25OHD, 0.3 < rho < 0.4
rho = 0.976, rho = 0.290, rho = 0.551, rho = 0.628,
pg/mL –
p < 0.001 p < 0.001 p < 0.001 p < 0.001
0.4 < rho < 0.5
B25OHD, 0.5 < rho < 0.6
rho = 0.152, rho = 0.455, rho = 0.603,
ng/mL –
p = 0.002 p < 0.001 p < 0.001 0.6 < rho < 0.7
T1,25(OH)2D, 0.7 < rho < 0.8
rho = 0.775, rho = 0.588,
pg/mL –
p < 0.001 p < 0.001 0.8 < rho < 0.9
F1,25(OH)2D, 0.9 < rho < 1.0
rho = 0.923,
pg/mL –
p < 0.001
B1,25(OH)2D,
–
pg/mL
Table 2. Interrelations between 25OHD and 1,25(OH)2D isoforms. The correlation strength is defined by
Spearman’s rank correlation coefficient rho. Abbreviations: B25OHD, bioavailable 25OHD; B1,25(OH)2D,
bioavaialble 1,25(OH)2D; F25OHD, free 25OHD; F1,25(OH)2D, free 1,25(OH)2D; T25OHD, total 25OHD;
T1,25(OH)2D, total 1,25(OH)2D.
total 25OHD showed a medium correlation with all three 1,25(OH)2D compounds of nearly equal strength (rho
around 0.55). In contrast, free 25OHD and bioavailable 25OHD showed much weaked correlation with total
1,25(OH)2D than with free 1,25(OH)2D and bioavailable 1,25(OH)2D (rho = 0.29, 0.55, and 0.63, respectively,
see Table 3). The relationship between bioavailable 25OHD and 1,25(OH)2D compounds was very similar to
interrelations between free 25OHD and 1,25(OH)2D.
Correlations of free and total 25(OH)D with serum biochemical and hematological parame‑
ters. Overall, free 25OHD and, particularly bioavailable 25OHD, showed stronger associations with distinct
parameters than total 25OHD (Table 3).
Total 25OHD showed no correlation with serum calcium—a key parameter of bone health (rho = 0.080,
p = 0.098), whereas free 25OHD revealed weak but significant positive correlation with calcium (rho = 0.234,
p < 0.001, Table 3). Bioavailable 25OHD showed even stronger association with calcium (rho = 0.369, p < 0.001,
Table 3).
Total 25(OH)D showed no correlation with serum albumin, free thyroxin, urea, adiponectin, LDL, LDL/HDL
ratio, vitamin B12, hemoglobin, white blood cell count, and red blood cell distribution width, in contrast to free
25(OH)D, which did show weak but significant correlations with these analytes (Table 3). In addition, despite
the presence of the correlation between total 25(OH)D and bone-specific alkaline phosphatase and vitamin
B6, it was borderline significant, in contrast to free 25(OH)D, which was correlated with these parameters with
p < 0.001. The associations of total and free 25(OH)D with other biochemical and hematological parameters are
presented in Table 3.
Discussion
Summary of the key findings. To the best of our knowledge, the present cross-sectional study is the first
report comparing the behavior of the six vitamin D compounds—free, bioavailable, and total 25-hydroxyvita-
min D as well as free, bioavailable, and total 1,25-dihydroxyvitamin D—in a relatively large population of healthy
pregnant women (n = 427). Among the 1,25-dihydroxyvitamin D metabolites analyzed, total 1,25(OH)2D
showed clearly the best correlation with components of the endocrine vitamin D system and/or potential cellu-
lar targets of activation of the vitamin D receptor (see Table 3). When comparing the three 25OHD metabolites,
both free 25OHD and bioavailable 25OHD showed overall good correlations with the analyzed clinical labora-
tory parameters, bioavailable 25OHD might perform even better then free 25OHD. The only exception from the
above described overall findings is PTH. It correlates well with total 25OHD most likely because the parathyroid
cells have a highly specific uptake mechanism for bound 25OHD—megalin/cubilin-uptake system, see below.
Scientific Reports | (2021) 11:1923 | https://doi.org/10.1038/s41598-021-81452-9 5
Vol.:(0123456789)www.nature.com/scientificreports/
Total 25(OH)D, Free 25(OH)D, Bioavailable 25(OH)D, Total 1,25(OH)2D, Free 1,25(OH)2D, Bioavailable 1,25(OH)2D, Spearman’s rho color
ng/mL pg/mL ng/mL pg/mL pg/mL pg/mL gradient
Age and gest onal age –0.5 > rho > –0.6
Age, years 0.218, p < 0.001 0.235, p < 0.001 0.227, p < 0.001 0.027, p = 0.572 0.078, p = 0.109 0.091, p = 0.062 –0.4 > rho > –0.5
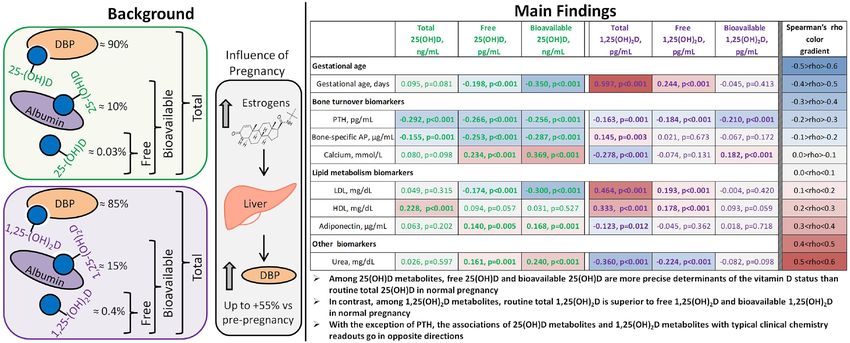
Ge stati onal age , days 0.095, p = 0.081 –0.198, p < 0.001 –0.350, p < 0.001 0.597, p < 0.001 0.244, p < 0.001 –0.045, p = 0.413 –0.3 > rho > –0.4
Bone turnover biomarkers –0.2 > rho > –0.3
PTH, pg/mL –0.292, p < 0.001 –0.266, p < 0.001 –0.256, p < 0.001 –0.163, p = 0.001 –0.184, p < 0.00 –0.210, p < 0.001 –0.1 > rho > –0.2
BSAP, µg/mL –0.155, p = 0.001 –0.253, p < 0.001 –0.287, p < 0.001 0.145, p = 0.003 0.021, p = 0.673 –0.067, p = 0.172 0.0 > rho > –0.1
Cal ci um, mmol /L 0.080, p = 0.098 0.234, p < 0.001 0.369, p < 0.001 –0.278, p < 0.001 –0.074, p = 0.131 0.182, p < 0.001 0.0 < rho < 0.1
Phosphate, U/L 0.097, p = 0.046 0.041, p = 0.403 0.050, p = 0.305 0.003, p = 0.946 –0.096, p = 0.050 –0.090, p = 0.066 0.1 < rho < 0.2
Lipid metabolism biomarkers 0.2 < rho < 0.3
LDL, mg/dL 0.049, p = 0.315 –0.174, p < 0.001 –0.300, p < 0.001 0.464, p < 0.001 0.193, p < 0.001 -0.004, p = 0.420 0.3 < rho < 0.4
HDL, mg/dL 0.228, p < 0.001 0.094, p = 0.057 0.031, p = 0.527 0.333, p < 0.001 0.178, p < 0.001 0.093, p = 0.059 0.4 < rho < 0.5
LDL/HDL ra –0.099, p = 0.044 –0.228, p < 0.001 –0.308, p < 0.001 0.232, p < 0.001 0.071, p = 0.153 -0.104, p = 0.036 0.5 < rho < 0.6
Adipone cti n, µg/mL 0.063, p = 0.202 0.140, p = 0.005 0.168, p = 0.001 –0.123, p = 0.012 – 0.045, p = 0.362 0.018, p = 0.718
Thyroid gland-associated biomarkers
Free T3, pg/mL –0.114, p = 0.018 –0.144, p = 0.003 –0.120, p = 0.013 –0.040, p = 0.415 –0.088, p = 0.073 –0.070, p = 0.153
Free T4, ng/dL –0.095, p = 0.049 0.087, p = 0.074 0.216, p < 0.001 –0.413, p < 0.001 –0.203, p < 0.001 0.028, p = 0.571
TSH, uU/mL 0.021, p = 0.670 0.000, p = 0.996 – 0.005, p = 0.916 – 0.020, p = 0.674 – 0.087, p = 0.075 – 0.095, p = 0.052
Hematological biomarkers
He moglobi n, g/dL 0.063, p = 0.252 0.203, p < 0.001 0.298, p < 0.001 –0.226, p < 0.001 –0.008, p = 0.881 0.177, p = 0.001
6
RBC count, 10 /µL 0.016, p = 0.784 0.119, p = 0.042 0.208, p < 0.001 –0.215, p < 0.001 –0.056, p = 0.338 0.104, p = 0.074
3
WBC count, 10 /µL 0.051, p = 0.379 – 0.062, p = 0.287 – 0.098, p = 0.092 0.231, p < 0.001 0.088, p = 0.130 0.031, p = 0.600
3
Platelet count, 10 /µL –0.084, p = 0.148 – 0.062, p = 0.295 – 0.026, p = 0.654 – 0.109, p = 0.060 –0.117, p = 0.045 –0.060, p = 0.310
MCV, fL 0.116, p = 0.046 0.145, p = 0.013 0.146, p = 0.013 0.031, p = 0.598 0.084, p = 0.153 0.110, p = 0.060
MCH, pg 0.101, p = 0.083 0.123, p = 0.035 0.110, p = 0.061 0.065, p = 0.263 0.122, p = 0.037 0.135, p = 0.021
MCHC, g/dL 0.004, p = 0.940 0.004, p = 0.945 – 0.027, p = 0.649 0.091, p = 0.118 0.134, p = 0.022 0.115, p = 0.049
RDW, % – 0.095, p = 0.101 – 0.102, p = 0.081 – 0.094, p = 0.110 – 0.073, p = 0.207 – 0.109, p = 0.062 –0.129, p = 0.028
He matocrit, % 0.090, p = 0.120 0.228, p < 0.001 0.333, p < 0.001 –0.239, p < 0.001 –0.034, p = 0.562 0.158, p = 0.007
Other biomarkers
Ure a, mg/dL 0.026, p = 0.597 0.161, p = 0.001 0.240, p < 0.001 –0.360, p < 0.001 –0.224, p < 0.001 –0.082, p = 0.098
Al bumi n, g/dL – 0.056, p = 0.247 0.185, p < 0.001 0.377, p < 0.001 –0.533, p < 0.001 –0.272, p < 0.001 0.075, p = 0.126
Vitamin B6, ng/mL 0.178, p < 0.001 0.367, p < 0.001 0.458, p < 0.001 –0.277, p < 0.001 –0.025, p = 0.623 0.164, p = 0.001
Vitamin B12, pg/mL 0.130, p = 0.008 0.280, p < 0.001 0.363, p < 0.001 –0.246, p < 0.001 –0.069, p = 0.164 0.102, p = 0.038
Sodi um, mmol/L 0.086, p = 0.081 0.081, p = 0.104 0.082, p = 0.098 0.043, p = 0.380 0.024, p = 0. 629 0.032, p = 0.526
Zi nc, µmol/L – 0.020, p = 0.867 0.163, p = 0.171 0.275, p = 0.020 –0.396, p = 0.001 –0.297, p = 0.011 –0.001, p = 0.992
Table 3. Interrelations between 25OHD and 1,25(OH)and 1,25(OH)2D isoforms with age, gestational age,
biochemical, hematological, and endocrinological serum parameters. The correlation strength is defined by
Spearman’s rank correlation coefficient rho (appears first in each cell). Abbreviations: B25OHD, bioavailable
25OHD; B1,25(OH)2D, bioavaialble 1,25(OH)2D; BSAP, bone-specific alkaline phosphatase; F25OHD, free
25OHD; F1,25(OH)2D, free 1,25(OH)2D; fT3, free triiodothyronine; fT4, free thyroxine; HDL, high-density
lipoprotein cholesterol; LDL, low-density lipoprotein cholesterol; MCH, mean corpuscular hemoglobin;
MCHC, mean corpuscular hemoglobin concentration; MCV, mean corpuscular volume of red blood cells; PTH,
parathyroid hormone; RBC, red blood cell; RDW, red blood cell distribution width; T25OHD, total 25OHD;
T1,25(OH)2D, total 1,25(OH)2D; WBC, white blood cell.
With the exception of PTH, associations of 25(OH)D metabolites and 1,25(OH)2D metabolites with typical
clinical chemistry readouts goes in opposite directions.
Moreover, our study confirmed the finding of the study by Bouillon et al.12 that serum total 25OHD doesn’t
markedly change during pregnancy, whereas serum total 1,25(OH)2D increased significantly along with serum
DBP, which in turn resulted in the increase in free vitamin D metabolites: free 25OHD was declined and free
1,25(OH)2D was slightly elevated as total 1,25(OH)2D was increased slighthy more than DBP.
Free 25OHD and bioavailable 25OHD were found to be superior to traditional total
25OHD. Our data suggest that in normal human pregnancy both free 25OHD and bioavailable 25OHD (the
latter is tendentially slightly superior to free 25OHD) appear to be more precise indicators of vitamin D status
during pregnancy than routine total 25OHD in terms of overall better correlations with gestational age, calcium,
bone-specific alkaline phosphatase, adiponectin, hemoglobin and red blood cell count, vitamins B6 and B12 and
other analytes (Table 3). In other words, our data are in favor of clinical relevance of free hormone hypothesis
for 25OHD.
To date, the data on changes in free/bioavailable 25OHD with total 25OHD throughout pregnancy were
analyzed in nine s tudies9–11,13–18, including our o
wn10,11. Overall, the data regarding the comparison of the diag-
nostic potential of free/bioavailable 25OHD versus total 25OHD, reported by these authors, are conflicting due
to low sample sizes (varying between 10 and 60 participants), with the exception of two studies by Powe et al.18
and Gustafsson et al.17 , which was based on 170 and 855 pregnant women, respectively. This discrepancy was
discussed in details in our recent publications11,19. This study by Powe et al.18 differs from ours: just three-fourth
of the participating women were healthy and only around 60% were of White ethnicity. Although F25OHD was
assessed by calculation method using vitamin D-binding protein (DBP) levels like in our study, DBP in this
study was measured using a monoclonal antibody-based ELISA. This DBP measurement technique is considered
unreliable, especially when having populations with different ethnic backgrounds due to DBP polymorphism20–23.
Our study is larger, conducted in an ethnically homogenous cohort and by using the state-of-the-art way to
measure DBP. We thus believe that our data are more relevant. Moreover, these results are in good agreement
with the findings of our previous s tudy11, where we compared total 25OHD with directly measured free 25OHD.
Scientific Reports | (2021) 11:1923 | https://doi.org/10.1038/s41598-021-81452-9 6
Vol:.(1234567890)www.nature.com/scientificreports/
Regarding the large longitudinal study by Gustafsson et al.17, since the authors did not present the data of bivari-
ate correlation analysis (free 25OHD/total 25OHD versus PTH), a one-to-one comparison of our results with
their results is impossible.
Neither free 1,25(OH)2D nor bioavailable 1,25(OH)2D showed superiority to total
1,25(OH)2D. In contrast to 25OHD—vitamin D’s precursor and reservoir—our data do not support the free
hormone hypothesis for 1,25(OH)2D—vitamin D’s biologically active metabolite. Indeed, with the exception of
PTH, total 1,25(OH)2D showed constantly stronger correlations with all analyzed serum biomarkers than free
1,25(OH)2D and bioavailable 1,25(OH)2D (Table 3).
According to the data of numerous cross-sectional and longitudinal studies, total 1,25(OH)2D is known to
rise up to threefold versus non-pregnant state24. This is the result of the increased production of 1,25(OH)2D by
25-hydroxyvitamin D-1α-hydroxylase (CYP27B1) by not only maternal kidneys, but also, although to a lesser
extent, by the fetoplacental unit (maternal decidual and fetal trophoblast tissues of the placenta and fetal kid-
ney)24–26. We likewise detected total 1,25(OH)2D increase throughout gestation. Notably, free 1,25(OH)2D but
not bioavailable 1,25(OH)2D was found to rise throughout pregnancy course. Three other s tudies3,17,27 likewise
reported an increase in free 1,25(OH)2D with pregnancy course.
Correlation with PTH stays apart: all six vitamin D isoforms showed nearly equal associations
with PTH. PTH—a major secretory product of parathyroid gland and a second, along with 1,25(OH)2D,
hormonal regulator of calcium homeostasis—was found to be the only biomarker which showed the same
direction of correlation (negative correlation) and strength (weak but still significant negative correlation) with
all six analysed vitamin D metabolites. The most likely explanation of this finding could be that parathyroid
gland, along with kidney and placenta, are exceptional organs, which have megalin/cubilin-mediated system
of 25OHD/1,25(OH)2D uptake from 25OHD-DBP and 1,25(OH)2D-DBP complexes28,29 and thus the cells of
parathyroid gland are influenced by all circulating isoforms of 25OHD/1,25(OH)2D at nearly the equal extent.
This mechanism is absent in most of the other cell types and organs, leaving for those cells only the option of the
freely circulating 25OHD/1,25(OH)2D uptake via passive diffusion through plasma membranes.
25OHD and 1,25(OH)2D correlate in opposite directions with biochemical and endocrinologi‑
cal biomarkers. The direction of correlation (i.e., positive vs negative) between 25OHD metabolites on one
hand, and 1,25(OH)2D metabolites on the other hand, with other serum biomarkers was found to be opposite.
The most prominent examples are the differences in the correlation directions with such biomarkers as LDL,
free thyroxin, urea, vitamins B6, B12, and zinc (Table 3). This emphasizes the different biological roles of total
1,25(OH)2D—vitamin D’s fully active isoform, which (total 1,25(OH)2D)—is present in the circulation in a
picomolar range and have a half-life of 5–80 h30 and total 25OHD—vitamin D’s precursor, which is present in the
circulation in nearly thousand-fold higher concentration range and have a half-live of 10–40 days30 and which
is well known to serve as a reservoir/storage fraction of vitamin D, responsible for balancing/minimization of
short-time (intraday) vitamin D isoform fluctuations. The 10–100-fold lower affinity between DBP and free
1,25(OH)2D compared to the affinity between DBP and free 25OHD (to the lesser extent this is valid likewise
for albumin) as well as much higher (up to 100-fold) affinity of nuclear VDR for free 1,25(OH)2D than for free
25OHD are factors influencing concentrations of the vitamin D metabolites at the nuclear receptor. Whether
or not the strength of the binding of either free 1,25(OH)2D or free 25OHD to the nuclear receptor is affecting
gene expression in an opposite manner is unknown so far. It is conceivable that hormone receptor ligands with
low binding affinity for the receptor may act as partial receptor antagonists, whereas ligands with high affinity
fully stimulate the receptor. However, this needs to be proven in adequately designed basic science experiments.
In any case, this is the first study reporting differences in correlation strength between 25OHD/1,25(OH)2D iso-
forms versus key clinical parameters. This for sure needs to be repeated in independent cohorts and the underly-
ing molecular mechanisms (see our hypothesis above) need to be explored in future studies.
Study limitations. The data on free and bioavailable 25OHD and 1,25(OH)2D were based on calculations
using the affinity constants between 25OHD/1,25(OH)2D and DBP and 25OHD/1,25(OH)2D and albumin.
These affinity constants were measured experimentally in serum samples of non-pregnant individuals and has
not been verified in pregnant women so far. However, the possible inaccuracies (a systematic shift in calculated
free/bioavailable 25OHD/1,25(OH)2D absolute levels versus their real values) are not influencing the key find-
ings of our study, because our conclusions depend on the relative changes of free, bioavailable and total 25OHD
and 1,25(OH)2D, respectively rather than absolute changes of these parameters.
It is very well known that during pregnancy, especially in the 3rd trimester, the blood volume of the pregnant
women increases and thus the blood is diluted to a certain e xtent31. However, the influence of hemodilution as
a confounding factor in bivariate associations presented in this study will not change the correlation direction.
Hemodilution might have just flatten the correlation strength (as presented by Spearman’s rho values), but it will
not reverse the direction of correlation.
The accuracy of total 25OHD levels produced by fully-automated commercial immunoassays, especially in
the conditions of pregnancy-induced increased DBP levels, is a well-known issue32. However, we used the total
25OHD kit with the best diagnostic precision characteristics in pregnancy among the other tested commercial
kits when comparing to total 25OHD concentrations measured by mass-spectrometry—a technique considered
the gold standard for the measurement of 2 5OHD32. Undoubtedly, the usage of LC–MS/MS might have further
improved the data quality.
Scientific Reports | (2021) 11:1923 | https://doi.org/10.1038/s41598-021-81452-9 7
Vol.:(0123456789)www.nature.com/scientificreports/
Figure 1. Key findings of our study are: (i) Both free 25(OH)D and bioavailable 25(OH)D showed better
correlations with gestational age, bone and lipid metabolism biomarkers than total 25(OH)D. (ii) Total
1,25(OH)2D is superior to free 1,25(OH)2D and bioavailable 1,25(OH)2D. (iii) 25(OH)D metabolites and
1,25(OH)2D metabolites correlated with gestational age, bone and lipid biomarkers in opposite directions.
DBP, being a highly polymorphic protein, was reported to have genotype differences (up to threefold) in
affinity constants with 2 5OHD33. Although these data were not confirmed by three other s tudies34–36, we are on
the safe side with our key conclusions, because we used quite a monogenic (Caucasian) cohort and we measured
DBP with a polyclonal-antibody-based ELISA kit. Finally, we conducted a single-centered study and thus single-
centered effects cannot be excluded.
Conclusions. The present study compared the performance of the six vitamin D compounds—free, bio-
available, and total 25-hydroxyvitamin D (free 25OHD, bioavailable 25OHD, total 25OHD) as well as free, bio-
available, and total 1,25-dihydroxyvitamin D (free 1,25(OH)2D, bioavailable 1,25(OH)2D, total 1,25(OH)2D).
Among the 1,25-dihydroxyvitamin D metabolites, total 1,25(OH)2D clearly showed the best correlation with
components of the endocrine vitamin D system and/or potential cellular targets of activation of the vitamin D
receptor. When comparing the three 25OHD metabolites, both free 25OHD and bioavailable 25OHD showed an
overall good correlation with the analyzed clinical laboratory parameters, bioavailable 25OHD might perform
even better then free 25OHD. The only exception is PTH. It correlates well with total 25OHD most likely because
the parathyroid cells have a highly specific uptake mechanism for total 25OHD—the megalin/cubilin-uptake
system. This specific system acts much faster as compared to the uptake via the cell membrane. With the excep-
tion of PTH, correlations of 25(OH)D and 1,25(OH)2D metabolites with typical clinical chemistry readouts go
in opposite directions suggesting potentially opposite effects of either 25(OH)D or 1,25(OH)2D on the nuclear
vitamin D receptor in some target cells of vitamin D (see also Fig. 1 summarizing the key findings of our study).
This hypothesis based on clinical data needs to be confirmed in adequately designed basic science studies.
Received: 29 October 2020; Accepted: 6 January 2021
References
1. Bikle, D., Bouillon, R., Thadhani, R. & Schoenmakers, I. Vitamin D metabolites in captivity? Should we measure free or total
25(OH)D to assess vitamin D status?. J. Steroid Biochem. Mol. Biol. 173, 105–116 (2017).
2. Bikle, D. D. & Gee, E. Free, and not total, 1,25-dihydroxyvitamin D regulates 25-hydroxyvitamin D metabolism by keratinocytes.
Endocrinology 124, 649–654 (1989).
3. Bikle, D. D., Gee, E., Halloran, B. & Haddad, J. G. Free 1,25-dihydroxyvitamin D levels in serum from normal subjects, pregnant
subjects, and subjects with liver disease. J. Clin. Invest. 74, 1966–1971 (1984).
4. Dwi Putra, S. E. et al. Being born large for gestational age is associated with increased global placental DNA methylation. Sci. Rep.
10, 927 (2020).
5. Yong-Ping, L. et al. Impact of maternal smoking associated lyso-phosphatidylcholine 20:3 on offspring brain development. J. Steroid
Biochem. Mol. Biol. 199, 105591 (2020).
6. Bikle, D. D. et al. Assessment of the free fraction of 25-hydroxyvitamin D in serum and its regulation by albumin and the vitamin
D-binding protein. J. Clin. Endocrinol. Metab. 63, 954–959 (1986).
7. Bikle, D. D., Siiteri, P. K., Ryzen, E. & Haddad, J. G. Serum protein binding of 1,25-dihydroxyvitamin D: A reevaluation by direct
measurement of free metabolite levels. J. Clin. Endocrinol. Metab. 61, 969–975 (1985).
8. Powe, C. E. et al. Vitamin D-binding protein modifies the vitamin D-bone mineral density relationship. J. Bone Miner. Res Off. J.
Am. Soc. Bone Miner. Res. 26, 1609–1616 (2011).
9. Kim, H. J. et al. Clinical utility of measurement of vitamin D-binding protein and calculation of bioavailable vitamin D in assess-
ment of vitamin D status. Ann. Lab. Med. 37, 34–38 (2017).
Scientific Reports | (2021) 11:1923 | https://doi.org/10.1038/s41598-021-81452-9 8
Vol:.(1234567890)www.nature.com/scientificreports/
10. Tsuprykov, O., Buse, C., Skoblo, R., Haq, A. & Hocher, B. Reference intervals for measured and calculated free 25-hydroxyvitamin
D in normal pregnancy. J. Steroid Biochem. Mol. Biol. 181, 80–87 (2018).
11. Tsuprykov, O., Buse, C., Skoblo, R. & Hocher, B. Comparison of free and total 25-hydroxyvitamin D in normal human pregnancy.
J. Steroid Biochem. Mol. Biol. 190, 29–36 (2019).
12. Bouillon, R., Van Assche, F. A., Van Baelen, H., Heyns, W. & De Moor, P. Influence of the vitamin D-binding protein on the serum
concentration of 1,25-dihydroxyvitamin D3. Significance of the free 1,25-dihydroxyvitamin D3 concentration. J. Clin. Invest. 67,
589–596 (1981).
13. Schwartz, J. B. et al. A comparison of measured and calculated free 25(OH) vitamin D levels in clinical populations. J. Clin. Endo-
crinol. Metab. 99, 1631–1637 (2014).
14. Schwartz, J. B. et al. Variability in Free 25(OH) Vitamin D Levels in Clinical Populations. J. Steroid Biochem. Mol. Biol. 144PA,
156–158 (2014).
15. Jones, K. S., Assar, S., Prentice, A. & Schoenmakers, I. Vitamin D expenditure is not altered in pregnancy and lactation despite
changes in vitamin D metabolite concentrations. Sci. Rep. 6, 26795. https://doi.org/10.1038/srep26795 (2016).
16. Best, C. M., Pressman, E. K., Queenan, R. A., Cooper, E. & O’Brien, K. O. Longitudinal changes in serum vitamin D binding protein
and free 25-hydroxyvitamin D in a multiracial cohort of pregnant adolescents. J. Steroid Biochem. Mol. Biol. 186, 79–88 (2019).
17. Gustafsson, M. K. et al. Alterations in the vitamin D endocrine system during pregnancy: A longitudinal study of 855 healthy
Norwegian women. PLoS ONE 13, e0195041 (2018).
18. Powe Camille, E. et al. First trimester vitamin D, vitamin D binding protein, and subsequent preeclampsia. Hypertension 56,
758–763 (2010).
19. Tsuprykov, O. et al. Why should we measure free 25(OH) vitamin D?. J. Steroid Biochem. Mol. Biol. 180, 87–104 (2018).
20. Nielson, C. M. et al. Role of assay type in determining free 25-hydroxyvitamin D levels in diverse populations. N. Engl. J. Med.
374, 1695–1696 (2016).
21. Nielson, C. M. et al. Free 25-hydroxyvitamin D: Impact of vitamin D binding protein assays on racial-genotypic associations. J.
Clin. Endocrinol. Metab. 101, 2226–2234 (2016).
22. Hoofnagle, A. N., Eckfeldt, J. H. & Lutsey, P. L. Vitamin D-binding protein concentrations quantified by mass spectrometry. N.
Engl. J. Med. 373, 1480–1482 (2015).
23. Bouillon, R., Schuit, F., Antonio, L. & Rastinejad, F. Vitamin D binding protein: A historic overview. Front. Endocrinol. (Lausanne).
https://doi.org/10.3389/fendo.2019.00910 (2020).
24. Kovacs, C. S. Chapter 42—Pregnancy, Lactation, and Postweaning Recovery. In Vitamin D 4th edn (ed. Feldman, D.) 755–782
(Academic Press, Cambridge, 2018).
25. Olmos-Ortiz, A., Avila, E., Durand-Carbajal, M. & Díaz, L. Regulation of calcitriol biosynthesis and activity: Focus on gestational
vitamin D deficiency and adverse pregnancy outcomes. Nutrients 7, 443–480 (2015).
26. Karras, S. N., Wagner, C. L. & Castracane, V. D. Understanding vitamin D metabolism in pregnancy: From physiology to patho-
physiology and clinical outcomes. Metab. Clin. Exp. 86, 112–123 (2018).
27. Wilson, S. G., Retallack, R. W., Kent, J. C., Worth, G. K. & Gutteridge, D. H. Serum free 1,25-dihydroxyvitamin D and the free
1,25-dihydroxyvitamin D index during a longitudinal study of human pregnancy and lactation. Clin. Endocrinol. (Oxf.) 32, 613–622
(1990).
28. Lundgren, S. et al. Tissue distribution of human gp330/megalin: A putative Ca2+-sensing protein. J. Histochem. Cytochem. 45,
383–392 (1997).
29. Bikle, D. D., Malmstroem, S. & Schwartz, J. Current controversies: Are free vitamin metabolite levels a more accurate assessment
of vitamin D status than total levels?. Endocrinol. Metab. Clin. North Am. 46, 901–918 (2017).
30. Schoenmakers, I. & Jones, K. S. Chapter 37—Pharmacology and Pharmacokinetics. In Vitamin D 4th edn (ed. Feldman, D.) 635–661
(Academic Press, Cambridge, 2018).
31. Soma-Pillay, P. et al. Physiological changes in pregnancy. Cardiovasc. J. Afr. 27, 89–94 (2016).
32. Heijboer, A. C., Blankenstein, M. A., Kema, I. P. & Buijs, M. M. Accuracy of 6 routine 25-hydroxyvitamin D assays: Influence of
vitamin D binding protein concentration. Clin. Chem. 58, 543–548 (2012).
33. Arnaud, J. & Constans, J. Affinity differences for vitamin D metabolites associated with the genetic isoforms of the human serum
carrier protein (DBP). Hum. Genet. 92, 183–188 (1993).
34. Bouillon, R., Van Baelen, H. & De Moor, P. Comparative study of the affinity of the serum vitamin d-binding protein. J. Steroid
Biochem. 13, 1029–1034 (1980).
35. Kawakami, M., Imawari, M. & Goodman, D. S. Quantitative studies of the interaction of cholecalciferol (vitamin D3) and its
metabolites with different genetic variants of the serum binding protein for these sterols. Biochem. J. 179, 413–423 (1979).
36. Boutin, B., Galbraith, R. M. & Arnaud, P. Comparative affinity of the major genetic variants of human group-specific component
(vitamin D-binding protein) for 25-(OH) vitamin D3. J. Steroid Biochem. 32, 59–63 (1989).
Author contributions
All the authors have accepted responsibility for the entire content of this submitted manuscript and approved
submission. BH designed the study. O.T., B.K.K. and B.H. wrote the manuscript. B.H. and O.T. did statistics,
O.T., C.C., C.B. and S.E. collected the data.
Funding
Open Access funding enabled and organized by Projekt DEAL.
Competing interests
The authors declare no competing interests.
Additional information
Supplementary Information The online version contains supplementary material available at https://doi.
org/10.1038/s41598-021-81452-9.
Correspondence and requests for materials should be addressed to B.H.
Reprints and permissions information is available at www.nature.com/reprints.
Publisher’s note Springer Nature remains neutral with regard to jurisdictional claims in published maps and
institutional affiliations.
Scientific Reports | (2021) 11:1923 | https://doi.org/10.1038/s41598-021-81452-9 9
Vol.:(0123456789)www.nature.com/scientificreports/
Open Access This article is licensed under a Creative Commons Attribution 4.0 International
License, which permits use, sharing, adaptation, distribution and reproduction in any medium or
format, as long as you give appropriate credit to the original author(s) and the source, provide a link to the
Creative Commons licence, and indicate if changes were made. The images or other third party material in this
article are included in the article’s Creative Commons licence, unless indicated otherwise in a credit line to the
material. If material is not included in the article’s Creative Commons licence and your intended use is not
permitted by statutory regulation or exceeds the permitted use, you will need to obtain permission directly from
the copyright holder. To view a copy of this licence, visit http://creativecommons.org/licenses/by/4.0/.
© The Author(s) 2021
Scientific Reports | (2021) 11:1923 | https://doi.org/10.1038/s41598-021-81452-9 10
Vol:.(1234567890)You can also read