Ponatinib for RAS-Driven Multiple Myeloma: Ecacy in the High-Risk VQ Myeloma Model - Research Square
←
→
Page content transcription
If your browser does not render page correctly, please read the page content below
Ponatinib for RAS-Driven Multiple Myeloma: Efficacy
in the High-Risk VQ Myeloma Model
Evan Flietner
University of Wisconsin–Madison
Zhi Wen
University of Wisconsin–Madison
Adhithi Rajagopalan
University of Wisconsin–Madison
Oisun Jung
University of Wisconsin–Madison
Joshua Wiesner
University of Wisconsin–Madison
Xiaona You
University of Wisconsin–Madison
Yun Zhou
University of Wisconsin–Madison
Brock Kingstad-Bakke
University of Wisconsin–Madison
Natalie Callander
University of Wisconsin–Madison
Alan Rapraeger
University of Wisconsin–Madison
M. Suresh
University of Wisconsin–Madison
Fotis Asimakopoulos
University of California, San Diego
Jing Zhang ( zhang@oncology.wisc.edu )
University of Wisconsin–Madison
Research Article
Keywords: multiple myeloma, VQ model, re-purpose drug screen, ponatinib
Posted Date: February 21st, 2022
Page 1/18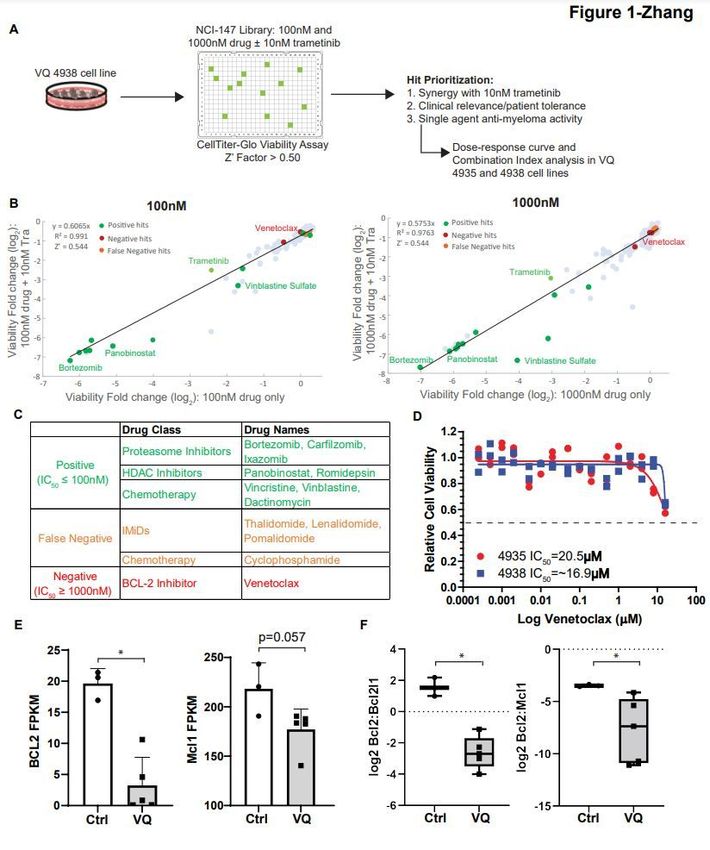
DOI: https://doi.org/10.21203/rs.3.rs-1296881/v1
License: This work is licensed under a Creative Commons Attribution 4.0 International License.
Read Full License
Page 2/18
Abstract
Multiple myeloma (MM) is a malignant plasma cell cancer. Mutations in RAS pathway genes are
prevalent in advanced and proteasome inhibitor (PI) refractory MM. As such, we recently developed a VQ
MM mouse model recapitulating human advanced/high-risk MM. Using VQ MM cell lines we conducted a
re-purpose screen of 147 FDA-approved anti-cancer drugs with or without trametinib (Tra), a MEK
inhibitor. Consistent with its high-risk molecular feature, VQ MM displayed reduced responses to PIs and
de novo resistance to the Bcl2 inhibitor, venetoclax. Ponatinib (Pon) is the only tyrosine kinase inhibitor
that showed moderate MM killing activity as single agent and strong synergism with Tra in vitro.
Combined Tra and Pon treatment significantly prolonged the survival of VQ MM mice regardless of
treatment schemes. However, this survival benefit was moderate compared to that of Tra alone. Further
testing of Tra and Pon on cytotoxic CD8 T cells showed that Pon, but not Tra, blocked T cell function in
vitro, suggesting that the negative impact of Pon on T cells may partially counteract its MM-killing
synergism with Tra in vivo. Our study provides strong rational to comprehensively evaluate agents on
both MM cells and anti-MM immune cells during therapy development.

Introduction
Multiple myeloma (MM) is a plasma cell malignancy, representing 10% of hematological cancers and
about 2% of all new cancer diagnoses (SEER 2021). Although many patients have benefitted from the
introduction of immunomodulatory drugs (IMiDs), proteasome inhibitors (PIs), and monoclonal
antibodies, most patients are eventually refractory to these treatments [1]. Mutations in RAS pathway
genes (e.g. NRAS, KRAS, and BRAF) are particularly prevalent among IMiD and/or PI refractory patients:
72% of them harbor mutations in one or more of these genes [2]. As such, we recently developed and
characterized a MM mouse model, which is driven by two frequent genetic events identified in human
MM, namely MYC overexpression and oncogenic NrasQ61R (called VQ model) [3]. VQ MM mice fully
recapitulate the biological and clinical features of human high-risk MM, including hyperproliferation,
hyperactivation of MEK/ERK and AKT pathways downstream of RAS, extramedullary MM dissemination,
upregulation of PD-1 and TIGIT immune checkpoint pathways, exhaustion of CD4 and CD8 T cells, and
expression of the human UAMS-70 high-risk gene signature [3]. These MM phenotypes are serially
transplantable in syngeneic recipients. We also derived two VQ cell lines from the primary myeloma cells
for preclinical studies in vitro. In this study, we aim to develop novel target therapies using VQ MM cell
lines and validate them in recipient mice transplanted with primary VQ-D1 MM cells.

Results
Re-purpose screening identifies de novo resistance of VQ MM cells to the BCL-2 inhibitor venetoclax.

We previously showed that an FDA-approved MEK inhibitor, trametinib (Tra), killed MM cells in a dose-
dependent manner and downregulated surface PD-L1 expression in vitro [3]. In VQ-D1 MM recipient mice,
Tra reversed exhausted cytotoxic CD8 T cell phenotypes (Figure S1) and prolonged their survival [3].

                                                  Page 3/18
Therefore, we sought to identify new MEK inhibition-based combination therapies utilizing two VQ
myeloma cell lines. A high-throughput screening assay was developed in which VQ 4938 cells were
cultured in 384-well plates for 48 hours and viability was measured using the CellTiter-Glo luminescence
assay. Cells treated with Tra served as a positive control for the assay, with DMSO treated cells as the
negative control. Z’ factor for the assay was consistently greater than 0.50, indicating assay
reproducibility and consistency [4].

To expediate clinical testing, we initially focused on combining Tra with a library of 147 FDA-approved
anti-cancer drugs provided by the National Cancer Institute (AOD IX panel). VQ 4938 cells were treated
with the AOD IX panel drugs at concentrations of 100nM and 1000nM in the presence or absence of
10nM Tra (Figure 1A). Viability was measured as the relative change in luminescence compared to DMSO
treated wells. Of note, 10nM Tra alone led to ~50% viability relative to DMSO control. Viability fold
change of anti-cancer drug alone (X axis) versus viability fold change when the drug was combined with
10nM Tra (Y axis) was then plotted and analyzed via linear regression (Figure 1B). Area under the curve
represents increased efficacy of compounds when combined with Tra.

The AOD IX panel includes many drugs approved for MM treatment. Based on their initial screening
results as single agents (Table S1) and the knowledge of drug actions, these compounds were classified
as positive, false negative, or negative (Figure 1C). False negative group included cyclophosphamide, a
pro-drug that needs to be metabolized by the liver to be active in vivo [5], and IMiDs (e.g. lenalidomide),
which are known to be ineffective against murine cells due to the species difference at the cereblon
(Crbn) codon 391 [6]. Our in vitro validation of VQ response to lenalidomide (Figure S2) is consistent with
its in vivo testing in Vk*MYC mice [7].

Interestingly, VQ 4938 cells showed de novo resistance to venetoclax, with an IC50 > 1000nM in the
primary screen (Table S1). We subsequently validated this result using two VQ cell lines and a broad
range of drug concentrations (Figure 1D). Consistent with our primary screen result, the IC50 was not
reached at 16mM in both VQ cell lines and estimated to be ~20mM. Venetoclax is considered one of the
few targeted therapies for MM patients with t(11;14) translocations and/or high BCL2:BCL2L1 and
BCL2:MCL1 gene expression ratios [8]. Therefore, we investigated the expression levels of Bcl2 and Mcl1
as well as Bcl2 ratios to Bcl2l1 and Mcl1 in VQ MM cells. Not surprisingly, RNA-Seq analysis of primary
VQ MM cells and control plasma cells [3] showed that Bcl2 and Mcl1 expression levels (Figure 1E) and
both expression ratios (Figure 1F) were lower in VQ MM cells than those in control plasma cells. Together,
our data suggest that VQ MM cells may not depend on Bcl2 for survival and are thus de novo resistant to
venetoclax.

Proteasome inhibitors show limited efficacy in the VQ model.

The Positive group included PIs (e.g. bortezomib [Btz] and carfilzomib [Cfz]), HDAC inhibitors (e.g.
panobinostat and romidepsin), and several chemotherapy agents (e.g. vinblastine sulfate and vincristine
sulfate) (Fig. 1C and Table S1). Again, these results were validated using both VQ 4935 and 4938 cell

                                                  Page 4/18
lines in dose response tests (Figures S3, S4A, and S4D). In comparison to human myeloma cell lines [9],
both VQ MM cell lines displayed increased resistance to Btz and Cfz based on their IC50 values (~9nM
and ~60-70nM respectively, Figures S4A and S4D). This is in line with clinical data showing patients with
NRAS mutations have reduced Btz sensitivity [10]. Because PIs are used in all lines of MM treatment, we
further explored them in vivo. In our previous study [3], we used Btz in the VQ model as a single agent
following a treatment scheme established with the Vk*Myc model [7]. However, a significant proportion of
treated mice died soon after the treatment, suggesting that VQ MM mice may not tolerate this treatment
scheme very well. Therefore, we adjusted it based on the current clinical practice in human patients and
found that this revised scheme showed transient effectiveness in controlling VQ growth in vivo (Figure
S4B) and provided a moderate but significant increase in survival (Figure S4C).
To further boost the survival benefit, we used Cfz as part of a combination therapy regimen with
dexamethasone (Dex), Tra, and GSK525762 (GSK), a pan-BET inhibitor [11]. We previously showed that
combined Tra and GSK prolonged the survival of VQ MM mice better than single agents alone [3]. In this
new combination treatment, Cfz and Dex were administered once a week for two weeks, followed by one
week of daily treatment with Tra and GSK. Although combo therapy slowed VQ growth after the first
treatment cycle (Figure S4E), it did not significantly prolong the survival of VQ-bearing mice (Figure S4F).
Overall, our data show that PIs only provide short-term disease control in the VQ model.
Combination trametinib and ponatinib treatment are synergistic against VQ myeloma cells in vitro.
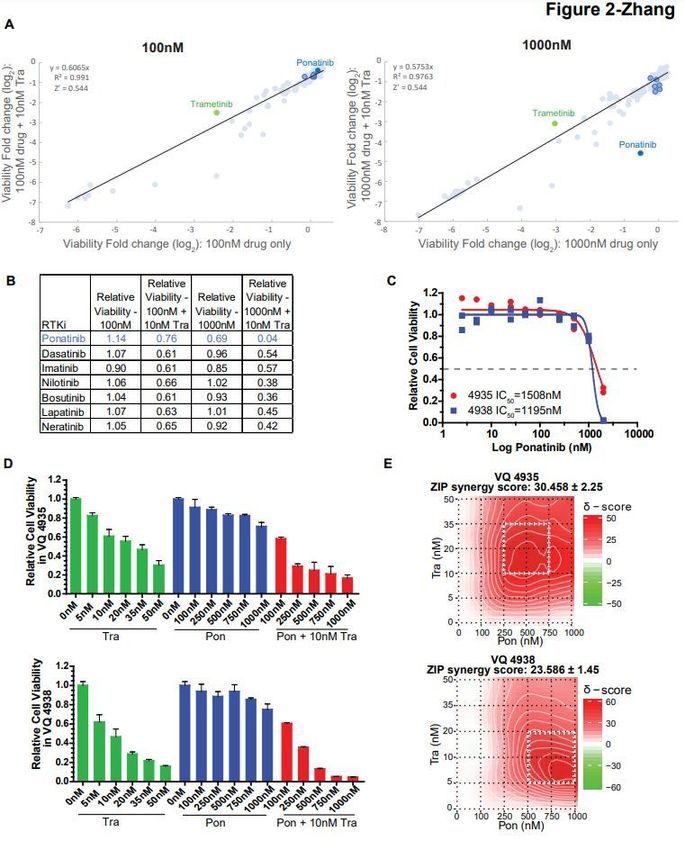
Screening of the AOD IX panel identified 1000nM ponatinib (Pon) as having high synergy with Tra
against VQ myeloma cells (Figure 2A and 2B). Pon is a multi-tyrosine kinase inhibitor (TKI) currently
approved for second-line treatment of chronic myeloid leukemia and Philadelphia chromosome-positive
acute lymphoblastic leukemia [12]. Interestingly, no significant efficacy was observed for other TKIs as
single agents or in combination with Tra (Figures 2A and 2B). Although dose-response testing of VQ 4935
and 4938 cell lines confirmed that Pon had limited effect as a single agent (Figure 2C), it showed strong
synergy with Tra against both VQ cell lines based on ZIP delta score analysis [13] (Figure 2D and 2E) and
Combination Index calculation [14] (Figure S5). Of note, this synergy appeared to be more prominent at
higher concentrations of Pon (>250nM).
Combination trametinib and ponatinib significantly prolongs survival of VQ mice in two different
treatment regimens.
Because Pon is available as an oral drug in clinic and has not been evaluated in MM before, it was of
interest to determine its in vivo efficacy alone and in combination with Tra. VQ-D1 MM cells were
transplanted into sub-lethally irradiated recipient mice as previously described.3 Once MM was
established, recipients were divided into 4 groups with comparable gamma-globulin to albumin (G/A)
ratios and similar complete blood count (CBC) parameters and treated with vehicle, Tra, Pon, and
combined Tra and Pon (Figure 3A and S6). Twenty-one days after treatment, all four groups of mice
showed increased but indistinguishable G/A ratios (Figure 3B) and the overall CBC results were
Page 5/18unchanged (Figure S6). Consistent with our in vitro analysis, Pon treatment did not prolong the survival of
VQ-D1 MM mice, while both Tra and combined Tra and Pon treatments did (Figure 3C). Although
combination treated mice had the longest overall survival, we did not observe significant difference
between Tra- and Tra/Pon-treatment groups.
We subsequently sought to determine if increasing the Tra dosage would significantly prolong the
survival of Tra/Pon treated mice. To combat against the potential cumulative toxicity associated with
higher Tra dose, we also took the 3-week on and 1-week off schedule as in myeloma patient treatment. In
a second in vivo experiment, recipients were divided into 3 groups with comparable G/A and CBC
parameters and then treated with vehicle, Tra alone, or combination Tra/Pon in 28-day cycles (Figure 3D).
Once again, no significant difference was observed in G/A ratios between groups after one treatment
cycle (Figure 3E). Interestingly, although no survival benefit was observed with single agent Tra treatment,
combo treated mice had significantly prolonged survival compared to the vehicle-treated group (Figure
3F).
Ponatinib, but not trametinib, inhibits CD8 T cell proliferation and activation in vitro.
We investigated if the discrepancy between in vitro and in vivo combo treatment outcomes results from
the drug effects on cytotoxic CD8 T cells, which play an important role in anti-MM immunity [15]. To test
this idea, CD8 T cells were isolated from spleens of wildtype B6 mice, stained with CFSE dye, and
activated via α-CD3/α-CD28 antibodies in the presence of Tra or Pon for 48 hours (Figure 4A). Tra
treatment did not cause significant reduction in T cell proliferation as measured by CFSE tracing (Figure
4B) and T cell activation as demonstrated by surface expression of CD69, DNAM-1, and PD-1 (Figure 4C-
E). By contrast, Pon treatment completely inhibited T cell proliferation and activation (Figure 4B and 4C).
Our results are consistent with prior studies showing that ponatinib and related BCR-ABL TKIs (e.g.
dasatinib, imatinib) impair T cell function and viability in a dose-dependent manner [16–18].
Discussion
While the introduction of IMiDs, PIs and monoclonal antibody treatments has revolutionized MM therapy,
most patients still develop drug-refractory disease and eventually die of myeloma [1]. RAS pathway
hyperactivation is a common molecular event in progressive myeloma, with almost 75% of drug-
refractory myeloma patients harboring mutations in NRAS, KRAS, or BRAF [2]. In this study, our group
used the recently developed VQ model of high-risk myeloma as a platform to develop new treatment
regiments. To assess the effectiveness of existing MM therapies against VQ myeloma and expedite
clinical testing, we carried out a re-purpose screen of 147 FDA approved anti-cancer compounds against
VQ cells in vitro (Figure 1A). We found that VQ cells showed de novo resistance to venetoclax (Figure 1D),
likely owing to low Bcl2:Bcl2l1 and Bcl2:Mcl1 gene expression ratios (Figure 1F) [8]. In addition, VQ cells
showed increased resistance to Btz (Figure S4A) and Cfz (Figure S4D) compared to human MM cell lines
in vitro [9]. Limited response to PI treatment was also observed in vivo, either as single agent (Figure S4C)
Page 6/18or as part of multi-drug treatment regimen (Figure S4F). This is not altogether unexpected, as resistance to single agent Btz has been observed in patients harboring NRAS mutations [10]. As a single agent, Tra displays dual effects on MM cells and T cells. Tra kills MM cells in a dose- dependent manner and downregulates surface PD-L1 expression in vitro [3]. Tra treatment of purified splenic CD8 T cells in vitro did not significantly impact on their proliferation (Figure 4B) and activation (Figure 4C-4E). These in vitro T cell results are consistent with our prior study that downregulation of RAS/ERK signaling in Kras−/− T cells does not affect CD8 T cell-mediated anti-leukemia activity in vivo [19]. In VQ-D1 MM recipients, Tra reversed exhausted cytotoxic CD8 T cell phenotypes (Figure S1) and prolonged their survival [3]. Of note, low dose, continuous Tra treatment (Figure 3C) worked better than high dose, on/off Tra treatment in vivo (Figure 3F). This observation is consistent with cancer patients treated with Tra [20]. Interestingly, among all the TKIs in the AOD IX panel, only Pon showed moderate cell killing at 1mM as single agent (Figure 2B) and strong synergism with Tra at concentrations above 250nM (Figure 2D and 2E). The difference between Pon and other TKIs may be due to their differential targeting profiles. Unlike other TKIs in this screen, Pon is a potent pan-FGFR inhibitor with IC50 values
Animals and approved by an Animal Care and Use Committee at UW-Madison. The program is accredited
by the Association for Assessment and Accreditation of Laboratory Animal Care. All animal experiments
in this study are reported in accordance with ARRIVE guidelines (https://arriveguidelines.org).

Drug screening of VQ cell lines

The Approved Oncology Drugs (AOD) IX drug panel was provided to the University of Wisconsin-Madison
(UW-Madison) by the National Cancer Institute’s Division of Treatment & Diagnosis. Dilution and
preparation of the AOX IX panel in 384 well plates was carried out by UW-Madison’s Small Molecule
Screening Facility (SMSF).

VQ 4935 and 4938 cell lines were cultured in IMDM (Corning, 15-016-CM) containing 10% FBS (Gibco, Cat
No. 16000), 1X antibiotics, and 10ng/ml human recombinant IL6 (PeproTech, 200-06) at 37℃. They were
seeded 50 uL/well at a density of 5x10⁵ cells/ml in a 384-well plate using a MicroFlo Select Reagent
Dispenser (BioTek). 48 hours later, cell viability was evaluated using CellTiter-Glo assay (Cat No. G7573,
Promega). Chemiluminescence was measured using an ENSPIRE Plate Reader (Perkin Elmer). Z’ Factor
was calculated as previously described [4].

IC50 values were calculated via logistic regression with variable slope using GraphPad Prism v9.2.0
software.

Drug Combination Studies

Drug combination studies were set up using a 5x5 matrix design around IC50 of each drug in VQ 4935
and 4938 cell lines. Synergy was calculated using ZIP delta score via the SynergyFinder online tool
(https://synergyfinder.fimm.fi) [13]. Combination Index scores were calculated using Compusyn v1.0
software as previously described [14].

Transplantation of myeloma cells

Donor cells from two moribund VQ-D1 MM bearing mice were pooled equally and resuspended in 100 μl
of PBS containing 2% mouse serum (Jackson ImmunoResearch, 015-000-120). Eight- to fourteen-week-
old CD45.1+ recipient mice were sub-lethally irradiated at 4.0 Gy using an X-RAD 320 Irradiator (Precision
X-Ray Inc.) and transplanted with 5x10⁵ of donor cells via intracardiac injection.

Serum protein electrophoresis (SPEP)

Mice were retro-orbitally bled with plain micro hematocrit tubes (Bris, ISO12772). Blood samples were
spun in microtainer tubes (BD, 365967) at 4,000x g for 10 minutes to collect serum. Serum was loaded
into Hydragel agarose gel (Sebia, 4140) and processed using the Hydrasys instrument (Sebia) following
the manufacturer’s instruction. The processed film was scanned and pixel density of Albumin and γ-
globulin bands were quantified using Adobe Photoshop.

                                                  Page 8/18
Complete blood count
Peripheral blood samples were collected via retro-orbital bleeding and analyzed with a Hemavet 950FS
(Drew Scientific).
Small compound treatment
For in vivo bortezomib treatment, bortezomib (Selleck) was dissolved in sterile PBS and administered at
0.5mg/kg twice a week for four weeks via intra-peritoneal (IP) injection.
For in vivo treatment of carfilzomib, dexamethasone, trametinib, and GSK525762, carfilzomib (Selleck)
was dissolved in sterile PBS and administered at 16mg/kg once a week via IP injection for two weeks.
Dexamethasone (Selleck) was dissolved in sterile PBS and administered at 1mg/kg once a week via IP
injection for two weeks. Trametinib (Chemitek) was dissolved in 0.5% hydroxypropylmethylcellulose
(Sigma) and 0.2% Tween-80 (Sigma) in distilled water (pH 8.0) and given orally at 0.5mg/kg every
morning for one week. GSK525762 (Chemitek) was dissolved in 1% methylcellulose (Sigma) containing
0.2% SDS and given orally at 15mg/kg every evening for one week.
For in vivo treatment of trametinib and ponatinib, both compounds were dissolved in 0.5%
hydroxypropylmethylcellulose (Sigma) and 0.2% Tween-80 (Sigma) in distilled water (pH 8.0) and
administered at 0.2mg/kg and 10.0mg/kg respectively, via oral gavage daily. In a second treatment
experiment, trametinib and ponatinib were dissolved in 0.5% hydroxypropylmethylcellulose (Sigma) and
0.2% Tween-80 (Sigma) in distilled water (pH 8.0) and administered at 0.5mg/kg and 10.0mg/kg,
respectively, in 28 day cycles with 21 days of treatment followed by 7 days of rest.
Mice were not allocated to treatment groups in a blinded manner but were instead allocated so that G/A
and CBC parameters were statistically similar between each group (One-way Analysis of Variance with
Tukey-Kramer test). Small compounds were not administered to animals in a blinded manner due to
necessary daily preparation of working concentrations for treatment. Animal care staff were blinded to
experimental groups during animal assessment. Post-experiment data analysis was not blinded.
CD8 T cell activation assay
CD8 T cells were purified from total splenocytes of 8-14 weeks old C57BL/6J mice using the Mouse
CD8α+ T Cell Isolation Kit (Miletnyi Biotec, 130-104-75) and labeled with CFSE (eBioscience, 65-0850-84)
as described [24]. CD8 T cells were cultured in RPMI-1640 (Corning, 15-041-CV) containing 10% FBS, 1X
Antibiotics, 1X GlutaMAX (Gibco, 35050061), 1X MEM non-essential amino acids solution (Gibco,
11140050), 1mM Sodium Pyruvate (Gibco, 11360070), and 50µM 2-Mercaptoethanol (Gibco, 21985-23).
T cells were activated in the presence or absence of trametinib and ponatinib using plate-bound α-CD3
(eBioscience, 17A2; 50µL of 10µg/mL solution incubated at 4˚C overnight) and soluble α-CD28
(eBioscience, 17A2; 5µg/mL) for 48 hours prior to analysis.
Flow cytometric analysis of hematopoietic tissues
Page 9/18Flow cytometric analysis of surface antigens on hematopoietic cells was performed as previously described [25]. Stained cells were analyzed on a LSRII Fortessa (BD Biosciences). Directly conjugated antibodies specific for the following mouse surface antigens were purchased from Biolegend unless specified: CD3(17A2), CD4 (eBioscience, GK1.5), CD8 (eBioscience, 53-6.7), CD62L(MEL-14), CD44(IM7), PD1 (29F.1A12), TIGIT(GIGD7), LAG3(C9B7W), DNAM-1(TX42.1), CD69 (eBioscience, H1.2F3). Statistics For Kaplan–Meier survival curves, survival differences between groups were assessed with the log-rank test, assuming significance at p
Technical or material support: B. Kingstad-Bakke, M. Suresh

Study supervision: J. Zhang

Competing Interests:

We declare that no conflict of interest exists.

References
  1. Nijhof, I. S., van de Donk, N. W. C. J., Zweegman, S. & Lokhorst, H. M. Current and New Therapeutic
     Strategies for Relapsed and Refractory Multiple Myeloma: An Update. Drugs 78, 19–37 (2018).
  2. Kortüm, K. M. et al. Targeted sequencing of refractory myeloma reveals a high incidence of
     mutations in CRBN and Ras pathway genes. Blood 128, 1226–1233 (2016).
  3. Wen, Z. et al. Expression of NrasQ61R and MYC transgene in germinal center B cells induces a highly
     malignant multiple myeloma in mice. Blood 137, 61–74 (2021).
  4. Zhang, J.-H. & Oldenburg, K. R. Z-Factor. in Encyclopedia of Cancer (ed. Schwab, M.) 3227–3228
     (Springer, 2009). doi:10.1007/978-3-540-47648-1_6298.
  5. Swan, D., Gurney, M., Krawczyk, J., Ryan, A. E. & O’Dwyer, M. Beyond DNA Damage: Exploring the
    Immunomodulatory Effects of Cyclophosphamide in Multiple Myeloma. Hemasphere 4, e350 (2020).
  6. Fink, E. C. et al. CrbnI391V is sufficient to confer in vivo sensitivity to thalidomide and its derivatives
     in mice. Blood 132, 1535–1544 (2018).
  7. Chesi, M. et al. Drug response in a genetically engineered mouse model of multiple myeloma is
     predictive of clinical efficacy. Blood 120, 376–385 (2012).
  8. Kumar, S. et al. Efficacy of venetoclax as targeted therapy for relapsed/refractory t(11;14) multiple
     myeloma. Blood 130, 2401–2409 (2017).
  9. Besse, A. et al. Proteasome Inhibition in Multiple Myeloma: Head-to-Head Comparison of Currently
    Available Proteasome Inhibitors. Cell Chemical Biology 26, 340-351.e3 (2019).
10. Mulligan, G. et al. Mutation of NRAS but not KRAS significantly reduces myeloma sensitivity to
    single-agent bortezomib therapy. Blood 123, 632–639 (2014).
11. Mirguet, O. et al. Discovery of epigenetic regulator I-BET762: lead optimization to afford a clinical
    candidate inhibitor of the BET bromodomains. J Med Chem 56, 7501–7515 (2013).
12. Tan, F. H., Putoczki, T. L., Stylli, S. S. & Luwor, R. B. Ponatinib: a novel multi-tyrosine kinase inhibitor
    against human malignancies. Onco Targets Ther 12, 635–645 (2019).
13. Ianevski, A., He, L., Aittokallio, T. & Tang, J. SynergyFinder: a web application for analyzing drug
    combination dose–response matrix data. Bioinformatics 33, 2413–2415 (2017).
14. Chou, T.-C. Drug combination studies and their synergy quantification using the Chou-Talalay
    method. Cancer Res 70, 440–446 (2010).

                                                   Page 11/18
15. D’Souza, C., Prince, H. M. & Neeson, P. J. Understanding the Role of T-Cells in the Antimyeloma Effect
of Immunomodulatory Drugs. Frontiers in Immunology 12, 594 (2021).
16. Marinelli Busilacchi, E. et al. Immunomodulatory Effects of Tyrosine Kinase Inhibitor In Vitro and In
Vivo Study. Biol. Blood Marrow Transplant. 24, 267–275 (2018).
17. Weichsel, R. et al. Profound inhibition of antigen-specific T-cell effector functions by dasatinib. Clin
Cancer Res 14, 2484–2491 (2008).
18. Leonard, J. T. et al. Concomitant use of a dual Src/ABL kinase inhibitor eliminates the in vitro
efficacy of blinatumomab against Ph+ ALL. Blood 137, 939–944 (2021).
19. Luo, L. et al. Kras-deficient T cells attenuate graft-versus-host disease but retain graft-versus-
leukemia activity. J Immunol 205, 3480–3490 (2020).
20. Zeiser, R., Andrlová, H. & Meiss, F. Trametinib (GSK1120212). in Small Molecules in Oncology (ed.
Martens, U. M.) 91–100 (Springer International Publishing, 2018). doi:10.1007/978-3-319-91442-8_7.
21. Gozgit, J. M. et al. Ponatinib (AP24534), a Multitargeted Pan-FGFR Inhibitor with Activity in Multiple
FGFR-Amplified or Mutated Cancer Models. Mol Cancer Ther 11, 690–699 (2012).
22. Kalff, A. & Spencer, A. The t(4;14) translocation and FGFR3 overexpression in multiple myeloma:
prognostic implications and current clinical strategies. Blood Cancer Journal 2, e89–e89 (2012).
23. García-Gutiérrez, V. & Hernández-Boluda, J. C. Tyrosine Kinase Inhibitors Available for Chronic
Myeloid Leukemia: Efficacy and Safety. Front Oncol 9, 603 (2019).
24. Quah, B. J. C. & Parish, C. R. The Use of Carboxyfluorescein Diacetate Succinimidyl Ester (CFSE) to
Monitor Lymphocyte Proliferation. JoVE (Journal of Visualized Experiments) e2259 (2010)
doi:10.3791/2259.
25. Wang JY, Liu YG, Li ZY, et al. Endogenous oncogenic Nras mutation leads to aberrant GM-CSF
signaling in granulocytic/monocytic precursors in a murine model of chronic myelomonocytic
leukemia. Blood. 2010;116(26):5991–6002.
Figures
Page 12/18Figure 1
Re-purpose screening identifies de novo resistance of VQ MM cells to venetoclax. (A) Schematic of drug
screening procedure against VQ myeloma cells. (B) AOD IX screening results for compounds at 100nM
and 1000nM concentration alone or in the presence of 10nM Trametinib. Results are plotted as Log2 fold
change in viability relative to DMSO-treated control wells as measured by CellTiter-Glo Luminescent
Assay after 48 hours of treatment. Notable compounds are highlighted-see accompanying tables in panel
Page 13/18C. (C) Table detailing selected positive, false negative, and true negative hits from the AOD IX library as highlighted in (B). (D) VQ 4935 and 4938 cells were treated with the indicated concentration of venetoclax for 48 hours. Relative viability to DMSO treated control was then measured using the CellTiter-Glo assay. IC50 values were calculated by logistic regression using the GraphPad Prism software. (E) Transcript levels of anti-apoptotic genes BCL2 and MCL1 in CD138+ B220- cells from control bone marrow (BM) or VQ recipient BM. FPKM, Fragments Per Kilobase of transcript per Million mapped reads. (F) Ratios of Bcl2:Bcl2l1 and Bcl2:Mcl1 gene expression levels. Results are presented as mean + SD. *, p
Figure 2

Ponatinib, but not other TKIs, synergizes with trametinib in vitro. (A) Relative viability results for tyrosine
kinase inhibitors (TKIs) from AOD IX panel at 100nM and 1000nM concentration alone or in the presence
of 10nM trametinib, as in Figure 1A. (B) Screening results of TKIs as single agents and with 10nM
trametinib. Trametinib and Ponatinib are highlighted as in Figure 2A. Of note, 10nM trametinib yielded
~50% viability relative to DMSO control. (C-E) VQ 4935 and 4938 cells were treated with the indicated
                                                   Page 15/18
concentrations of two compounds for 48 hours. Relative viability to DMSO treated control was then measured using the CellTiter-Glo assay. (C) Dose-response results for ponatinib against VQ 4935 and 4938 cell lines. IC50 values were calculated by logistic regression using the GraphPad Prism software. (D) Selected viability results for combination treatment of trametinib (Tra) and ponatinib (Pon) against VQ 4935 and 4938 cells. (E) ZIP synergy plots of Tra and Pon in VQ 4935 and 4938 cells. Zip Synergy scores were generated using the SynergyFinder online tool. Figure 3 Combination trametinib and ponatinib treatment prolongs VQ myeloma survival. (A) Schematic of pre- clinical treatment groups and in vivo drug dosages. Mice were treated with the indicated compounds daily as described in Materials and Methods. (B) Serum protein electrophoresis was performed to quantify the γ-globulin/Albumin (G/A) ratios in VQ recipient mice before treatment and at day 21 of treatment. Note: Two Vehicle-treated recipients were found dead and unable to be analyzed. (C) Kaplan- Meier survival curves were plotted against days after treatment. Log-rank test was performed. (D) Schematic of pre-clinical treatment groups and in vivo drug dosages. Mice were treated with the indicated compounds in 28-day cycles (3-weeks on and one-week off) as described in Materials and Methods. (E) Serum protein electrophoresis was performed to quantify the G/A ratios in VQ recipient mice before treatment (Pre) and at day 21 of treatment. Note: One Vehicle-treated recipient was found dead and unable to be analyzed. (F) Kaplan-Meier survival curves were plotted against days after treatment. Log- rank test was performed. Note: One vehicle-treated animal was euthanized for reasons unrelated to treatment study and was excluded from analysis. *, p
Figure 4

Ponatinib, but not trametinib, blocks CD8 T cell proliferation and activation in vitro. (A) Experimental
schematic for CD8 T cell proliferation and activation assay. CD8 T cells isolated from the spleens of
C57BL/6J mice were stained with CFSE and cultured in the presence of plate-bound α-CD3 and soluble α-
CD28, along with the indicated concentrations of trametinib and ponatinib, for 48 hours. Cells were then
analyzed using flow cytometry. Statistical differences between multiple groups were determined via one-
                                                  Page 17/18
way ANOVA with Tukey’s post-test analysis. (B) Proliferation Index was calculated for each group via FCS Express v7.08 software. (C-E) Quantification of CD69+ (C), DNAM-1+ (D), and PD-1+ (E) CD8 T cells. Results are presented as mean + SD. *, p
You can also read