Unilever Q1 2022 Trading Statement - Alan Jope & Graeme Pitkethly 28th April 2022
←
→
Page content transcription
If your browser does not render page correctly, please read the page content below
Unilever Q1 2022 Trading
Statement

Alan Jope & Graeme Pitkethly

28th April 2022
Safe harbour statement

This presentation may contain forward-looking statements, including ‘forward-looking statements’ within the meaning of the United States Private Securities
Litigation Reform Act of 1995. Words such as ‘will’, ‘aim’, ‘expects’, ‘anticipates’, ‘intends’, ‘looks’, ‘believes’, ‘vision’, or the negative of these terms and other similar
expressions of future performance or results, and their negatives, are intended to identify such forward-looking statements. Forward-looking statements also include,
but are not limited to, statements and information regarding the Unilever Group’s (the ‘Group’) emissions reduction targets and other climate change related matters
(including actions, potential impacts and risks associated therewith). These forward-looking statements are based upon current expectations and assumptions
regarding anticipated developments and other factors affecting the Group. They are not historical facts, nor are they guarantees of future performance or outcomes.

Because these forward-looking statements involve risks and uncertainties, there are important factors that could cause actual results to differ materially from those
expressed or implied by these forward-looking statements. Among other risks and uncertainties, the material or principal factors which could cause actual results to
differ materially are: Unilever’s global brands not meeting consumer preferences; Unilever’s ability to innovate and remain competitive; Unilever’s investment choices
in its portfolio management; the effect of climate change on Unilever’s business; Unilever’s ability to find sustainable solutions to its plastic packaging; significant
changes or deterioration in customer relationships; the recruitment and retention of talented employees; disruptions in our supply chain and distribution; increases or
volatility in the cost of raw materials and commodities; the production of safe and high quality products; secure and reliable IT infrastructure; execution of
acquisitions, divestitures and business transformation projects; economic, social and political risks and natural disasters; financial risks; failure to meet high and
ethical standards; and managing regulatory, tax and legal matters. A number of these risks have increased as a result of the current Covid-19 pandemic.

These forward-looking statements speak only as of the date of this document. Except as required by any applicable law or regulation, the Group expressly disclaims
any obligation or undertaking to release publicly any updates or revisions to any forward-looking statements contained herein to reflect any change in the Group’s
expectations with regard thereto or any change in events, conditions or circumstances on which any such statement is based.

Further details of potential risks and uncertainties affecting the Group are described in the Group’s filings with the London Stock Exchange, Euronext Amsterdam and
the US Securities and Exchange Commission, including in the Unilever Annual Report and Accounts 2021.

                                                                                                                                                                                   2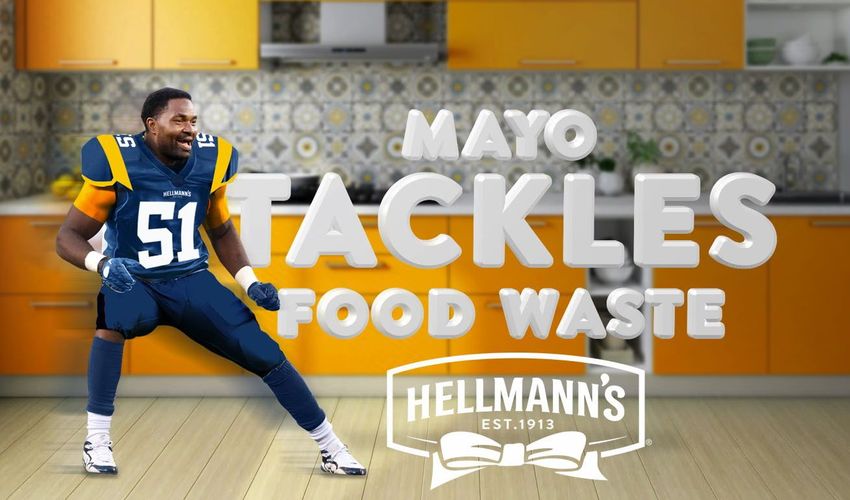
Alan Jope
Unilever Q1 2022 Trading Statement

28th April 2022

Contents

  Q1 2022 Overview & Strategic Priorities   Alan Jope

  Q1 2022 Results & Outlook                 Graeme Pitkethly

                                                               4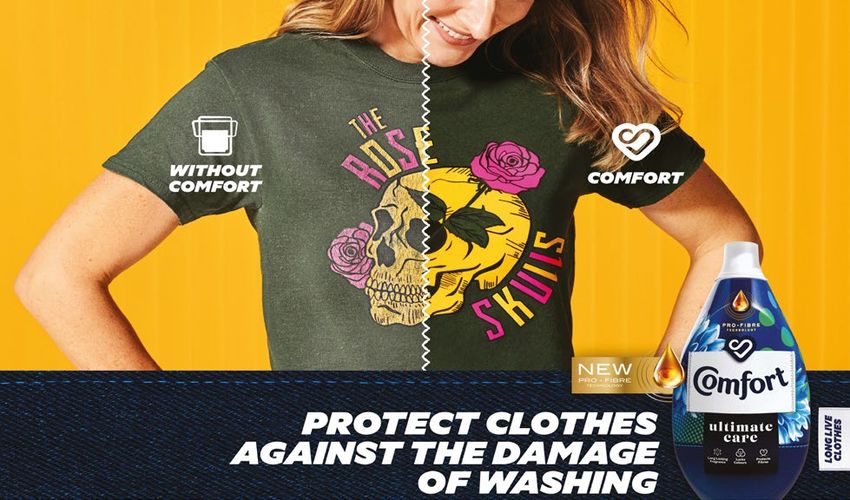
Challenging operating environment

    Heightened Inflation                Russia / Ukraine              Covid Continues

                                  •   Focused on employee
                                      safety
•   Significantly increased Net
                                                                •   Recent China lockdowns
    Material Inflation
                                  •   We will not profit from
                                      Russia

                                                                                             5
Q1 2022 Delivery

                                                                                      Competitive
                Q1 Growth                       Pricing Growth
                                                                                        Growth

     Underlying Sales Growth                                                8.3%

                   7.3%
                                                                     4.9%

                                                              4.1%
                                                                                         58%
                                                       1.6%                        % Business Winning MAT1

                     -1%                 0.3%
                                                1.0%

   Underlying Volume Growth              FY'20 Q1'21 Q2'21 Q3'21 Q4'21 Q1'22

1Moving   Annual Total / Last 52 weeks                                                                       6
Five clear strategic priorities

 1.             2.                 3.            4.             5.

                   Move           Accelerate      Lead in     Purpose -led,
 Win with
              portfolio into      USA, India,   channels of     future-fit
brands and
               high growth        China and      the future   organisation
innovation
                  spaces             EMs                        & culture

                                                                              7
Five clear strategic priorities

 1.             2.                 3.            4.             5.

                   Move           Accelerate      Lead in     Purpose -led,
 Win with
              portfolio into      USA, India,   channels of     future-fit
brands and
               high growth        China and      the future   organisation
innovation
                  spaces             EMs                        & culture

                                                                              8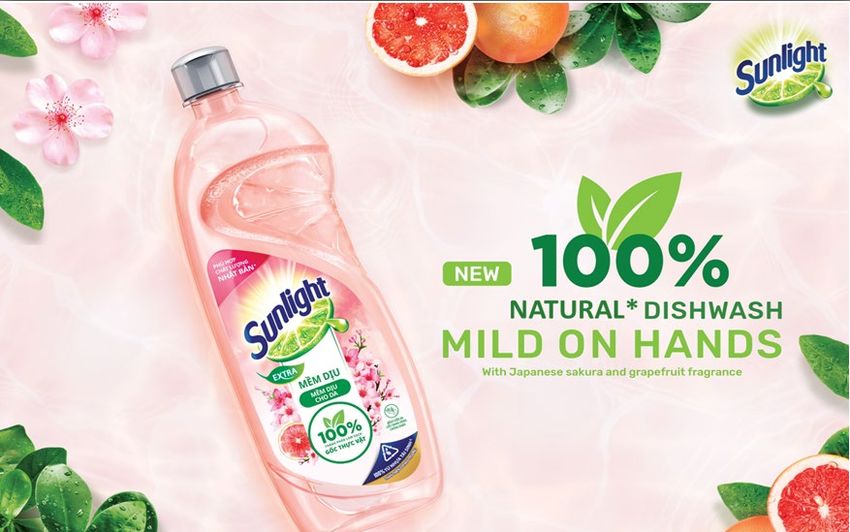
1. Winning with our brands

        13
    €1bn+ brands

      51%
     of turnover

     8.8%
      Q1’22 USG

                             9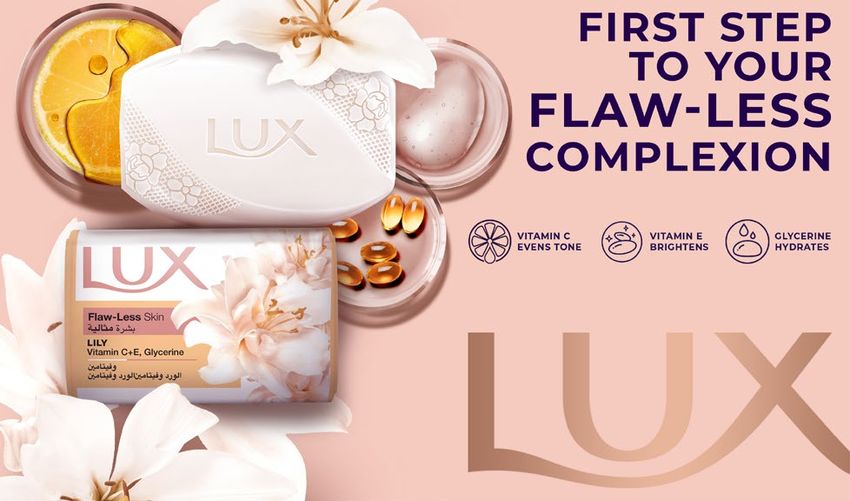
1. Winning with our brands

            Bigger, better innovations and product superiority

 Beauty & Personal Care         Foods & Refreshment                  Home Care

      Positive Beauty                 Future Foods                   Clean Future

• Superior product, winning   • Rich in flavour, zero salt   • Naturally derived cleaning
  proposition                                                  enzymes

• 98% biodegradable           • Supports transition to       • Superior cleaning at lowest
  formulation                   healthier nutrition            washing temperatures
                                                                                             10
Five clear strategic priorities
1. 2. 3. 4. 5.
Move Accelerate Lead in Purpose -led,
Win with
portfolio into USA, India, channels of future-fit
brands and
high growth China and the future organisation
innovation
spaces EMs & culture
112. Portfolio change
Total Acquisitions High Growth Spaces
Q1 ‘22 USG contribution
(bps contribution to Q1 ‘22 USG from Prestige Beauty Functional Nutrition1
acquisitions since ‘17)
USG Q1 14% USG Q1 18%
7.3%
USG
0.8%
acquisitions
USG excl.
acquisitions
6.5%
1Health
12
Food Drinks + Vitamins, Minerals & SupplementsFive clear strategic priorities
1. 2. 3. 4. 5.
Move Accelerate Lead in Purpose -led,
Win with
portfolio into USA, India, channels of future-fit
brands and
high growth China and the future organisation
innovation
spaces EMs & culture
133. Accelerating in USA, India and China
€9.9bn €5.6bn €3.3bn
FY’21 TO FY’21 TO FY’21 TO
USG%
Q1 ‘22 8.9% 10.4% 6.4%
USG%
Q1 ‘21 4.7% 21.4% 30.9%
9.9 5.6 3.3
FY Turnover
Growth 8.3
4.6 2.6
(€bn)
FY '18 FY '19 FY '20 FY '21 FY '18 FY '19 FY '20 FY '21 FY '18 FY '19 FY '20 FY '21
14Five clear strategic priorities
1. 2. 3. 4. 5.
Move Accelerate Lead in Purpose -led,
Win with
portfolio into USA, India, channels of future-fit
brands and
high growth China and the future organisation
innovation
spaces EMs & culture
154. Channels - eCommerce
27% Channel-specific Innovation
Q1 2022 eCom growth
Omni Pure play eB2B
+5% +8% +67%
eCom TO contribution
14%
2%
'16 '17 '18 '19 '20 '21 Q1 '22
16Five clear strategic priorities
1. 2. 3. 4. 5.
Move Accelerate Lead in Purpose -led,
Win with
portfolio into USA, India, channels of future-fit
brands and
high growth China and the future organisation
innovation
spaces EMs & culture
175. A new, future-fit organisation
• Simpler, faster, more agile Unilever Corporate Centre
• More category-focus
Business
Groups
Beauty & Personal Home
Nutrition Ice Cream
Wellbeing Care Care
• Greater empowerment and
accountability
• On track for July 2022 Unilever Business Operations
18Graeme Pitkethly
Q1 2022 Results
28th April 2022
19Underlying Sales Growth
Results summary
7.3% -1% 8.3%
Q1 USG Q1 UVG Q1 UPG USG 5.7% 5.0% 2.5% 4.9% 7.3%
• A solid quarter, with a strong
topline across all divisions UPG 8.3%
• Landing pricing in response to UVG
further rises in input costs
-1%
• Carefully managing volume
impact around the business
Q1'21 Q2'21 Q3'21 Q4'21 Q1'22
20Regional growth by quarter
Asia / AMET / RUB Latin America
€7bn TO €2bn TO
9.8%
9.9% 9.1% 8.5%
USG
11.9%
5.7% 5.7% 8.7%
2.3% 7.2%
UPG 8.5% 16.4%
UVG
0.5%
-5.7%
Q1'21 Q2'21 Q3'21 Q4'21 Q1'22 Q1'21 Q2'21 Q3'21 Q4'21 Q1'22
North America Europe
€3bn TO €3bn TO
USG 8.5% 0.7%
6.5%
4.3% 4.0%
UPG 1.1% 2.0% 6.6% 0.3%
5.4%
UVG
1.8% -4.4%
-2.3% -0.8%
Q1'21 Q2'21 Q3'21 Q4'21 Q1'22 Q1'21 Q2'21 Q3'21 Q4'21 Q1'22
21Q1 2022: Turnover growth
+11.8%
A&D 0.6%
USG 7.3% 3.5%
0.7%
(0.1)%
8.3%
€13.8bn
(1)% €13.5bn
€12.3bn
22Beauty & Personal Care
Growth Segments Growth Channels
7.1% (0.3)% 7.4%
Q1 USG Q1 UVG Q1 UPG
• Pricing accelerated across all
categories
Best 72-hour protection Clear China relaunch
• Some volume impact in Hair and
Growth Geographies Purposeful Brands
Skin Cleansing
• Another strong quarter for
Prestige, with double digit growth
New Lux bars Dove deodorant relaunch
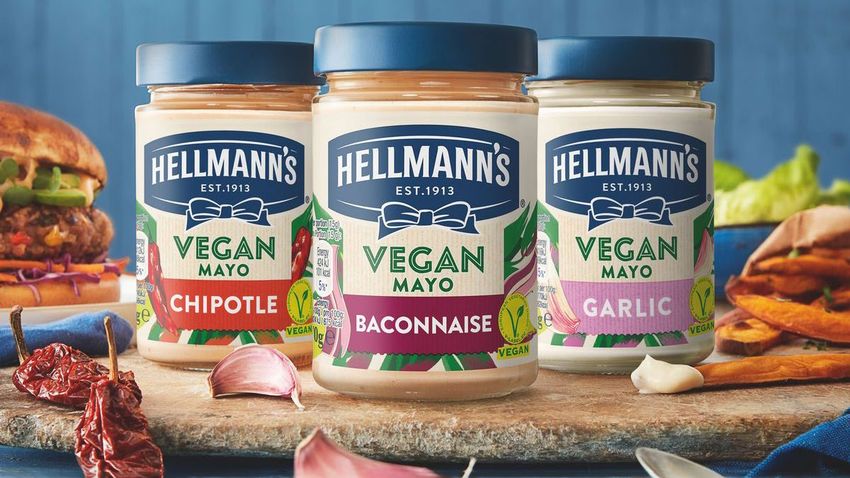
23Foods & Refreshment
Growth Segments Growth Channels
6.5% (0.6)% 7.1%
Q1 USG Q1 UVG Q1 UPG
• Good In-home growth off a strong
comparator
• Hellmann’s double digit growth;
Knorr and Magnum high single- Plant-based alternatives The Vegetarian Butcher
digit
Growth Geographies Purposeful Brands
• Food service now back above pre-
Covid-19 (+8% vs 2019)
• Strong Out of Home Ice Cream
momentum
Value and health Hellmann’s ‘reduce food waste’
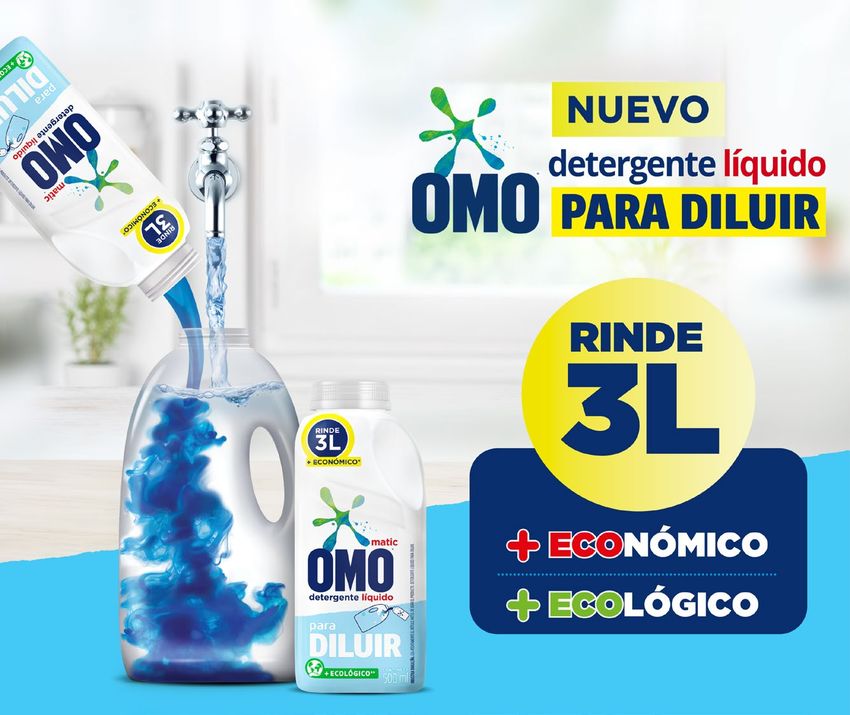
24Home Care
9.2% (2.9)% 12.5%
Growth Segments Growth Channels
Q1 USG Q1 UVG Q1 UPG
• Double digit growth in Fabric
Cleaning, led by price
• Fabric Enhancers off to a solid Superior fabric conditioner Comfort fragrance beads China
start in key markets
Growth Geographies Purposeful Brands
• Clean Future innovations landing
across markets
• Home & Hygiene lapping a high
base (+10% up on 2019)
Bio-surfactant hand dishwash OMO’s 90% plastic reduction
25Further inflationary pressure
March vs January
50%
35%
32% 33%
30%
21%
16%
12% 13%
11%
5%
0%
-6%
-9%
Based on average spot prices 26
Source: Reuters, World Bank Pink SheetsCommodities at the top-end of 10-year trading ranges
Mar ’22
UL commodity basket 10-year ranges index
(Proportion of ‘21 spend by commodity group) (avg. spot price for each period)
(vs ’20 at 100)
2013 2014 2015 2016 2017 2018 2019 2020 2021 Jan‘22 Feb‘22 Mar‘22
1,777
1,522
Crude 1,345
Palm ~€2.5bn Palm 871 837
1,131
236
663 736 751 639 752
Crude Palm and Palm Kernel ($/mt) 601
2,443 2,441
2,196
Agriculture excl. Palm Palm
Kernel 1,301 1,288
1,533
296
~€4.5bn ($/mt) 897
1,120
903 926
665 824
Soybean Oil, grains,
vegetables, sugar, starch,
1,957
fruit, tea, coffee, dairy Soybean 1,470 1,596
1,385
Oil 1,055 234
($/mt) 906 815 850 789 765 838
756
Crude Derivatives
~€5bn 116
109
Resin packaging, Brent
99
86
96
petrochemicals Crude
52 54
71 64 70 273
($/bbl)
44 42
Others ~€5bn
3,498
Chemicals, flavours, 3,006
3,246
fragrances, cartons, Aluminium
($/mt)
1,847 1,867 1,968 2,108
2,473
205
1,794
aluminium 1,665 1,604 1,704
27
Source: World Bank Pink SheetsUnprecedented levels of inflation
Expect margins to be restored during 2023 and 2024
GM (bps) (150) 100 (30) (160) 30 110 10 80 50 60 50 30 (55) (120)
UPG% 6.5
6.4 8.3% Q1 10.0
6.36.2
6.1 7.2% 9.0%
6.0
5.9
5.8 8.0%
7.0%
5.7
5.6 4.8% 2.9% 6.0%
5.5
5.4
5.3 3.3% 5.0%
5.2
5.1
5.0 1.6% 4.8 4.0%
4.9
4.8
4.7 0.3% 3.0%
4.6
4.5
4.4 2.0%
1.0%
4.3
4.2
4.1 0.0%
4.0
3.9
3.8 3.6 (1.0)
3.7
3.6
3.5 (2.0)
3.4
3.3 2.7 (3.0)
H2
(4.0)
NMI 1 3.2
3.1
3.0 (5.0)
2.9
(€bn) 2.8
2.7
2.6
2.5 2.4 1.5 (6.0)
(7.0)
2.4
2.3
2.2 (8.0)
2.1
2.0
1.9 (9.0)
1.8
1.7
1.6 1.4 1.3 (10.0
(11.0
1.5
1.4
1.3 (12.0
1.2
1.1
1.0 (13.0
0.9
0.8 0.6 2.1 2.1 H1
(14.0
0.7
0.6
0.5 0.2 (15.0
0.4
0.3
0.2 0.1 (16.0
(17.0
0.1
0.0
(0.1) (18.0
(0.2)
(0.3)
(0.4) (19.0
(0.5) 2008 2009 2010 2011 2012 2013 2014 2015 2016 2017 2018 2019 2020 2021 2022 2022 (20.0
Jan Latest
View View
1Net Material Inflation = market inflation post impacts of hedging, procurement actions, product reformulations and currency movements
28Outlook
2022 Priorities 2022 Guidance
Towards top end of 4.5-6.5% growth range, led by
Continuing growth momentum
price
Invest for growth while managing inflationary Maintain competitive levels of spend in BMI, R&D
Managing inflationary pressure
pressure while investing for Maintain competitive
and levels of turbulent
Capex through spend in BMI, R&D and
period
growth Capex through turbulent period
Implementing new operating model • H1 UOM 16-17%
• FY UOM at the bottom end of 16-17% range
Maintaining cost and savings discipline • Expect to restore margin during 2023 and 2024
29Unilever Q1 2022 Trading Statement Alan Jope & Graeme Pitkethly 28th April 2022
You can also read