U.S. Montmorency Tart Cherry Juice Decreases Bone Resorption in Women Aged 65-80 Years - MDPI
←
→
Page content transcription
If your browser does not render page correctly, please read the page content below
nutrients
Article
U.S. Montmorency Tart Cherry Juice Decreases Bone Resorption
in Women Aged 65–80 Years
Tiffany Dodier            , Kendall L. Anderson, James Bothwell, Janice Hermann, Edralin A. Lucas and Brenda J. Smith *

                                          Department of Nutritional Sciences, Oklahoma State University, Stillwater, OK 74078, USA;
                                          tiffany.dodier@okstate.edu (T.D.); kendall.anderson@okstate.edu (K.L.A.); james.bothwell.jr@gmail.com (J.B.);
                                          janice.hermann@okstate.edu (J.H.); lucas.a.lucas@okstate.edu (E.A.L.)
                                          * Correspondence: bjsmith@okstate.edu; Tel.: +1-405-744-3866

                                          Abstract: Pre-clinical studies have demonstrated that tart cherries, rich in hydroxycinnamic acids
                                          and anthocyanins, protect against age-related and inflammation-induced bone loss. This study
                                          examined how daily consumption of Montmorency tart cherry juice (TC) alters biomarkers of bone
                                          metabolism in older women. Healthy women, aged 65–80 years (n = 27), were randomly assigned to
                                          consume ~240 mL (8 fl. oz.) of juice once (TC1X) or twice (TC2X) per day for 90 d. Dual-energy x-ray
                                          absorptiometry (DXA) scans were performed to determine bone density at baseline, and pre- and
                                          post-treatment serum biomarkers of bone formation and resorption, vitamin D, inflammation, and
                                          oxidative stress were assessed. Irrespective of osteoporosis risk, the bone resorption marker, tartrate
                                          resistant acid phosphatase type 5b, was significantly reduced with the TC2X dose compared to
                                          baseline, but not with the TC1X dose. In terms of indicators of bone formation and turnover, neither
                                          serum bone-specific alkaline phosphatase nor osteocalcin were altered. No changes in thiobarbituric
                                          acid reactive substances or high sensitivity C-reactive protein were observed in response to either
                                TC1X or TC2X. We conclude that short-term supplementation with the higher dose of tart cherry juice

                                          decreased bone resorption from baseline without altering bone formation and turnover biomarkers
Citation: Dodier, T.; Anderson, K.L.;     in this cohort.
Bothwell, J.; Hermann, J.; Lucas, E.A.;
Smith, B.J. U.S. Montmorency Tart
                                          Keywords: tart cherry; osteoporosis; bone mass; bone resorption; oxidative stress; inflammation; aging
Cherry Juice Decreases Bone
Resorption in Women Aged 65–80
Years. Nutrients 2021, 13, 544.
https://doi.org/10.3390/nu13020544
                                          1. Introduction
Academic Editor: LaVerne L. Brown                Osteoporosis is a widespread public health concern that afflicts more than 200 million
Received: 18 January 2021                 people worldwide [1,2]. Alarmingly, women account for 61% of the 9 million osteoporosis-
Accepted: 2 February 2021                 related fractures that occur annually [1]. The first 5–10 years post menopause, a stage
Published: 7 February 2021                of unstable decreases in the bone-preserving hormone estrogen, is characterized by a
                                          rapid phase of bone loss and is a major contributor to the high prevalence of osteoporosis
Publisher’s Note: MDPI stays neutral      amongst women [3]. This phase of rapid bone loss is followed by a more gradual decline
with regard to jurisdictional claims in   in bone mass in the decades that follow as declining estrogen stabilizes and the rate
published maps and institutional affil-   of bone turnover slows. Activity of the cells that determine the rate of bone turnover,
iations.                                  (i.e., osteoclasts, osteoblasts, and osteocytes) is largely driven by cytokines and mediators
                                          of oxidative stress that are altered in response to this decline in estrogen [4]. Although there
                                          are effective FDA-approved pharmacological interventions available to treat osteoporosis,
                                          there is a need for alternative strategies that minimize concerns with side-effects associated
Copyright: © 2021 by the authors.         with existing agents (e.g., osteonecrosis of the jaw and atypical femoral fractures), which
Licensee MDPI, Basel, Switzerland.        can negatively impact patient compliance [5,6]. Plant-based foods, long recognized for their
This article is an open access article    health and medicinal properties, could offer a novel dietary approach to prevent bone loss
distributed under the terms and           associated with aging by targeting inflammatory and oxidative processes [6]. Fruits, which
conditions of the Creative Commons        provide a rich source of hydroxycinnamic acids and anthocyanins (e.g., certain varieties
Attribution (CC BY) license (https://     of blueberries and dried plums), have been studied for their capacity to reduce oxidative
creativecommons.org/licenses/by/          stress and inflammation, and stand out for their osteoprotective activity [7–10].
4.0/).

Nutrients 2021, 13, 544. https://doi.org/10.3390/nu13020544                                                 https://www.mdpi.com/journal/nutrients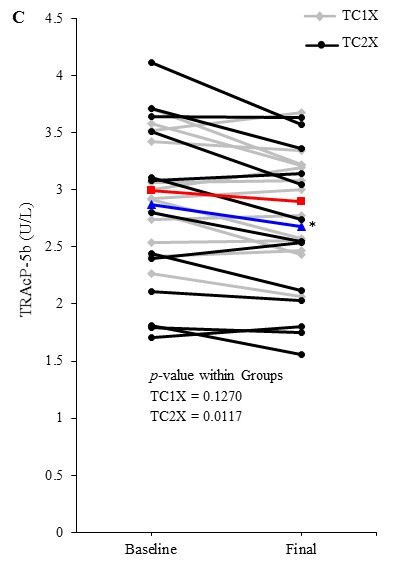
Nutrients 2021, 13, 544                                                                                              2 of 16

                                Tart cherry (Prunus cerasus) is another fruit that is particularly high in these osteo-
                          protective polyphenols. We reported [11] that supplementing the diet with lyophilized
                          tart cherry (5 and 10% w/w diet) increased whole-body bone mineral density (BMD)
                          and improved trabecular and cortical microarchitectural parameters in a mouse model of
                          age-related bone loss. Similar improvements in microarchitectural parameters and bone
                          strength were observed in a transgenic tumor necrosis factor (TNF)-α model of rheumatoid
                          arthritis with the same doses of tart cherry supplementation [12]. In these reports, the mech-
                          anisms through which changes in bone structural parameters occurred were attributed to
                          increased bone mineralization and decreased bone resorption. This anti-resorptive property
                          of tart cherry is supported by in vitro studies demonstrating that tart cherry polyphenols
                          decrease the number of tartrate-resistant acid phosphatase (TRAP)-positive multinucleated
                          cells and TRAP activity, consistent with a decrease in both the differentiation and activity
                          of osteoclasts [13].
                                Tart cherry has also been investigated for its health benefits in clinical trials associated
                          with cardiovascular disease, muscle recovery, sleep quality, and osteoarthritis [14–18]. In
                          addition to these reported health benefits, tart cherry juice has been shown to decrease
                          biomarkers of inflammation, such as high sensitivity C-reactive protein (hsCRP), as well as
                          indicators of oxidative stress such as thiobarbituric acid reactive species (TBARS) [15,19–23].
                          The pronounced effect of tart cherry supplementation observed in age-related bone loss
                          coupled with the promising results of clinical trials to reduce inflammation and oxidative
                          stress motivated our interest in determining if the osteoprotective properties translate to
                          humans.
                                This study aimed to determine the effect of tart cherry juice supplementation, at
                          two different doses, on biochemical markers of bone formation and resorption in women
                          aged 65–80 years. Due to reports that tart cherry juice has potent anti-inflammatory and
                          antioxidant activity, and the role that these biological processes play in bone loss, we also
                          investigated the effects of two different doses of tart cherry juice on serum indicators of
                          oxidative stress and inflammation. We hypothesized that 90 days of daily tart cherry juice
                          supplementation would decrease biomarkers of bone resorption compared to baseline in a
                          dose-dependent manner and that the response would be greater in women with higher
                          risk for osteoporosis. Furthermore, these alterations in biomarkers of bone metabolism
                          would coincide with a decrease in markers of oxidative stress and inflammation.

                          2. Materials and Methods
                          2.1. Participants
                                Volunteers were recruited through email flyer distribution to university-associated
                          and community group email lists, as well as posting at university and area community
                          wellness programs, senior centers, and local clinics. Women (n = 108) were screened and
                          thirty-three women aged 65–80 years qualified to participate in the study based on the
                          inclusion and exclusion criteria (Figure 1). In addition to age, inclusion criteria consisted
                          of women able to ambulate without assistance and have the capacity to give informed
                          consent. Exclusion criteria included current smokers, individuals with a body mass index
                          (BMI) 40 kg/m2 based on self-reported height and weight, and individuals
                          with a previous diagnosis of osteoporosis or any other metabolic bone disease, renal dis-
                          ease, cancer, cardiovascular disease, diabetes mellitus, pulmonary disease, gastrointestinal
                          diseases, liver disease, or other chronic conditions that could affect bone metabolism. Ad-
                          ditionally, subjects were excluded if they had taken hormone replacement therapy or other
                          medications or supplements known to alter bone or calcium metabolism (e.g., bisphos-
                          phonates, denosumab, raloxifene, intermittent parathyroid hormone, growth hormone,
                          steroids, natural estrogens) within three months of starting treatment. All procedures were
                          approved by the Oklahoma State University Institutional Review Board in accordance
                          with the ethical standards of the institutional and with the 1964 Helsinki Declaration and
                          its later amendments or comparable ethical standards. This study was registered with
                          ClinicalTrials.gov: NCT04167150.
were approved by the Oklahoma State University Institutional Review Board in ac
ance with the ethical standards of the institutional and with the 1964 Helsinki Declar
Nutrients 2021, 13, 544 and its later amendments or comparable ethical standards. This study was 3 ofregistered
16
ClinicalTrials.gov: NCT04167150.
Assessed for eligibility (n= 108)
Screening
Excluded (n=75)
• Not meeting one or more of the
inclusion criteria (n=75)
Randomized (n=33)
Allocation
Allocated to TC1X intervention (n=15) Allocated to TC2X intervention (n=18)
• Received allocated intervention (n=15 ) • Received allocated intervention (n=18)
Follow-Up
Lost to follow-up (n=0) Lost to follow-up (n=3)
• Discontinued intervention prior to visit 2
(n=3) (dizziness, undisclosed ulcer, and
insomnia)
Analysis
Analysed (n=14) Analysed (n=13)
• Excluded from analysis (n=1) (unanticipated • Excluded from analysis (n=2) (poisonous
knee arthroplasty procedure) spider bite and C. diff infection)
Figure
Figure 1. 1. Study
Study Flow
Flow Diagram.
Diagram.
2.2. Study Design
2.2. Study Design
Participants who qualified for the study visited the Nutritional Sciences Clinical
Research Participants
Laboratorywho threequalified
times (i.e.,for the study
baseline, visited
45 days, and 90thedays).
Nutritional
The 90-daySciences
study Clinica
search was
duration Laboratory three times
based on previous (i.e.,
studies baseline,
using tart cherry45 to
days, and 90
determine its days). The 90-day stud
anti-inflammatory
and
rationantioxidant
was based properties, and the studies
on previous investigation
using of tart
othercherry
dietarytointerventions
determine with fruits
its anti-inflamm
designed to study bone biomarkers [9,15]. At the baseline visit,
and antioxidant properties, and the investigation of other dietary interventionsparticipants reviewed and with
signed the informed consent with a member of the research team, completed a fasted blood
designed to study bone biomarkers [9,15]. At the baseline visit, participants reviewed
draw, underwent anthropometric measures, dual-energy x-ray absorptiometry (DXA) scans
signed
(i.e., the informed
hip, spine and wholeconsent withgrip
body), hand a member of the and
strength testing, research team,
completed completed
a series of af
blood draw, underwent anthropometric measures, dual-energy
questionnaires collecting information about their medical history, physical activity, sun x-ray absorptiom
(DXA) scans
exposure, (i.e., hip,
and calcium spine
intake. and whole
Participants werebody),
randomizedhandtogripone strength testing,
of two treatment and comp
arms
(TC1X = 240 mL tart cherry juice once per day; TC2X = 240 mL tart
a series of questionnaires collecting information about their medical history, physic cherry juice twice
per day) sun
tivity, at their initial baseline
exposure, visit. Theintake.
and calcium tart cherry juice concentrate,
Participants produced from
were randomized to one o
U.S.-grown Montmorency tart cherries, provided 70 kcal per serving (30 mL), with 19 g
treatment arms (TC1X = 240 mL tart cherry juice once per day; TC2X = 240 mL tart c
of carbohydrate (15 g total sugar), 15 mg of sodium, and ~225 gallic acid equivalents of
juicephenolics.
total twice per Theday)
dosesatoftheir initialjuice
tart cherry baseline
used invisit. The tart
this study cherry
had been juice
shown to concentrate,
have
anti-inflammatory and antioxidant effects [15]. Each participant sampled the juice atserving
duced from U.S.-grown Montmorency tart cherries, provided 70 kcal per the (30
with 19visit
baseline g oftocarbohydrate (15 gallergic
confirm no adverse total sugar),
reactions 15and
mgwere
of sodium, and ~225
given a 45-day supplygallic
of acid e
the
alents of total phenolics. The doses of tart cherry juice used in this study hada been sh
study product. Instructions were provided on how to reconstitute the concentrate into
juice (i.e., 30 mL concentrate to ~210 mL water), with disposable measuring cups provided
to have anti-inflammatory and antioxidant effects [15]. Each participant sampled the
and informed that they could choose to consume the concentrate as a syrup. Participants
at the baseline visit to confirm no adverse allergic reactions and were given a 45-day
were instructed to consume the test product at the same time each day with approximately
ply of
eight thebetween
hours study product.
doses for Instructions
the TC2X group were(i.e.,provided
morning and on evening,
how to reconstitute
at least three the co
hours before sleep to prevent reflux). Participants were also instructed to recorddisposable
trate into a juice (i.e., 30 mL concentrate to ~210 mL water), with the time(s) meas
they
cups consumed
provided the and
product on a calendar
informed that that
theywas provided
could chooseto assess compliance.
to consume theAtconcentrate
the
second visit, participants reported any changes in their health status
syrup. Participants were instructed to consume the test product at the same time eachor medications, height
and weight were recorded, compliance calendar returned, and the remainder of the test
with approximately eight hours between doses for the TC2X group (i.e., morningNutrients 2021, 13, 544 4 of 16
product was provided. The third or final visit was similar to the initial visit: measuring
anthropometrics, completing questionnaires, returning a three-day food record and having
a fasted blood draw. The DXA scan provided context as to the current osteoporosis risk of
participants, but was not repeated at the final visit, given that the 90-day study duration
was not expected to yield discernable changes in bone density.
2.3. Medical History, Physical Activity, Calcium Intake and Sun Exposure Questionnaires
Health and medical history information was collected at baseline by research personnel
using a medical history questionnaire. Changes in medical status were reported at the
second and final visits. Information provided included basic demographics (e.g., age,
ethnicity, education), lifestyle factors (e.g., tobacco and alcohol use), as well as other current
and historical information pertinent to bone health (e.g., prior use of hormone replacement
therapy (HRT), pregnancies and breastfeeding, menopause onset, fractures, surgeries, and
previous medical diagnoses). Also, included in the questionnaire was a list of prescription
and over-the-counter medications and supplements taken in the past three months with
respective dosages.
Physical activity was assessed using the Yale Physical Activity Survey (YPAS) [24].
The YPAS is specifically designed for administration to older adults and assesses recent
(i.e., previous seven days) physical activity and physical activity patterns over the previous
month. The survey provides estimated activity and total calorie expenditure for the
previous week, as well as monthly index scores for total activity of the previous month
and categories (e.g., vigorous activity and leisurely walking). Energy expenditures were
used to categorize participant activity. Light activity was characterized as participation in
daily exercise that expends ~150 kcal in excess of those expended during activities of daily
living, whereas active individuals expend ~250 kcal/day in excess. The monthly index
scores are a product of weighted values of frequency and duration for given activities. At
the baseline visit, study participants were asked to maintain their current level of physical
activity over the 90-day study period.
Dietary intake of macronutrients and vitamin D was assessed using three-day food
records. Participants were asked to maintain their regular dietary intake throughout the
study and were instructed on how to record food intake by research personnel using
portion size references which were completed after their initial visit and prior to their
final visits. Usual supplemental and dietary intake of calcium was assessed at the baseline
and final visits using the National Institutes of Health (NIH) Short Calcium Questionnaire
(version SCQ 2002) [25]. The three-day food records were analyzed using Food Processor II
(ESHA Research, Salem, OR, USA) to assess dietary intake.
Sun exposure was determined using a validated questionnaire [26] that assigns a sun
exposure score (0–56) of the previous week based on duration in the sun or a tanning bed
and amount of unprotected skin. Furthermore, participants classified their skin type from
six descriptions to qualify the sun exposure effect.
2.4. Anthropometric Measurements
Height, weight, and waist and hip circumferences were measured at the initial and
final visits using the protocol outlined by the NHANES III from which body mass index
(BMI, kg/m2 ) and waist-to-hip ratio were calculated [27]. Total body soft tissue analysis
using a DXA system (QDR 4500 Discovery A, Hologic, Waltham, MA, USA) provided body
composition, total fat-free mass less mineralized bone, and fat mass at baseline to support
hand-grip strength and physical activity assessments, as well as to qualify BMD measures.
DXA scans were performed at the baseline visit by a certified bone densitometrist.
Specific measurements included hip (total, neck, trochanter, and intertrochanter) and lum-
bar spine (L1-L4) bone mineral density (BMD), bone mineral content (BMC), and bone
mineral area (BMA). T- and Z-scores were determined using Hologic software. Assess-
ment of BMD and T-scores provided important insight into the participants’ osteoporosis
risk at baseline.Nutrients 2021, 13, 544 5 of 16
As a functional indicator, muscle strength was assessed at the baseline and final visits
with a hand grip dynamometer (Jamar, Lafayette, IN, USA) using a previously published
protocol [28]. Briefly, the participant was seated with their feet flat on the floor, arms
on the armrests of a chair, and the weight of the dynamometer supported by a member
of the research staff. Participants performed the hand grip test three times with both
their dominant and non-dominant hand, exerting maximal effort each time. The best of
three hand grip strength tests for both dominant and non-dominant hand was used as the
indicator for muscle strength and function.
2.5. Serum Biomarkers
Fasting blood samples were collected by staff at the OSU University Health Services
Clinic during baseline and final visits. Blood samples were collected in vacutainer tubes,
allowed to coagulate at room temperature and then centrifuged at 4000× g for 20 min.
Serum was separated and aliquoted for storage at −80 ◦ C.
Biomarkers of bone formation, resorption and turnover were assessed on serum
samples collected at baseline and final visits. Bone alkaline phosphatase (BAP), an indicator
of bone formation, was assessed using EIA kits from Immunodiagnostic Systems Inc. (IDS,
Gaithersberg, MD, USA). Serum total osteocalcin (i.e., N-terminal-mid-fragment and intact
OCN) and tartrate-resistant acid phosphatase type 5b (TRAcP 5b) were also assessed using
ELISA kits from IDS as indicators of bone turnover and bone resorption, respectively. All
assays were run in duplicate and strictly adhered to the manufacturer’s protocol.
Serum biomarkers of inflammation, oxidative stress, and vitamin D status were also
determined at baseline and final visits. hsCRP, a biomarker of inflammation, was measured
using a commercially available kit (Carolina Liquid Chemistries Corp, Winston Salem, NC,
USA) on a Biolis 24i Clinical Chemistry Analyzer. Serum TBARS, an indicator of oxidative
stress, was assessed using a Cayman Chemical kit (Ann Arbor, MI, USA). Vitamin D status
(i.e., 25-hydroxy vitamin D [25-OH-VitD]) was determined using an IDS EIA kit.
2.6. Statistical Analysis
All data were analyzed using PC SAS version 9.4 (SAS Institute, Cary, NC, USA).
Descriptive statistics (e.g., means, standard errors, medians, minima, and maxima) were
calculated for continuous variables. Normality of continuous variables was assessed using
Shapiro–Wilk’s test for normality. The difference between baseline and final, the primary
outcome of serum bone biomarkers, and secondary outcome that included indicators of
oxidative stress and inflammation, was assessed using paired t-test. Next, differences
between baseline and final serum bone biomarkers were assessed after adjusting for serum
25-OH vitamin D and osteoporosis risk, which included baseline whole body, hip, femur
neck, and spine BMD or T-score at the hip, femur neck, and spine as covariates. Categorical
data for baseline characteristics, T-scores, BMI, and vitamin D status were assessed using
Chi square analyses followed by confirmation with Fisher’s exact test to determine if
differences existed between the two groups. For all analyses, alpha was set to 0.05 and data
are presented as means ± standard error (SE) unless otherwise specified.
3. Results
3.1. Participant Demographic and Lifestyle Factors
Thirty-three participants were enrolled in the study, but three withdrew before the
second visit due to complaints of dizziness, exacerbation of an undisclosed ulcer, and
interference with sleep (Figure 1). Of the 30 participants that completed their study visits,
three participants were excluded from the analysis for reasons unrelated to the study (i.e.,
one participant excluded due to an unanticipated knee arthroplasty procedure, and two
participants excluded due to the need to undergo extensive treatments for a poisonous
spider bite and serious gastrointestinal C. difficile infection). Of the 27 participants re-
maining, compliance was >90% and did not differ between groups. The study population
was primarily Caucasian (96%), married (70%), and highly educated (44% reported post-Nutrients 2021, 13, 544 6 of 16
graduate education) with a mean age of 70.9 ± 4.5 years (Table 1). Self-reported mean years
post-menopause was 23.0 ± 5.6 years for the study population overall with no difference
between the TC1X and TC2X groups. The two treatment groups were similar in age and
distribution of ethnicity, marital status, and education (Table 1).
Table 1. Baseline Characteristics of Study Participants.
Total TC1X 1 TC2X 1
Characteristic p-Value 2
(n = 27) (n = 14) (n = 13)
Age (years) 70.93 ± 4.47 70.57 ± 4.15 71.31 ± 4.94 0.678
Time Post
menopause 22.96 ± 5.58 23.86 ± 8.09 22.00 ± 4.56 0.474
(years)
Marital status 0.432
Single (%) 0.07 (2) 0 (0) 15.38 (2)
Married (%) 70.40 (19) 71.40 (10) 69.20 (9)
Widowed (%) 14.80 (4) 21.40 (3) 7.70 (1)
Divorced (%) 14.80 (4) 7.10 (1) 23.10 (3)
Education 0.409
High school
7.40 (2) 0 (0) 13.33 (2)
diploma (%)
Some college (%) 18.52 (5) 14.29 (2) 23.08 (3)
College degree
29.63 (8) 23.08 (4) 33.33 (4)
(%)
Postgraduate
44.44 (12) 57.14 (8) 30.77 (4)
(%)
Ethnicity 1.000
Black or African
3.70 (1) 7.1 (1) 0 (0)
American (%)
White (%) 96.30 (26) 92.90 (13) 100.00 (13)
Lifestyle
Ever smoked (%) 29.63 (8) 30.77 (4) 28.57 (4) 1.000
Consumes any
74.07 (20) 71.40 (10) 76.90 (10) 1.000
alcohol (%)
Frequency
1.78 ± 2.44 2.34 ± 2.97 1.18 ± 1.62 0.224
(drinks/week)
Reproductive
history
Gravidity 2.6 ± 0.3 2.9 ± 0.4 2.3 ± 0.4 0.980
Parity 2.1 ± 0.2 2.2 ± 0.3 2.0 ± 0.3 0.562
Oral
contraceptive 8.1 ± 1.9 10.4 ± 3.2 5.7 ± 2.0 0.224
use (years)
Data are presented as mean ± standard error (SE) unless specified otherwise. 1 TC1X = 1 fl. oz. tart cherry juice
concentrate/d; TC2X = 2 fl. oz. tart cherry juice concentrate/d. 2 p-values represent comparison paired t-test for
continuous data and Chi Square confirmed by Fisher’s Exact test for categorical data between TC1X and TC2X.
With regard to lifestyle factors, 74% of participants reported that they consume alcohol,
but the mean number of drinks per week was 1.8 ± 2.4, which is well below the recom-
mended limit for women (i.e., no more than one drink/day) (Table 1) [29]. At baseline,
there were no differences between treatment groups for the proportion of participants who
consumed alcohol, the number of drinks consumed, and those who reported ever smoking.
Reproductive history, including gravidity, parity, and years of oral contraceptive use, were
similar between treatment groups at baseline (Table 1).
Baseline BMD T-scores obtained from DXA scans revealed that 82% of the women were
osteopenic at one or more sites (Table 2). The frequency of osteopenia and osteoporosis in
the femur neck for the study population was n = 20 and n = 3, respectively. The distributionNutrients 2021, 13, 544 7 of 16
of osteoporosis categories between TC1X and TC2X treatment groups tended to be different
at the femur neck (p = 0.088), but was similar between groups at all other sites. There
were no participants in the TC2X group who had a normal femur neck T-score and 50%
more with osteopenia compared to TC1X. No significant differences were observed in
the distribution of T-scores considered normal (T-score > −1.0), osteopenia (T-score −1
to −2.5), or osteoporosis (T-score < −2.5) between TC1X and TC2X groups at the hip, hip
sub-regions, or lumbar spine. Specific bone parameters (i.e., BMD, BMC, and BMA) were
not different between groups at baseline (Supplementary Materials Table S1).
Table 2. Categorization of Osteoporosis Risk by T-scores Based on dual x-ray absorptiometry (DXA)
Scan at Baseline.
Total TC1X 1 TC2X 1
Characteristic p-Value 2
(n = 27) (n = 14) (n = 13)
Any site T-score 3 0.490
Normal (%) 7.4 (2) 14.3 (3) 0 (0)
Osteopenia (%) 81.5 (22) 71.4 (10) 92.3 (12)
Osteoporosis (%) 11.1 (3) 14.3 (2) 7.7 (1)
Total hip T-score 0.3180
Normal (%) 33.3 (9) 42.9 (6) 23.1 (3)
Osteopenia (%) 63.0 (17) 50.0 (7) 76.9 (10)
Osteoporosis (%) 3.7 (1) 7.1 (1) 0 (0)
Femur neck T-score 0.088
Normal (%) 14.8 (4) 28.6 (4) 0 (0)
Osteopenia (%) 74.1 (20) 57.1 (8) 92.3 (12)
Osteoporosis (%) 11.1 (3) 14.3 (2) 7.7 (1)
Trochanter T-score 1.000
Normal (%) 37.0 (10) 35.7 (5) 38.5 (5)
Osteopenia (%) 59.3 (16) 57.2 (8) 61.5 (8)
Osteoporosis (%) 3.7 (1) 7.1 (1) 0 (0)
Intertrochanter
0.334
T-score
Normal (%) 55.6 (16) 64.3 (9) 46.2 (6)
Osteopenia (%) 40.7 (10) 28.6 (1) 53.8 (7)
Osteoporosis (%) 3.7 (1) 7.1 (1) 0 (0)
Lumbar spine
0.265
T-score
Normal (%) 51.9 (14) 57.1 (8) 46.2 (6)
Osteopenia (%) 40.7 (11) 28.6 (4) 53.8 (7)
Osteoporosis (%) 7.4 (2) 14.3 (2) 0.0 (0)
1Data are presented as % of participants (n) within each category. 1 TC1X = 1 fl. oz. tart cherry juice concentrate/d;
TC2X = 2 fl. oz. tart cherry juice concentrate/d. 2 p-values represent Fisher’s Exact test and Chi Square between
TC1X and TC2X. 3 Considers the lowest T-score at any site and classifies into normal, osteopenia, or osteoporosis
T-score ranges.
3.2. Anthropometric, Diet Analysis and Physical Activity
In characterizing baseline anthropometrics of participants, the overall study popula-
tion distribution of BMI by category was 44% (n = 12) normal, 37% (n = 10) overweight,
and 19% (n = 5) obese, with no differences in distributions between the TC1X and TC2X
groups (Table 3). There were no differences in weight, height, BMI, percent body fat, waist
circumferences, and waist-to-hip ratio between treatment groups at baseline or final time
points. At the final visit, weight and BMI were significantly greater than baseline within
the TC1X group (1.3% increase, p = 0.0203 and 1.4% increase, p = 0.0158, respectively).
However, participants in the TC1X group were still within the same category from baseline
(i.e., overweight) and waist circumference was not different from baseline (Table 3). ThereNutrients 2021, 13, 544 8 of 16
were no statistically significant differences in any anthropometric measures within the
higher dose (i.e., TCX2) group or between groups.
Table 3. Comparisons of Anthropometric Measurements and Macronutrient, Vitamin D and Calcium Intake Within and
Between Groups.
Parameter TC1X 1 (n = 14) TC2X 1 (n = 13) p-Value 3
Baseline Final p-Value 2 Baseline Final p-Value 2 Baseline Final
Anthropometrics
Weight (kg) 66.7 ± 4.1 67.6 ± 4.3 0.020 74.3 ± 3.5 75.4 ± 3.4 0.175 0.176 0.175
463.6 ±
Height (cm) 161.8 ± 1.8 161.8 ± 1.7 0.855 163.9 ± 2.3 0.331 0.480 0.521
2.2
BMI (kg/m2 ) 25.4 ± 1.4 25.7 ± 1.4 0.016 27.5 ± 0.9 28.0 ± 0.8 0.129 0.204 0.177
Normal (%) 8 (57.1) 7 (50.0) 1.00 4 (30.8) 3 (23.1) 1.000 0.522 0.372
Overwt (%) 4 (28.6) 5 (35.7) - 6 (46.2) 6 (46.2) - - -
Obese (%) 2 (14.3) 2 (14.3) - 3 (23.1) 4 (30.8) - - -
Waist circ (cm) 84.9 ± 3.3 84.5 ± 3.4 0.598 88.7 ± 2.2 89.8 ± 2.2 0.264 0.364 0.203
0.84 ±
Waist/Hip ratio 0.82 ± 0.01 0.81 ± 0.02 0.134 0.83 ± 0.02 0.790 0.670 0.296
0.02
Body fat (%) 36.3 ± 1.6 - - 40.1 ± 1.1 - - 0.163 -
Macronutrients
1729.1 ± 1931.2 ± 1641.8 ± 1787.9 ±
TEnergy (kcal) 0.226 0.344 0.573 0.435
116.8 119.3 96.6 136.2
Protein (%kcal) 18.0 ± 1.4 15.7 ± 1.0 0.178 17.7 ± 1.6 17.2 ± 1.2 0.757 0.880 0.313
Carbs (%kcal) 46.2 ± 3.1 43.9 ± 2.2 0.390 50.1 ± 2.1 48.6 ± 2.0 0.585 0.313 0.127
TFat (%kcal) 36.9 ± 3.0 40.6 ± 2.2 0.144 34.1 ± 1.4 35.8 ± 1.6 0.392 0.425 0.103
Daily Calcium Intake
888.1 ± 1091.2 ± 1079.7 ±
Diet (mg) 942.8 ± 71.2 0.425 0.919 0.295 0.212
84.7 121.9 125.6
563.9 ± 616.7 ± 523.8 ±
Supplement (mg) 557.3 ± 110.0 0.953 0.405 0.774 0.812
107.0 176.0 129.7
1500.1 ± 1452.1 ± 1707.9 ± 1603.5 ±
Total Ca (mg) 0.696 0.502 0.386 0.525
141.6 130.0 191.1 199.6
%Below RDA 4 (28.6) 4 (28.6) 1.000 4 (23.1) 6 (46.2) 0.411 1.000 0.440
Daily Vitamin D Intake
100.7 ± 143.2 ± 115.6 ±
Diet (IU/day) 141.9 ± 25.2 0.123 0.288 0.970 0.646
26.0 22.8 18.1
Supplement 1585.7 ± 1585.7 ± 1076.9 ± 1076.9 ±
1.000 1.000 0.424 0.424
(IU/day) 515.1 515.1 338.0 338.0
1727.6 ± 1686.4 ± 1220.1 ± 1192.5 ±
Total (IU) 0.123 0.288 0.424 0.138
509.3 510.1 345.3 341.1
Data are presented as mean ± SE. 1 TC1X = 1 fl. oz. tart cherry juice concentrate/d; TC2X = 2 fl. oz. tart cherry juice concentrate/d.
2 p-values are comparison within groups (baseline vs. final). 3 p-values represent comparison of TC1X and TC2X groups at baseline or final
time points. Body mass index (BMI), Overwt (Overweight), circ (circumference), TEnergy (Total Energy), TFat (Total Fat).
To determine if changes in dietary intake occurred during the course of the study,
the average macronutrient and vitamin D intakes were calculated from three-day food
records and calcium intake was determined from the calcium questionnaire. The mean in-
takes of total kcal and percent of kcal from carbohydrates, fat, and protein were not different
at baseline or final time points between TC1X and TC2X treatment
groups (Table 3). In general, both groups consumed 15–20% of their calories from protein,
40–50% from carbohydrates, and 30–40% from fat at baseline and final visits. The percent-
age change in total kcal intake and contribution of protein, carbohydrates, and fats in the
diet were not significantly different within and between TC1X and TC2X treatment groups.
The tart cherry juice provided an additional 70 kcal and 19 g of carbohydrates per day
to the TC2X group compared to the TC1X group [30]. Calcium intake was examined at
baseline and final visits using the calcium questionnaire. In this cohort, total calcium intake,Nutrients 2021, 13, 544 9 of 16
as well as intake from supplements or food, was not different between TC1X and TC2X
treatment groups at either time point and the proportion of participants not meeting the
recommended dietary allowance (RDA) for calcium was similar between groups (Table 3).
Dietary intake of vitamin D from food and from dietary supplements was similar be-
tween groups at baseline and final time points and within each treatment
group (Table 3). Due to the potential influence of physical activity and muscular strength on
bone homeostasis, energy expenditure and physical activity were estimated and hand grip
strength was assessed at the baseline and final visits. Based on self-report, the study cohort
was categorized as lightly active with a mean daily exercise EE of more than 200 kcal/day
(i.e., 1468 ± 262 kcal/week) (Table S2). Neither exercise nor total energy expenditure (EE)
differed between TC1X and TC2X treatment groups at the baseline or final time points.
Within treatment groups, total EE tended to be lower at the final visit for the TC2X group
(p = 0.0575), as did self-reported vigorous (p = 0.010) and leisure walking (p = 0.002) activity
scores. The summary moving index score was not different between the TC1X and TC2X
treatment groups; but there was a decrease in the summary index score within the TC2X
group (Table S2). Overall, the values for hand grip strength obtained from this cohort
were within the normal range for women in this age group [28]. Grip strength was similar
between groups at the baseline visit and was not altered over the course of the study when
comparisons were made within and between treatment groups (Table S2).
3.3. Vitamin D Status
In addition to the dietary intake of vitamin D, sun exposure was assessed using a
validated questionnaire at both the baseline and final visits. No differences in sun exposure
score were revealed between groups at baseline (TC1X = 18.4 ± 2.9 vs. TC2X = 21.1 ± 3.3)
and final time points. However, at the final time point, the TC2X mean sun score was signifi-
cantly lower than the baseline visit score (TC2X Baseline = 21.1 ± 3.3 vs.
Final = 13.4 ± 3.3; p = 0.0455), but were not different between groups (TC1X = 17.6 ± 2.4
vs. TC2X = 13.4 ± 3.3). A score > 14 indicates that the participant spent > 30 min outside
with at least hands and face exposed daily over the previous week.
There were no differences in serum 25-OH VitD between the TC1X and TC2X groups
at baseline, nor were there differences within or between groups after the 90-day treatment
period (Table 4). According to the Institute of Medicine (IOM), Food and Nutrition Board
guidelines [31], nine out of the 27 participants in this cohort were considered at risk for
vitamin D deficiency; however, the distribution of these participants was not different
between groups at either time point (Table 4).
Table 4. Effect of 90-day Tart Cherry Juice Consumption on Biomarkers of Vitamin D Status, Inflammation and Oxidative
Stress.
TC1X 1
Parameter TC2X 1 p-Value 3
(n = 14)
(n = 13)
Baseline Final p-Value 2 Baseline Final p-Value 2 Baseline Final
Vitamin D Status
25(OH)D (ng/mL) 36.7 ± 3.1 35.6 ± 3.2 0.595 31.2 ± 2.3 30.8 ± 2.4 0.783 0.173 0.250
At risk (%) 4 4 (28.6) 5 (35.7) 1.000 4 (30.8) 6 (46.2) 0.688 1.000 0.704
Inflammation
hsCRP (mg/L) 2.2 ± 0.5 2.4 ± 0.6 0.557 2.5 ± 0.7 4.4 ± 0.2 0.593 0.739 0.642
Oxidative Stress
TBARS (µM) 4.6 ± 0.5 3.9 ± 0.5 0.180 5.1 ± 0.6 2.8 ± 0.6 0.235 0.545 0.388
1
Data are presented as mean ± standard error (SE). TC1X = 1 fl. oz. tart cherry juice concentrate/d; TC2X = 2 fl. oz. tart cherry juice
concentrate/d. 2 p-values represent comparison within groups between baseline and corresponding final values. 3 p-values represent
comparison between TC1X and TC2X at baseline and final values. 4 At risk for vitamin D deficiency = 12–30 ng/mL; no participants were
deficient (i.e., 25(OH)D < 12 ng/mL). High sensitivity C-reactive protein (hsCRP), thiobarbituric acid reactive substances (TBARS).Nutrients 2021, 13, 544 10 of 16
3.4. Serum Bone Formation and Resorption Indicators
Analysis of serum samples from baseline and final visits provided insight into tart
cherry juice’s effects on bone formation, turnover, and resorption. Serum BAP, an indi-
cator of bone formation, was not significantly different between groups at the baseline
(TC1X = 17.40 ± 5.15 U/L vs. TC2X = 16.41 ± 7.67 U/L) or at the final (TC1X = 17.58 ± 5.48 U/L
vs. TC2X = 16.27 ± 7.72 U/L) visit. Likewise, there was no difference in serum OCN,
considered a biomarker of bone turnover, between treatment groups at baseline
(TC1X = 20.11 ± 6.64 µg/L vs. TC2X = 19.88 ± 7.83 µg/L) or final (TC1X = 19.41
± 6.65 µg/L vs. TC2X = 19.67 ± 8.04 µg/L) time points. The effect of tart cherry within
treatment groups yielded no significant alterations in either serum BAP or OCN over the
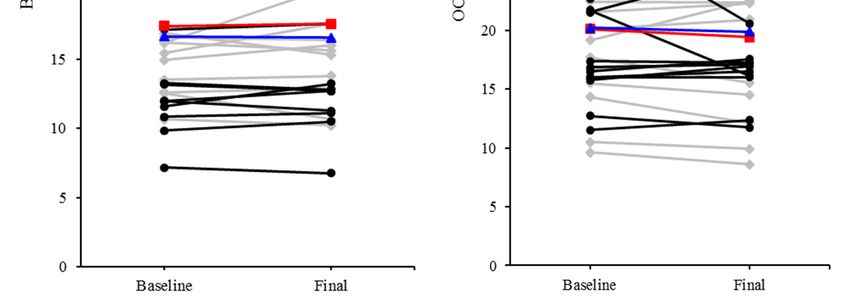
course of this 90-day study (Figure 2A,B). Serum TRAcP 5b, an indicator of resorption,
was not significantly different between groups at baseline (TC1X = 2.99 ± 0.46 U/L vs.
TC2X = 2.79 ± 0.81 U/L) and final (TC1X = 2.89 ± 0.45 U/L vs. TC2X = 2.60 + 0.71 U/L)
visits. Although there was no effect of TC1X on bone resorption, TRAcP 5b was reduced
(p = 0.0117) by TC2X after 90 days (Figure 2C). Percent change from baseline was not differ-
ent between TC1X and TC2X groups for any of the biomarkers of bone metabolism that
were assessed (Figure 2D). In addition to assessing the effects of TC1X and TC2X within
treatment group over time using paired t-test, we also investigated whether adjusting for
osteoporosis risk or vitamin D status (25-OH VitD) would alter our results. Irrespective of
a participant’s baseline BMD and T-score at the spine, hip, and hip subregions, or vitamin
D status, no alteration in BAP and OCN (p > 0.05) occurred in response to tart cherry juice.
Furthermore, a participant’s osteoporosis risk and vitamin D status at baseline did not
influence the decrease in TRAP5b (p < 0.05) with the TC2X dose.
3.5. Serum Indicators of Inflammation and Oxidative Stress
General determinants of inflammation and oxidative stress were assessed based on
serum hsCRP and TBARS, respectively. Baseline hsCRP for the cohort (2.2 ± 0.5 mg/L)
was within the normal reference range (Nutrients 2021, 13, x FOR PEER REVIEW
Nutrients 2021, 13, 544 11 of 16
Figure 2.2.Effect
Figure Effectof of
90-day tart tart
90-day cherry juice treatment
cherry on serum
juice treatment onbone biomarkers:
serum (A) bone-specific
bone biomarkers: (A) bone-sp
alkaline phosphatase (BAP), (B) osteocalcin (OCN), and (C) tartrate-resistant acid phosphatase
alkaline phosphatase (BAP), (B) osteocalcin (OCN), and (C) tartrate-resistant acid phosphata
(TRAcP)-5b. Baseline and final values are shown for individual participants and the group mean is
(TRAcP)-5b. Baseline and final values are shown for individual participants and the group m
presented as TC1X = red line or TC2X = blue line. Serum BAP and OCN were unchanged within
presented as TC1X = red line or TC2X = blue line. Serum BAP and OCN were unchanged wi
groups for both the TC1X and TC2X, but serum TRAcP-5b was decreased (p < 0.05) from baseline to
groups for both the TC1X and TC2X, but serum TRAcP-5b was decreased (p < 0.05) from bas
final visit (*) within the TC2X group, but not the TC1X group. (D) Percent change from baseline was
to final visit (*) within the TC2X group, but not the TC1X group. (D) Percent change from ba
not different between TC1X and TC2X groups for any of the biomarkers of bone metabolism that
was not different between TC1X and TC2X groups for any of the biomarkers of bone metabo
were assessed.
that were assessed.
4. Discussion
Identifying promising dietary interventions that can be incorporated into a liNutrients 2021, 13, 544 12 of 16
4. Discussion
Identifying promising dietary interventions that can be incorporated into a lifestyle
program to reduce the risk for osteoporosis is an appealing strategy. This study was
designed to investigate whether chronic consumption of the juice of tart cherries, a fruit
with osteoprotective effects in pre-clinical studies and no known side effects in human
studies, alters serum biomarkers of bone formation and resorption in postmenopausal
women, 65–80 years of age. As anticipated, this cohort of women with a mean age of
71 years was in large part osteopenic (82%); 11% of the population was osteoporotic at
one or more sites, and only 7%, or two participants, were considered to have normal bone
density (T-score > −1) at all sites assessed. Two doses of tart cherry juice were utilized in
this study that had been shown to alter indicators of oxidative stress and inflammation in
previous studies [15,33,34].
In this cohort, there were no alterations in biomarkers of bone formation, bone
turnover or bone resorption in response to the lower dose of tart cherry juice (TC1X),
but the higher dose (TC2X) significantly reduced the resorption biomarker, TRAcP 5b,
over the 90-day study period. This reduction in bone resorption occurred without any
alterations in serum indicators of bone formation and turnover, which can be a drawback
to pharmaceutical agents with anti-resorptive activity such as bisphosphonates [35]. Fur-
thermore, it occurred despite the decline in physical activity, both vigorous and leisurely
walking activity, reported by this group. Because this was a pilot study to determine if tart
cherry juice altered bone metabolism, and if so the dose that would be required, the study
was not designed with a duration that would be required to observe a change in BMD.
However, we anticipated that osteoporosis risk (i.e., BMD or T-scores) and vitamin D status
of the study participants at baseline may affect their response to treatment. Our results
showed that when controlling for these factors, there were no changes in the findings
related to the biomarkers, suggesting that tart cherry juice at the higher dose reduced bone
resorption in this cohort of older postmenopausal women, irrespective of their bone density
and 25-OH vitamin D status. Similar decreases in TRAcP 5b have been reported in clinical
trials with dried plum, which is important due to the fruit being in the same genus and
having a similar phytochemical profile as tart cherry [9,36–38].
In previous studies utilizing animal models of osteoporosis, lyophilized Montmorency
tart cherry powder from cherries grown in the same region of the U.S. as those used to pro-
duce the juice in this study, was incorporated into the diet. The tart cherry increased BMD
in an animal model of age-related bone loss, which resulted from improved trabecular bone
microarchitecture in the lumbar spine and distal femur metaphysis, and enhanced cortical
thickness in the mid-diaphysis of the femur [11]. No systemic biochemical markers of bone
formation or resorption were observed in that study, but alterations in genes involved
in bone mineralization (i.e., phosphate regulating endopeptidase homolog, X-linked or
Phex and peroxisome proliferator activated receptor or Ppar-γ) were reported with tart
cherry treatment. In previous work by Moon and colleagues using a TNF-α overexpressing
transgenic model [38], tart cherry supplementation improved trabecular and cortical bone
parameters. Although systemic indicators of bone metabolism were not evaluated in the
study, local RANKL and TRAP expression, indicators of osteoclast differentiation and
activity, were significantly reduced in the transgenic mice with tart cherry treatment. Runt-
related transcription factor 2 (Runx2) gene expression was also increased in transgenic
TNF mice by tart cherry supplementation, but no alterations in collagen type I expression.
These findings suggest that tart cherry promoted the differentiation of osteoblasts without
altering their activity.
Because no previous clinical studies had investigated the effects of the lyophilized tart
cherry powder on bone-related outcomes, and only tart cherry juice has been shown to alter
indicators of inflammation and oxidative stress [15,39,40], the juice was utilized in this study.
The loss of bioactive components of the tart cherry, such as the polyphenolic compounds,
is minimal during heat treatment used in preparing juice concentrates [41]. However,
other bioactive components within the fruit, such as non-digestible carbohydrates, thatNutrients 2021, 13, 544 13 of 16
could contribute to the bone protective effects of the tart cherry due to their influence on
microbiota-derived short chain fatty acids and mineral absorption, may not be preserved
in the juice preparation to the same level as the powder [41,42]. Thus, the use of the juice
may account for the discrepancies in the skeletal response in this study compared to our
previous work with animal models of age-related bone loss.
Tart cherry juice has been shown to have potent antioxidant and anti-inflammatory
properties in studies focused on athletes, otherwise healthy adults with osteoarthritis,
obese and overweight individuals, as well as older adults [18,22,23,33,34]. Since oxida-
tive stress and pro-inflammatory mediators promote osteoclast activity resulting in an
increase in bone resorption, we also investigated whether tart cherry juice alters indicators
of oxidative status and inflammation in our cohort. Although TRAcP 5b was decreased
by the higher dose of tart cherry juice in this study compared to baseline, there were no
differences in serum hsCRP or TBARS, systemic indicators of inflammation and oxidative
stress, respectively. A general expectation is that inflammation and oxidative stress increase
with age, but some studies reporting improvements in indicators of inflammation and
oxidative stress with tart cherry have included younger and otherwise healthy participants
who were experiencing acute increases in these biomarkers, such as those associated with
running a marathon, competing in a triathlon, or high intensity interval training [21,43,44].
Tart cherry juice supplementation may have more pronounced effects in acute scenarios.
Studies examining pharmacokinetics of tart cherry phytochemicals reveal that peak concen-
tration of phenolic acid degradation products in plasma occurs 1–2 h post-consumption of
~240–480 mL of tart cherry juice and return to baseline levels within 6-8 h [45,46]. It is
not without reason to consider that routine dosing of tart cherry juice, as with twice per
day in the TC2X group, may transiently down-regulate inflammation and oxidative stress
to reduce osteoclast activity without significantly affecting the markers examined in this
study. Alternatively, a recent study that included both men and women, aged 65–80 years,
consuming tart cherry juice or control drink (~480 mL per day) for 12 weeks exhibited lower
serum hsCRP and malondialdehyde (MDA), one of the end-products of polyunsaturated
fatty acid peroxidation, than the control group [34]. However, the upward drift in the
control group CRP between baseline and final measurements may have contributed to this
observation. In a study of obese and overweight adults, CRP tended to be decreased with
4 weeks of tart cherry supplementation, but the mean participant values were elevated at
baseline in that study [47]. In our cohort, the mean CRP was within the normal range at
baseline. Population differences could account for these discrepancies in CRP, as well as the
specific biomarker of oxidative stress that was used. It should be noted that TBARS include
measures of MDA within the sample and the MDA generated from hydroperoxides, which
can be affected by triglycerides [48]. However, it is also possible that tart cherry juice
influences osteoclast activity through other mechanisms, as has been observed in in vitro
studies with tart cherry extracts [13,49].
Despite the interesting finding that tart cherry juice suppresses bone resorption, this
study is not without limitations. First, previous pre-clinical studies focused on tart cherry
and bone utilized a lyophilized tart cherry powder where this study used tart cherry juice.
The decision to use tart cherry juice in this clinical trial was based on its previously shown
effects on biomarkers of inflammation and oxidative stress, as well as ease of administration
and access. It is possible that the juice preparation has a reduced concentration of bioactive
components per serving that are responsible for the osteoprotective effects of tart cherry
reported in the animal studies [11,12]. Second, we elected to utilize a pretest—posttest
study design with two different doses of treatment as opposed to a placebo-controlled
study design with a single dose. We appreciate the limitations of this approach, but in
the absence of studies focused on tart cherry and bone in humans and our inability to run
three groups that were adequately powered due to budgetary constraints, we decided
on the pretest—posttest study design. Future studies with the higher dose of tart cherry
juice in a placebo-controlled trial should be performed. Third, with bone biomarkers
as the primary outcomes of this study, our power calculation was based on previousNutrients 2021, 13, 544 14 of 16
reports in the literature with dried plum, which has a similar polyphenolic profile as the
tart cherry [45,50]. Our study may have been underpowered to detect small effects on
indicators of inflammation and oxidative stress or more subtle changes at lower doses.
In conclusion, this study showed that supplementation with tart cherry juice reduced
bone resorption in a cohort of older postmenopausal women. This occurred when the
cherry juice was consumed twice per day without changes in biomarkers of bone formation
or turnover. These effects on biomarkers of bone metabolism occurred irrespective of the
participant’s osteoporosis risk and vitamin D status at baseline. It is clear, that in pre-
clinical as well as clinical studies, that tart cherry positively influences bone metabolism
in age-related bone loss, but the evidence supporting the mechanism differed. The use
of different tart cherry preparations should be considered when comparing the effects of
tart cherry on bone metabolism to that of the pre-clinical trial. Thus, the findings of this
study can be used to inform the planning of future long-term clinical studies examining
the effects of tart cherry juice, but highlight the need to consider the investigation of the
skeletal response to the whole fruit.
Supplementary Materials: The following are available online at https://www.mdpi.com/2072-664
3/13/2/544/s1, Table S1: Study population baseline DXA, Table S2: Hand grip strength and physical
activity at baseline and final visit.
Author Contributions: Conceptualization of the study, B.J.S., E.A.L. and J.H.; Methodology, T.D.,
B.J.S., E.A.L. and J.H.; Formal Analysis, T.D., K.L.A., J.B., E.A.L. and B.J.S.; Data Curation, T.D., B.J.S.
and E.A.L.; Writing—Original Draft Preparation, T.D. and B.J.S.; Writing—Review and Editing, T.D.,
K.L.A., J.B., J.H., E.A.L. and B.J.S.; Project Administration, B.J.S. and E.A.L.; Funding Acquisition,
B.J.S., E.A.L. and J.H. All authors have read and agreed to the published version of the manuscript.
Funding: This research was funded by the Cherry Research Committee of the Cherry
Marketing Institute.
Institutional Review Board Statement: The study was conducted according to the guidelines of
the Declaration of Helsinki, and approved by the Institutional Review Board of Oklahoma State
University (HE179; Approval date: 28 March 2017).
Informed Consent Statement: Informed consent was obtained from all subjects involved in
the study.
Data Availability Statement: Data are available on ClinicalTrials.gov (accessed on 1 February 2020).
Acknowledgments: The authors would like to acknowledge their appreciation for the technical
assistance provided by Sandra Peterson and Bryant Keirns on this project.
Conflicts of Interest: The authors declare no conflict of interest. The funders had no role in the design
of the study; in the collection, analyses, or interpretation of data; in the writing of the manuscript, or
in the decision to publish the results.
Statement of Human Rights: All procedures performed in studies involving human participants
were in accordance with the ethical standards of the institutional and/or national research committee
and with the 1964 Helsinki declaration and its later amendments or comparable ethical standards.
References
1. Johnell, O.; Kanis, J.A. An estimate of the worldwide prevalence and disability associated with osteoporotic fractures. Osteoporos.
Int. 2006, 17, 1726–1733. [CrossRef]
2. Kanis, J.A. Assessment of Osteoporosis at the Primary Health-Care Level. In World Health Organization Collaborating Centre for
Metabolic Bone Diseases; University of Sheffield: Sheffield, UK, 2007; p. 66.
3. Khosla, S. Pathogenesis of Osteoporosis. Transl. Endocrinol. Metab. Metab. Surg. Update 2010, 1, 55–86. [CrossRef]
4. Khosla, S. Pathogenesis of Age-Related Bone Loss in Humans. J. Gerontol. Ser. A Boil. Sci. Med. Sci. 2013, 68, 1226–1235. [CrossRef]
5. Qaseem, A.; Forciea, M.A.; McLean, R.M.; Denberg, T.D. For the Clinical Guidelines Committee of the American College of
Physicians Treatment of Low Bone Density or Osteoporosis to Prevent Fractures in Men and Women: A Clinical Practice Guideline
Update From the American College of Physicians. Ann. Intern. Med. 2017, 166, 818–839. [CrossRef]
6. Dolzhenko, A.T.; Sagalovsky, S. Cellular and molecular mechanisms of osteoporosis: Current concepts and future direction
treatment. Mod. Rheumatol. J. 2016, 10, 56–63. [CrossRef]Nutrients 2021, 13, 544 15 of 16
7. Qiu, R.; Cao, W.-T.; Tian, H.-Y.; He, J.; Chen, G.-D.; Chen, Y.-M. Greater Intake of Fruit and Vegetables Is Associated with
Greater Bone Mineral Density and Lower Osteoporosis Risk in Middle-Aged and Elderly Adults. PLoS ONE 2017, 12, e0168906.
[CrossRef] [PubMed]
8. Chen, J.-R.; Lazarenko, O.P.; Wu, X.; Kang, J.; Blackburn, M.L.; Shankar, K.; Badger, T.M.; Ronis, M.J. Dietary-induced serum
phenolic acids promote bone growth via p38 MAPK/β-catenin canonical Wnt signaling. J. Bone Miner. Res. 2010, 25, 2399–2411.
[CrossRef] [PubMed]
9. Hooshmand, S.; Kern, M.; Metti, D.; Shamloufard, P.; Chai, S.C.; Johnson, S.A.; Payton, M.E.; Arjmandi, B.H. The effect of two
doses of dried plum on bone density and bone biomarkers in osteopenic postmenopausal women: A randomized, controlled trial.
Osteoporos. Int. 2016, 27, 2271–2279. [CrossRef] [PubMed]
10. Rendina, E.; Hembree, K.D.; Davis, M.R.; Marlow, D.; Clarke, S.L.; Halloran, B.P.; Lucas, E.A.; Smith, B.J. Dried Plum’s Unique
Capacity to Reverse Bone Loss and Alter Bone Metabolism in Postmenopausal Osteoporosis Model. PLoS ONE 2013, 8, e60569.
[CrossRef]
11. Smith, B.J.; Crockett, E.K.; Chongwatpol, P.; Graef, J.L.; Clarke, S.L.; Rendina-Ruedy, E.; Lucas, E.A. Mont-morency tart cherry
protects against age-related bone loss in female C57BL/6 mice and demonstrates some an-abolic effects. Eur. J. Nutr. 2018, 58,
3035–3046. [CrossRef]
12. Moon, N.; Effiong, L.; Song, L.; Gardner, T.R.; Soung, D.Y. Tart Cherry Prevents Bone Loss through Inhibition of RANKL in
TNF-Overexpressing Mice. Nutrients 2018, 11, 63. [CrossRef] [PubMed]
13. Thomas, A.; South, S.; Vijayagopal, P.; Juma, S. Effect of Tart Cherry Polyphenols on Osteoclast Differentiation and Activity. J.
Med. Food 2020, 23, 56–64. [CrossRef] [PubMed]
14. Bell, P.G.; McHugh, M.P.; Stevenson, E.; Howatson, G. The role of cherries in exercise and health. Scand. J. Med. Sci. Sports 2013,
24, 477–490. [CrossRef] [PubMed]
15. Chai, S.C.; Davis, K.; Zhang, Z.; Zha, L.; Kirschner, K.F. Effects of Tart Cherry Juice on Biomarkers of Inflam-mation and Oxidative
Stress in Older Adults. Nutrients 2019, 11, 228. [CrossRef]
16. Howatson, G.; Bell, P.G.; Tallent, J.; Middleton, B.; McHugh, M.P.; Ellis, J. Effect of tart cherry juice (Prunus cerasus) on melatonin
levels and enhanced sleep quality. Eur. J. Nutr. 2012, 51, 909–916. [CrossRef] [PubMed]
17. Keane, K.M.; George, T.; Constantinou, C.L.; Brown, M.A.; Clifford, T.; Howatson, G. Effects of Montmorency tart cherry (Prunus
Cerasus L.) consumption on vascular function in men with early hypertension. Am. J. Clin. Nutr. 2016, 103, 1531–1539. [CrossRef]
18. Schumacher, H.; Pullman-Mooar, S.; Gupta, S.; Dinnella, J.; Kim, R.; McHugh, M. Randomized double-blind crossover study
of the efficacy of a tart cherry juice blend in treatment of osteoarthritis (OA) of the knee. Osteoarthr. Cartil. 2013, 21, 1035–1041.
[CrossRef] [PubMed]
19. Cásedas, G.; Les, F.; Gómez-Serranillos, M.P.; Smith, C.; López, V. Bioactive and functional properties of sour cherry juice (Prunus
cerasus). Food Funct. 2016, 7, 4675–4682. [CrossRef]
20. Dimitriou, L.; Hill, J.A.; Jehnali, A.; Dunbar, J.; Brouner, J.; McHugh, M.P.; Howatson, G. Influence of a montmorency cherry
juice blend on indices of exercise-induced stress and upper respiratory tract symptoms following marathon running—A pilot
investigation. J. Int. Soc. Sports Nutr. 2015, 12, 1–7. [CrossRef]
21. Howatson, G.; McHugh, M.P.; Hill, J.A.; Brouner, J.; Jewell, A.P.; Van Someren, K.A.; Shave, R.E.; Howatson, S.A. Influence of tart
cherry juice on indices of recovery following marathon running. Scand. J. Med. Sci. Sports 2009, 20, 843–852. [CrossRef]
22. Bell, P.G.; Stevenson, E.; Davison, G.W.; Howatson, G. The Effects of Montmorency Tart Cherry Concentrate Supplementation on
Recovery Following Prolonged, Intermittent Exercise. Nutrients 2016, 8, 441. [CrossRef]
23. Levers, K.; Dalton, R.; Galvan, E.; O’Connor, A.; Goodenough, C.; Simbo, S.; Mertens-Talcott, S.U.; Rasmussen, C.; Greenwood,
M.; Riechman, S.; et al. Effects of powdered Montmorency tart cherry supplementation on acute endurance exercise performance
in aerobically trained individuals. J. Int. Soc. Sports Nutr. 2016, 13, 1–23. [CrossRef]
24. DiPietro, L.; Caspersen, C.J.; Ostfeld, A.M.; Nadel, E.R. A survey for assessing physical activity among older adults. Med. Sci.
Sports Exerc. 1993, 25, 628–642. [CrossRef] [PubMed]
25. Sebring, N.G.; Denkinger, B.I.; Menzie, C.M.; Yanoff, L.B.; Parikh, S.J.; Yanovski, J.A. Validation of Three Food Frequency
Questionnaires to Assess Dietary Calcium Intake in Adults. J. Am. Diet. Assoc. 2007, 107, 752–759. [CrossRef] [PubMed]
26. Hanwell, H.; Vieth, R.; Cole, D.; Scillitani, A.; Modoni, S.; Frusciante, V.; Ritrovato, G.; Chiodini, I.; Minisola, S.; Carnevale, V. Sun
exposure questionnaire predicts circulating 25-hydroxyvitamin D concentrations in Caucasian hospital workers in southern Italy.
J. Steroid Biochem. Mol. Biol. 2010, 121, 334–337. [CrossRef]
27. Centers for Disease Control and Prevention. National Health and Nutrition Examination Survey III: Body Measurements
(Anthropometry). In 3.3 Examination Procedures; Westat, Inc.: Rockville, MD, USA, 1988; pp. 3–16.
28. Roberts, H.C.; Denison, H.J.; Martin, H.J.; Patel, H.P.; Syddall, H.; Cooper, C.; Sayer, A.A. A review of the measurement of grip
strength in clinical and epidemiological studies: Towards a standardised approach. Age Ageing 2011, 40, 423–429. [CrossRef]
[PubMed]
29. U.S. Department of Health and Human Services; U.S. Department of Agriculture. 2015–2020 Dietary Guidelines for Americans, 8th
ed.; U.S. Department of Agriculture: Washington, DC, USA, 2015.
30. King Orchards. 32 oz. Montmorency Tart Cherry Juice Concentrate. Available online: https://www.kingorchards.com/product/
1-quart-32-oz-montmorency-tart-cherry-juice-concentrate/ (accessed on 1 February 2020).You can also read