PLEASE MIND THE GAP - A STUDY OF THE RELATION BETWEEN GREEN MARKETING OUTREACH AND CONSUMER DECISION-MAKING - DIVA PORTAL
←
→
Page content transcription
If your browser does not render page correctly, please read the page content below

PLEASE MIND THE GAP -
                          a study of the relation between green marketing outreach
                          and consumer decision-making

Bachelor’s Thesis 15 hp
Specialization: International Business
& Marketing

Department of Business Studies
Uppsala University
Spring Semester of 2021
Date of Submission: 2021-06-04

                                                  Hugo Bluhme
                                                  Jenny Lidman
                                                  Supervisor: Desirée Holm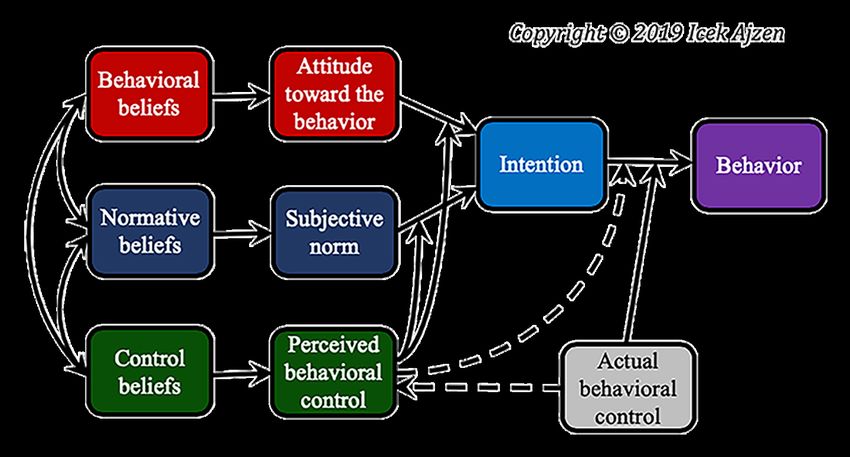
Abstract

Sustainability, and especially sustainable consumption, has become more important
throughout the years in line with the challenges of climate change. A large majority of
Swedish consumers have a positive attitude towards sustainable consumption. However, their
actions do not speak louder than words. Many have the intention of buying sustainable
products, but fewer actually buy sustainable products causing an attitude behaviour gap. This
study aims to investigate the relation between green marketing and consumer decision
making. Diving deeper into the grocery sector as well as the clothing sector the study
examines the differences regarding the matter of green marketing and consumer
decision-making.

With a theoretical starting point in the Theory of Planned Behaviour as well as green
marketing, this quantitative study shows that green marketing has an effect on a consumer’s
perceived behavioural control which in turn has an effect on the intention. However, the study
also states that there is a gap between the intention of buying sustainable products, influenced
by attitude, subjective norm and perceived behavioural control, and the actual behaviour to
buy sustainably. The study finds a moderately strong correlation between perceived
behavioural control and green marketing. Further on, the study also notices a difference
between the two sectors, where consumers are reached as well as affected by green marketing
to a higher extent within the grocery sector than in the clothing sector.

Key words: Theory of Planned Behaviour, green marketing, sustainability, grocery sector,
clothing sector, perceived behavioural control, attitude behaviour gap.

1. Introduction                                               3
1.1 Background                                                 3
1.2 Problematization                                           4
1.3 Purpose & research questions                               5

2. Literature review                                           5
2.1 Green marketing                                            5
    2.1.1 Greenwashing                                         6
    2.1.2 Nudging                                              7
2.2 Consumer behaviour                                         7
    2.2.1 Theory of Planned Behaviour                          8
    2.2.2 Attitude-behaviour gap                               9
    2.2.3 Criticism against the Theory of Planned Behaviour   10
2.3 Analytical framework                                      11

3. Methodological framework                                   12
3.1 Web-based survey                                          12
    3.1.2 Sampling                                            12
    3.1.3 Test of web-based survey                            13
3.2 Operationalization                                        13
3.3 Data collection                                           16
    3.3.1 Process of analyzing data                           16
    3.3.2 Internal consistency                                17
    3.3.3 Correlation                                         17
3.4 Research ethics                                           18
3.5 Criticism                                                 18

4. Empirical presentation                                     20
4.1 Survey results                                            20
    4.1.2 Survey demographics                                 20
    4.1.3 Green marketing                                     21
    4.1.4 Attitude behaviour gap                              22
4.2 Descriptive statistics                                    23
    4.2.1 Internal Reliability                                23
    4.2.2 Descriptives                                        24
4.3 Correlation tables                                        25

5. Analysis                                                   27
5.1 Variables of Theory of Planned Behaviour                  27

                                                               1
5.1.1 Attitude                                                      27
   5.1.2 Subjective norm                                               28
   5.1.3 Perceived behavioural control                                 28
   5.1.4 Attitude, subjective norm and perceived behavioural control   29
5.2 Attitude-behaviour gap                                             29
5.3 Green marketing                                                    31
5.4 Revised model                                                      32
5.5 Answering the research questions                                   33

6. Conclusion                                                          34
6.1 Future research                                                    36

7. References                                                          37
8. Appendices                                                          43

                                                                        2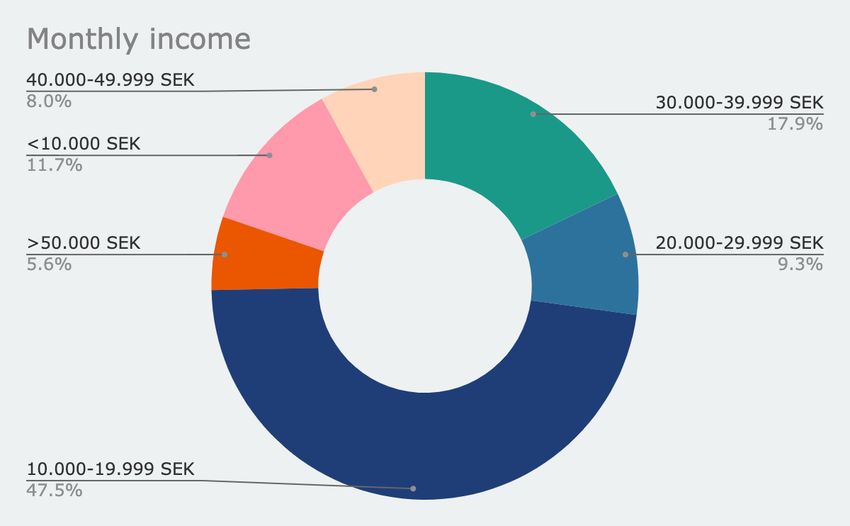
1. Introduction

1.1 Background
Ensuring sustainable consumption and production is a matter of great importance. So
important that is the 12th goal of UN Sustainable Development. Worldwide consumption and
production rests on the continued use of resources in a way that has destructive impacts on
the planet. The economic progression of the last century entails environmental damages
which inturn endangers the future of the systems we depend on for our development and
indeed, survival (UN, 2021).

The course of production and consumption needs to change, which factor should change first
may be a paradox akin to “The chicken or the egg”. But not according to Adam Smith who
proposed that “Consumption is the sole end and purpose of all production; and the interest of
the producer ought to be attended to only so far as it may be necessary for promoting that of
the consumer.” (Smith & McCulloch, 1828). The quote, though dated, stands as a focal point
in which our current economy is built on.

If we can determine the consumer as a greatly responsible party for the advent of sustainable
change, consumer choices and consumption behaviour is of great interest in the perpetuation
of sustainable change. In fact, during the United Nations conference in 1992 on Environment
and development it was emphasized that, in order to protect our environment and resources,
consumption patterns need to change through the adoption of different lifestyle changes and
overall consumption behaviour (Banbury et al., 2012).

So how can we impact consumer behaviour towards sustainability? In Sweden consumers are
becoming more involved in sustainability issues (Konsumentverket, 2018). The increased
understanding of environmental impact has increased anxiety regarding environmental issues
(ICA Gruppen, 2018). The increase in sustainable engagement has led to a greater demand
for greener products, even at a higher price (Differ, 2020). The increase of knowledge
surrounding sustainability and subsequent demand has resulted in corporate adaptation.

                                                                                           3
Although some studies suggest that 83 percent of Swedish consumers sometimes, often or
always choose sustainability (Differ, 2020), others suggest a gap between attitude and
behaviour when it comes to sustainable products. In the grocery industry however, labeling
and sustainable certificates are suggested to decrease this gap (Moser, 2015). Green
marketing, a term meaning marketing aiming to communicate sustainability has become more
commonplace in Sweden (Ottoson & Parment, 2016), perhaps in an attempt to further close
this gap.
1.2 Problematization
The question of sustainability has become a broad concept as well as buzz word over the
entire planet over the last few years. The impending need for sustainable adaptation has
perhaps entered the subconscious mind in a way never before seen. However, as the old
saying goes: actions speak louder than words. The attitude towards sustainable consumption
is not always reflected in consumer behaviour - where other factors than sustainability, are
involved in their purchase decision. When defining the variables driving a consumer towards
purchases many aspects come into consideration. But one dominant force which has affected
purchasing behaviour since the days of Edward Bernays is the force of public relations and
marketing (Gregersen, 2021).
At first sight there could be some amount of questionability towards the compatibility
between the goals and assumptions of sustainability and that of marketing. Traditional
marketing encourages growth and sustains an endless pursuit of satisfying needs and wants
and seems to have an enheirant view of resources as abundant, in contrast to the view of
sustainability. The contrasting nature of the two forces can be seen as inextricably
intertwined. Therefore one could take the optimistic view that marketing and behaviourism
has much to say on how we can affect sustainable consumption (White, Habib and Hardisty,
2019). Marketing with sustainable communicative intentions or “green marketing” has taken
a larger place in the marketing hemisphere, more in some sectors and less in others.
In Sweden, for example, the grocery store market has taken substantial leaps in the form of
green supply and the communication of sustainability through labels such as; Svanen, Fair
trade, Krav, MSC, GOTS (Naturskyddsföreningen, 2021). Also communicating sustainable
4choices through television ads and digital platforms (ICA Gruppen, 2021; Coop, 2021). In the
Swedish grocery sector the question of sustainability is one of relevance and efforts to
communicate sustainability and demand for sustainable products are apparent. The choices
presented in a Swedish grocery store (sustainable or not) are perhaps clearer to distinguish
than sustainable choices in other retail sectors, the clothing sector included. Lately, clothing
retailers are pushing sustainable choices, with actors such as Levis and Zalando launching
sustainability campaigns in 2021 (Tanuvi, 2021; Mynewsdesk, 2021). With labels signaling
sustainable textile production on the way, the Swedish clothing industry seems to be
following the same path as the grocery industry (Naturskyddsföreningen, 2020). The
prerequisites for communication and possibility of sustainable choices are in many cases not
the same. The possibility of impact from green marketing for sustainable choice, however,
are. If the Swedish clothing sector is moving down the same path as the grocery sector,
looking at what challenges and consumer insights are needed to effectively influence
consumer decision making is a great resource.
1.3 Purpose & research questions
The purpose of this study is to examine the relation between green marketing and consumer
behaviour, comparing them over two different retail sectors: grocery and clothing. This study
aims to answer:
- Is there a relation between green marketing outreach and consumer decision-making?
- How does this relation differ between retail sectors?
2. Literature review
2.1 Green marketing
Green marketing is a concept originating back to the 1970s. However, in accordance with the
growing relevance of environmental sustainability throughout the world, its meaning has
changed as years have gone by. Looking back, green marketing has been viewed as a tool for
traditional marketing where focus lies on specific environmental problems. Nowadays it is
5much more than that - influencing business strategies throughout the entire company with a
broader focus on global sustainability issues, not only focusing on products but markets as a
whole (Dangelico & Vocalelli, 2017). Green marketing is defined as “actions directed to all
consumers, and incorporates a broad range of marketing activities (e.g., price, planning,
process, production, promotion, and people) designed to demonstrate the firm's goal of
minimizing the environmental impact of its products and services” (Groening et al., 2017, p
1850). Peattie (2001) emphasizes that green marketing could be crucial for solving
environmental problems, and thereby reducing unsustainable consumption. Further, Cherian
and Jacob (2012) advocates that consumers can become more sustainably aware and make
greener choices, with the help of green marketing.
Green marketing has, as with all other theories and methods, received criticism. One of the
critics is the paradoxicality in expressing concerns about the environmental crisis, originating
in unsustainable consumption, by more consumption (Peattie & Crane, 2005).
Looking at the impact of green marketing, it is relevant to consider the possibilities of a time
lag between seeing the green marketing efforts and actually buying something. These might
also differ depending on the sector, where e.g. food is quickly consumed and relatively low in
cost while clothing can be seen as more long term and might be a more pricey investment.
2.1.1 Greenwashing
With green marketing also comes a lot of responsibility regarding actually being sustainable
and not only saying it. Greenwashing is a term that originated from the 1980s. It received a
lot of attention for illustrating the practice of making inflated and exaggerated claims of
sustainability to earn market shares (Dahl, 2010). Greenwashing has been given many names
throughout the years including; eco-washing, whitewash, green image washing and green
makeup. Greenwashing can be described as “a form of misleading advertisement to promote
the product’s, goals, or policies of an organization and thus increase the aggregate benefits of
the product” (Da Silva et. al., 2019, p 228). It is often used as a tool for firms managing their
brand perception towards the public eye (Da Silva et. al., 2019). Greenwashing has increased
during the last few years - perhaps in regards to the increasing demand of green products, as
well as regulatory agencies’ slowness in forming standards to control the process (Dahl,
2010). Because of this, consumer skepticism regarding green products has evolved. This can,
6and has in the past, led to mistrust for companies and their sustainable solutions in their
production, distribution and/or commercialization processes (Da Silva et. al., 2019).
2.1.2 Nudging
Companies using green marketing, as well as greenwashing, have a mutual goal: to affect the
consumer to purchase their green product. To be able to affect as well as change behaviours
the concept of nudging was created by Thaler and Sunstein (2008). They point out that the
decision maker can be affected to make a decision that favours both her/him as well as
society at large, by creating a change in the social and physical decision-making
environment. Individuals are “nudged”, or pushed, towards the desired direction by
encouraging favourable alternatives without limitations (Thaler & Sunstein, 2008). This
“nudge” might lead to a changed consumer behaviour, resulting in successful green
marketing as well as a happy consumer who purchased a product that favoured her/him but
also the society at large - making the consumer feel good about themselves.
2.2 Consumer behaviour
Consumer behaviour is a complex phenomenon that has been explained by numerous
different models throughout the years. Factors such as values, beliefs, social norms, context,
habits, attitudes and individual’s information processing capabilities play significant roles in
how our behaviour is determined (Bamberg et al., 2003; Biel, Dahlstrand & Grankvist, 2005;
Nguyen & Johnson, 2020; Stern, 2000). Consumer behaviour research focuses on
understanding, predicting and explaining how and why consumers behave in a certain
manner, where behaviour can be both external and internal.
During the last few years a new line of research has evolved, called transformative research.
Mick (2006, p. 2) defines it as “investigations that are framed by a fundamental problem or
opportunity, and that strive to respect, uphold, and improve life in relation to the myriad
conditions, demands, potentialities, and effects of consumption”. As opposed to traditional
consumer behaviour, transformative consumer research focuses on finding solutions to
consumer problems which often emerge from over-consumption. Therefore, this study can be
connected to transformative consumer research.
72.2.1 Theory of Planned Behaviour
Ajzen’s (1991) Theory of Planned Behaviour (TPB) is a well-used theory within research
regarding sustainable behaviours (see Appendix 2). Many researchers have adopted the TPB
in their own studies connected to sustainable consumption (Dunn et al., 2011; Lu et al., 2010;
Zur & Klöckner, 2014).
The theory states that the intention affects the behaviour and will therefore decide if a
behaviour will happen or not. This intention is divided into three categories which are;
attitude, subjective norm and perceived behavioural control. The stronger these different
variables are, the more likely it is for a behaviour to happen (Ajzen, 1991).
Behind these three variables are beliefs which influence the different variables. Ajzen (1991)
explains that behaviour can be seen as a function of salient information relevant to the
behaviour. The salient information, the beliefs, are what will determine an individual’s
intentions and behaviours in the end. Therefore, they also have an effect on attitude,
subjective norm and perceived behavioural control. With these three variables in mind, there
is a general rule basically saying the higher levels of positive attitude and subjective norm as
well as perceived behavioural control, the stronger an individual’s intention is, the likelier it
is to execute a behaviour. However, the relative importance of the variables, and their effect
on the intention, might vary depending on behaviours and situations. Therefore, in some
situations perceived behavioural control might have a significant impact on the intention,
sometimes it may be attitudes that are of more importance and in other situations all three
variables make their own contributions to the intention. However, the perceived behavioural
control is the only factor that can affect the behaviour directly, which is shown in the TPB
model by Azjen (Appendix 2).
Behaviour can have many meanings. Ajzen and Fishbein (1977) describe behaviour as an
action that can be observed. Further, they point out that controlled decision making is the
base of behaviour and that the most suitable tool for predicting it is an individual’s intention.
Looking at the study through this lens: there can be no sustainable behaviour or
decision-making without an intention to act sustainably.
8Values, opinions and interpretations are what form the attitudes of an individual regarding
what result the behaviour will lead to. It can be seen as a scale which refers to the level an
individual has a favourable or unfavourable appraisal of behaviour. If an attitude is very
positive towards a behaviour, the intention will also be much stronger. However, this does not
mean that a behaviour will happen. Even if there is a positive attitude, and therefore a strong
intention, towards the behaviour there are still other variables - subjective norm and
perceived behavioural control - that affect the outcome (Ajzen, 1991; Vermier & Verbeke,
2008).
Subjective norms are more of a social factor where the perceived social pressure to perform
the behaviour or not is taken into consideration (Vermier & Verbeke, 2008). High levels of
subjective norms indicates that an individual is highly affected by its social network - and
therefore social pressure (Azjen, 1991).
An individual's perceived behavioural control is measured by the ability to execute the
behaviour - if the individual finds it as something easy to do, or hard. This also corresponds
to if the individual has the resources as well as considers them capable for the behaviour, e.g.
having enough money. If this factor is perceived to be strong, there is a higher chance of the
behaviour actually happening (Azjen, 1991). This variable also considers past experiences as
well as foreseen difficulties or facilitating conditions (Vermier & Verbeke, 2008).
2.2.2 Attitude-behaviour gap
Attitude-behaviour gap is defined as a dissonance between attitude and behaviour (Ajzen &
Fishbein, 1977). The so-called “Green gap” is closely related to the Theory of Planned
Behaviour. Although TPB has shown promise in predicting human behaviour, in the context
of green behaviour this theory seems to experience issues (ElHaffar, Durif and Dubé, 2020).
A favourable attitude can be considered a good precursor for behaviour in accordance with
said attitude, however this does not always seem to be the case in sustainable consumption.
Empirical studies in the domain of sustainable or green consumption find that attitude or
purchasing intentions don’t necessarily translate into actual purchasing behaviour. Despite an
increase in sustainable attitudes to green products they commonly end up not buying
sustainably, hence the term attitude-behaviour gap (Park and Lin, 2020).
9Understanding the link between ethical attitudes and purchasing behaviour has been central in
the research on the attitude behaviour gap. However, ethics might be a secondary factor to
other decisional factors. In the case of fashion this might be the perceived conflict between
sustainable choices and fashionable conflict. Other factors identified to drive the gap are;
demographics, lifestyle value and knowledge (Park and Lin, 2020). Looking at the food
industry, studies suggest that behavioral intention and behavior are strongly, though never
perfectly, correlated. In addition it is pointed out that perceived low availability of sustainable
products could be at fault for the discorrelation between attitude and intention. It is also
pointed out that some of the key determinants; involvement, perceived availability, and
perceived consumer effectiveness can be successfully affected through communication and
marketing efforts (Vermier & Verbeke, 2006)
Green marketing, including greenwashing and nudging, might have an effect - either positive
or negative - on consumer’s intentions regarding sustainable purchases. The intention is
affected by three variables according to TPB which are attitude, subjective norm and
perceived behavioural control. However, the intention does not always align with the actual
behaviour causing an attitude behaviour gap.
2.2.3 Criticism against the Theory of Planned Behaviour
As with all theories, there are always two sides of the same coin. The Theory of Planned
Behaviour has received criticism over the years. The theory has received criticism saying it
focuses solely on rational reasoning and therefore excludes unconscious factors that influence
behaviour (Sheeran et al., 2013) as well as neglects the role of emotions in human behaviour
(Conner et al., 2013). The study acknowledges that there are limitations to the chosen theory,
however also recognizes Azjen’s (2011) response to this criticism in his article explaining
that the theory is much more complex. He acknowledges that the theory focuses on the
controlled factors of human information processing and decision making, such as
goal-directed behaviours. However, this does not mean it excludes factors stated in the
criticism. He further explains that the Theory of Planned Behaviour does not make an
assumption that behavioural, normative and control beliefs are generated in an unbiased and
rational fashion which critics might have suggested (Azjen, 2011). Other scientists have
backed Azjen in this to prove the theory’s complexity, clarifying how the factors emotion and
affect has an indirect impact on behaviour (Clark & Wadell, 1983)
102.3 Analytical framework
Figure 1. Analytical framework inspired by the Theory of Planned Behaviour (Azjen, 1991).
The study will examine if there is a relation between green marketing and consumer
decision-making, which translates to behaviour in our model. Our analytical framework
(Figure 1) is based on the Theory of Planned Behaviour model but has been revised to
capture the purpose of our study in a more relevant way. Therefore, the components beliefs
and actual behavioural control, which are shown in the original model of TPB, have been
overlooked. This is because the study does not aim to examine what underlying factors affect
the variables attitude, subjective norm and perceived behavioural control, rather solely how
green marketing affects the variables and therefore how this in turn affects the intention and
behaviour in the end. Looking at consumers' intentions affected by green marketing, as well
as their behaviour, might show an attitude behaviour gap. Further, Azjen (1991) emphasizes
that perceived behavioural control can have a direct effect on behaviour as well an indirect,
through the intention, which is why an arrow has been added between perceived behavioural
control and intention.
Since the study is focusing on the relation between green marketing and consumer
decision-making, it is relevant to include green marketing in the analytical framework. Green
marketing, as well as concepts connected to green marketing, have been explained to be able
to perform an in depth analysis, which is why it is needed in the analytical framework.
113. Methodological framework
With the Theory of Planned Behaviour as a foundation, this study aims to examine the impact
of green marketing on consumer’s intentions and by extension behaviour. This phenomenon
is examined through a web-survey and put into the context of two different retail sectors. The
study has its base in existing theoretical literature and aims to deduce and present the data in
a statistical format. The theoretical base and problem formulation that is presented above has
been gathered through articles, journals, books, websites and previous studies.
3.1 Web-based survey
The chosen method for this study is a web-based survey, created through Google Forms. A
web-based survey invites potential respondents to a webpage where questions related to the
study are answered. The internet is a tool that can help to obtain a great number of
respondents to the survey, at a minimum cost (Bryman & Bell, 2015), which is why this
method has been chosen. In this study, the collected data from the web-survey was
transformed to statistical measurements which can strengthen the analysis and conclusion.
Previous studies regarding the use of TPB and sustainable behaviour surveys have been
conducted (Vermeir & Verbeke, 2008; Park & Lin, 2020; Sultan, et.al, 2020). There are
several advantages to composing a web-survey. Firstly, a larger number of individuals can be
reached which will improve the possibilities for generalizing. The respondents can also
choose when and where they want to participate in the study, since it is conducted online,
which is beneficial in the pandemic of COVID-19. Further, the external influence is reduced
with this method, which might be higher if e.g. interviews were conducted. Because of this,
the risk for the interviewer effect, where the answers might be altered to align with what the
interviewer wants to hear, will be diminished (Bryman & Bell, 2015).
3.1.2 Sampling
The sampling for the web-survey was limited to Swedish consumers between the ages under
20, 20-29, 30-39, 40-49, 50-59 and over 60. The web-survey was distributed through the
authors' acquaintances. This method refers to convenience sampling, which is a method often
used to save both time and money (Bryman & Bell, 2011). The respondents, as well as the
individuals who saw the web-survey, were also encouraged to share the web-survey further
12meaning that the selection was also partly made through a snowball sample. The selection
had no other restrictions than Swedish consumers, therefore a snowball sample can be
motivated since it will contribute to a better generalization (Bryman & Bell, 2015).
3.1.3 Test of web-based survey
To ensure a high quality web-survey a pilot web-survey was made. Individuals have different
interpretations of e.g. words and questions, which is why it can be important to conduct a
pilot study. A pilot study can be useful to get a chance to change or eliminate parts of the
survey that seems unclear with the help of other respondents, in order to improve the actual
web-survey (Bryman & Bell, 2015). Therefore, ten Swedish consumers were asked to take
part in the pilot study, varying in ages and gender. Besides answering the web-survey, they
were also instructed to point out eventual misspelling, unclear questions or answer options as
well as other comments they might have that would help improve the web-survey. The pilot
study proved to be very helpful, resulting in some clarifications to the web-survey.
3.2 Operationalization
The validity of results benefit from operationalization of the abstract variables and allow for a
measurability of the abstractual concepts (Bryman & Bell, 2015). In this manner, the survey
operationalizes the concepts and variables presented in the model. The description of the
survey included background regarding the survey, what the data would be used for and how
long the survey is expected to take. The first questions (Appendix 1) aim to give
demographical understanding of the respondents; age, gender and income. So that in
hindsight we can analyze the demographic spread of the respondents to later credit or
discredit holistic results.
The later questions (Table 1) aim to operationalize the variables presented in Theory of
Planned Behaviour, attitude, subjective norm and perceived behavioural control. To
accurately operationalize these variables survey questions have been borrowed from peer
reviewed survey studies. According to TPB attitude is defined as values, opinions and
interpretations that form an attitude, if the attitude is positive this gives greater inclination to
behaviour in accordance with the attitude (Ajzen, 1991; Vermeir & Verbeke, 2008). The
questions regarding the variable attitude (Table 1, 1-3) are taken from a peer reviewed survey
that aims to examine the respondents' inclination to a positive attitude towards sustainable
13consumption (Vermeir & Verbeke, 2008). The following questions “My friends/family/society
who influence my buying behavior think I should purchase sustainable products” evaluates
the respondents' subjective norm and are also from Vermeirs & Verbekes (2008) survey.
Subjective norms are defined as the perceived social pressure to perform the behaviour or
not, where high levels of subjective norms indicate that an individual is highly affected by its
social network (Ajzen, 1991; Vermeir & Verbeke, 2008). Moreover, the third variable of
perceived behavioural control is defined as: the ability to execute the behaviour - if the
individual finds it as something easy to do, or hard (Ajzen, 1991; Vermeir & Verbeke, 2008).
The third questions of: I experience many easy opportunities to purchase sustainably, I
experience finding sustainable products as easy, I experience buying sustainable products as
easy, are also borrowed for Vermeir & Verbeke (2008) and examines the subjective
inclination of ease to perform the behaviour. Lastly, the final independent variable of Green
marketing is operationalized through the questions; I have been reached by green marketing
in the sector and I have been affected by green marketing in the sector, to examine whether
the respondent has been reached and affected by green marketing efforts. Whether the reach
and effect of green marketing has a relation to higher intention or behaviour will thus credit
or discredit its place within the analytic model.
Now that we have covered the independent variables, this leads us to the dependent ones of
intention and behaviour. The question of; I aim to purchase sustainably, If I had to buy a
product today I would buy a sustainable version, I will purchase sustainably even if the
sustainable version of the product is more expensive, measures the respondents intention and
can be put in relation to the previous independent variables. These questions are borrowed
from Sultan, Tarafder, Pearson and Henryks survey study from 2020. In the same manner the
next question of; I buy sustainable products, Last time I purchased I bought sustainable
products, If there was a sustainable version of the product I wanted, I bought it,
measures the respondents' behaviour and are also questions used by Sultan, et.al (2020). If,
there indeed is an attitude-behaviour gap presented the final question of; If my intention of
buying sustainable does not align with my behaviour it is because of: Price, Low availability,
Distrust of sustainable products, Not enough knowledge, Do not care, Other (self reported)
aims to gain insight into this gap. Presenting the factors of perceived low availability
(Vermeir & Verbeke, 2006), Distrust of sustainable products or insufficient knowledge (Park
and Lin, 2020), price (Differ, 2020) or have the option to self report a reason through other.
The demographic & lifestyle factors affecting the gap (Park and Lin, 2020) can to some
14degree be measured through the results of the first three questions. All of the survey questions
are then repeated in the context of two different retail sectors through the segments; When
buying groceries and When buying clothes. This to examine the research question; How does
this relation differ between retail sectors?
Table 1. Operationalization of variables.
Table 1 Operationalization of variables
Variable Survey questions
1. I am willing to change my purchasing habits if this helps the
environment
Attitude 2. My attitude toward purchasing sustainable products is positive
(Vermeir & Verbeke, 3. My attitude toward purchasing sustainable products is
2008) meaningful
4. My family who influences my buying behavior thinks I should
purchase sustainable products
5. My friends who influence my buying behavior think I should
purchase sustainable products
Subjective norm 6. My society who influences my buying behavior thinks I should
(Vermeir & Verbeke, purchase sustainable products
2008)
Perceived behavioural
control 7. I experience many easy opportunities to purchase sustainably
(Vermeir & Verbeke, 8. I experience finding sustainable products as easy
2008) 9. I experience buying sustainable products as easy
10. I have been reached by green marketing in this sector
11. I have been affected by green marketing in this sector
Green marketing
12. I aim to purchase sustainably
13. If I had to buy a product today I would buy a sustainable
Intention (Sultan, et.al, version
2020) 14. I will purchase sustainably even if the sustainable version of
the product is more expensive
15. I buy sustainable products
16. Last time I purchased I bought sustainable products
17. If there was a sustainable version of the product I wanted, I
Behaviour (Sultan, et.al, bought it
2020)
1518. If my intention of buying sustainable groceries/clothing does
not align with my behaviour it is because of:
- Price
- Low availability of products
- Distrust of sustainable products
Gap (Vermeir & - Not enough knowledge
Verbeke 2006; Park & - Do not care
Lin, 2020; Differ, 2020) - Other:
3.3 Data collection
The web-survey was distributed through the author’s social media - posting both on LinkedIn
as well as Facebook. The posts were similar to each other, shortly summarizing the study
with a request to participate in the study as well as to further share the web-survey. Social
media is a platform well used by Swedish consumers and has increased since last year, which
might be partly because of the ongoing COVID-19 pandemic (Internetstiftelsen, 2020).
Because of this, the use of social media as a tool to obtain respondents to the web-survey can
be motivated. Further, Facebook is used by 81 percent of Swedish consumers, and LinkedIn
is used by 32 percent. LinkedIn was chosen as an attempt to reach out to older individuals
since the channel is mostly used by individuals between the ages of 36-45 years
(Internetstiftelsen, 2020). The web-survey was open for a week and a total of 162 responses
were collected.
3.3.1 Process of analyzing data
The survey was conducted using Google Forms. When transferring data from a web-based
survey into a statistical program there is a very minimal, almost non-existing risk, for errors
since it is an automated process (Bryman & Bell, 2011). When working with and analyzing
the data the statistical program Statistical Package for the Social Sciences (SPSS) was used.
In this study Cronbachs alpha is first presented, followed by descriptive statistics as well as
correlation tables. In order for the answers to be analyzed they were coded into numbers as
accordingly: Strongly agree=5 to Strongly disagree=1, Female= 1 and Male=2,income were correlated with the other variables with no significance. Therefore these
variables have been removed from the correlation tables and descriptive statistics and
presented as a demographic overview of the survey respondents.
3.3.2 Internal consistency
Internal consistency measures to which extent items in a test measure the same concept
(Bryman & Bell, 2015; Dennick & Tavakol, 2011). Because of this, the respondents were
asked different questions (items) which measured the same variable (concept). Cronbach’s
alpha is a commonly used tool to measure the internal consistency (Dennich & Tavol, 2011),
which is why it has been used in this study as well. The internal consistency is measured
between the coefficients 0 and 1, where 0 gives no internal consistency and 1 gives perfect
internal consistency. The general level of acceptance for good internal consistency is 0,7
(Bryman & Bell, 2015).
3.3.3 Correlation
To be able to examine the relation between the variables of the study it is common to use
correlation. In this study, the answer options were nominal and could be ranked from Strongly
agree to Strongly disagree which is why Spearman’s rank correlation coefficient was a
favourable measurement. A perfect negative correlation has a value of -1 while a perfect
positive correlation has a value of 1, meaning 0 is no correlation at all (Bryman & Bell,
2015). The correlation coefficients had a value between 1 and -1. In accordance with
recommendations from Jacobsen (2002), as well as what is recommended in general, the
study suggests that a strong correlation has a value over 0,5 if positive or under -0,5 if
negative. Values in between 0,3 to 0,5 (or -0,3 to -0,5 if negative) are moderately strong and
values under 0,3 (or over -0,3 if negative) are seen as a weak correlation. Two tailed 0,01
significance indicates that the results are significant to 99%, a 1% risk that the correlation is
measured by chance. This significance makes use of both tails of the normal distribution
curve. A two tailed significance 0,05 indicates a 5% risk that the correlation is measured by
chance (King and Eckersley, 2019).
3.4 Research ethics
When conducting a study, research ethics - together with its eventual issues - must be
considered. The researcher has certain responsibilities towards the research itself as well as to
17the society and research community as a whole regarding ethical aspects, so called
professional ethics. It is important to never be persuaded by others to portray study results in
a certain way since angled studies can cause harm (Swedish Research Council, 2017). With
this in mind, the study has been conducted with strict objectivity to ensure that research ethics
has been maintained.
Since the internet was the chosen method for data collection, it is important to be informed
about potential ethical matters regarding this method (Bryman & Bell, 2011). Anonymity is a
crucial factor to maintain high ethical standards, in order to protect the participants from any
damage caused by their participation in the web-survey. This includes both consent and
confidentiality (Swedish Research Council, 2017). Throughout the entire study, all
participants were held anonymous. Further, an introduction was made on the first page of the
web-survey clarifying the purpose of the study as well as ensuring the participants voluntary
participation, the data collection method and anonymity. This to make sure the web-survey
aligned with the Swedish Research Council (2017) recommendations.
3.5 Criticism
Although web-based surveys can be considered effective through time efficiency, the
development of a web-based survey takes time. A risk with this research method is that
respondents can answer according to their willed perception of self rather than the realistic
view. With premade answers and scales also comes the cons of respondents not being able to
answer in their own words - meaning that this study perhaps misses valuable opinions and
deeper analytic knowledge (Bryman & Bell, 2015). Something that is also important to keep
in mind is that e.g. the option “Strongly agree” can have very different meanings depending
on who is responding to the survey. Two people might be on the exact same level regarding
e.g. the affect of green marketing, but one might respond “Strongly agree” and one might
respond “Somewhat agree”.
The sampling aimed to gather numerous answers from Swedish consumers of all ages chosen
for the study. However, a majority of the respondents were between 20-29 years old. This can
be negative for the diversity of respondents in the study, since it might not reflect Swedish
consumers as a whole. This might have been caused by the convenience sampling that was
made to conduct the study, where the survey was distributed to the authors' acquaintances
18(Bryman & Bell, 2011). Further, there is always a risk that individuals who are not interested
in the subject, or feel that the survey is badly constructed, will not participate (Bryman &
Bell, 2015). In contrast, individuals who are interested in sustainability might be more
inclined to participate. However, this could lead to a skewed result where more sustainably
positive respondents partake, which in turn could lead to biased results.
Even though there is a negative side to this type of method - as there is with all methods - the
benefits outweigh the disadvantages. Other studies regarding the same subject have used this
method in a successful manner before, which is why the study can be confident with the
chosen method as well. Further, the survey questions are borrowed from previous studies
which also strengthens the method of choice. Looking at the fact that a majority of the
respondents are between 20-29, it can be seen as negative. However, when the demographic
variables were correlated with the rest of the variables no significance was found.
194. Empirical presentation
4.1 Survey results
4.1.2 Survey demographics
Figure 1. Gender Figure 2. Age
Figure 3. Monthly income
The survey had 162 respondents. As shown in figure 1 the respondents were 58% female and
42% male. As shown in figure 2, when it comes to age the largest segment is that of 20-29
which represents 77,8% of the answers. 30-39 is the second largest segment and represents
11.7% of the results. Figure 3 shows the monthly income intervals of the respondents. 47,5%
of the respondents have an income of 10.000-19.999kr and the second largest range of
income is 30.000-39.000kr. The demographic survey data has been tested in relation to the
20variables and no correlation was found between gender, age, monthly income and the
operationalized variables.
4.1.3 Green marketing
Figure 4. Green marketing reach (Grocery) Figure 5. Green marketing reach (Clothing)
The operationalized variable of Green marketing aims to consider two aspects of green
marketing; whether the respondents have been reached and whether the respondents have
been affected. The reach infers whether the variable has any impact within the population and
the effect implies a subjective influence of green marketing. As seen in figure 4, 133 of 162
(86%) respondents state that they strongly or somewhat agree with being reached by green
marketing in the grocery sector. In contrast 96 of 162 (59,2%) of respondents agree with the
same statement in the clothing sector, although 43.2% of the 96 report that they somewhat
agree. This means that 40,8% disagree in contrast to the meager 17.2% when it comes to the
grocery sector.
Figure 6. Affect of green marketing (grocery) Figure 7. Affect of green marketing (clothing)
21When it comes to the effect of green marketing a larger difference between the retail sectors
can be observed. In general respondents have been more affected by green marketing in the
grocery sector than the clothing sector.
4.1.4 Attitude behaviour gap
In order to analyze a potential gap between intention and behaviour the respondents were
asked to name what caused their behaviour not to align with their intention. They could
choose between Price, Low availability of products, distrust of sustainable products, not
enough knowledge, do not care or choose to write a comment under Other. The respondent
was able to choose several options.
Figure 8. Figure 9.
Reasons for attitude behaviour gap (grocery) Reasons for attitude behaviour gap (clothing)
As shown in figure 8, price was the most common reason for the grocery sector with a
frequency of 136 clicks. Low availability of products was the second most common reason
with 40 clicks, followed by distrust of sustainable products with 33 and Not enough
knowledge with 28. Do not care was chosen as a reason 6 times. More than one reason could
be reported, therefore resulting in a higher total frequency than the population of 162.
When the same question was asked regarding the clothing sector (figure 9) the reasons shifted
a bit. The most common reason was now low availability of products which was chosen 102
times. Price followed with 96 clicks. After that, the most common reason for the gap was not
enough knowledge with 50 clicks. Distrust of sustainable products was chosen 32 times, and
Do not care was filled in 7 times. Again more than one reason could be reported, therefore
resulting in a higher total frequency than the population of 162.
224.2 Descriptive statistics
4.2.1 Internal Reliability
The internal reliability is presented through Cronbach's Alpha in the table below, the
Cronbach’s alpha scale is from 0 (no reliability) to 1 (strong reliability). This survey has a
preferred acceptance level of 0,7 which suggests a high reliability level. All values except
subjective norms are above this threshold, however a level between 0,5-0,7 can be considered
a moderately reliable scale and will still be used moving forward in this report (McMurray,
Brownlow, Hinton and Strang, 2004). The items were tested in SPSS with “if item deleted”
without any higher reliability and are therefore presented without this option. The N in this
case represents the number of items (variables) measured, three or two across two sectors,
resulting in six and in one case four.
Table 2 reliability statistics
Reliability Statistics
Cronbach's
Alpha N of Items
Attitude 0.836 6
Subjective 0.559 6
Norms
Percieved 0.732 6
Behavioural
Control
Green 0.720 4
Marketing
Intention 0.817 6
Behaviour 0.796 6
234.2.2 Descriptives
In Table 3 presented below the mean and standard deviation for both retail sectors can be
observed. The scale of 1-5 represents the interval of 1= Strongly disagree, 2=Somewhat
disagree, 3= Do not have an opinion, 4= Somewhat agree, 5=Strongly agree. The N in this
case describes the number of data inputs, since 3 or in one case 2 questions operationalize the
variables this becomes: 162*3 (486) and 162*2 (324). The highest mean and lowest standard
deviation can be found within the variable Attitude in both retail sectors. Intention and
behaviour can be observed to have a higher mean in the grocery sector than the clothing
sector. The greatest difference in mean is the variable of perceived behavioural control with a
1,18 difference between the sectors.
Table 3 Descriptive statistics
Descriptive Statistics Clothing Descriptive Statistics Grocery
N Mean Std. Deviation Mean Std. Deviation
Attitude 486 4.02 1.032 4.29 0.826 Attitude
Subjective 486 3.15 1.124 3.71 1.073 Subjective
Norms Norms
Perceived 486 2.60 1.165 3.78 1.087 Perceived
Behavioural Behavioural
Control Control
Green 324 3.23 1.251 3.99 1.070 Green
Marketing Marketing
Intention 486 3.14 1.257 3.73 1.089 Intention
Behaviour 486 2.93 1.406 3.56 1.180 Behaviour
244.3 Correlation tables
Table 4 Correlations grocery
Correlations Grocery
Perceived
Subjective Behavioura Green
Attitude Norms l Control Marketing Intention Behaviour
Spearman' Attitude Correlation 1,000
s rho Coefficient
Sig.
(2-tailed)
N 486
Subjective Correlation ,162** 1,000
Norms Coefficient
Sig. 0
(2-tailed)
N 486 486
Perceived Correlation 31 77 1,000
Behavioura Coefficient
l Control
Sig. 498 91
(2-tailed)
N 486 486 486
Green Correlation 13 95 ,343** 1,000
Marketing Coefficient
Sig. 819 89 0
(2-tailed)
N 324 324 324 324
Intention Correlation ,324** 29 ,100* ,217** 1,000
Coefficient
Sig. 0 522 28 0
(2-tailed)
N 486 486 486 324 486
Behaviour Correlation ,342** 44 ,115* ,116* ,553** 1,000
Coefficient
Sig. 0 332 12 38 0
(2-tailed)
N 486 486 486 324 486 486
**. Correlation is significant at the 0.01 level (2-tailed).
*. Correlation is significant at the 0.05 level (2-tailed).
The findings presented in the grocery sector encapsule the findings of Vermier & Verbecke,
that intention and behaviour are correlated though never perfectly. However a correlation of
25,553 suggests the existence of an attitude behaviour gap. All variables except subjective
norms are to some degree correlated to intention and behaviour. This could perhaps be due to
the different perception in the effect of subjective norms, many respondents report a
variability between the influence of family, friends and society. Green marketing shows a two
tailed significant correlation with both intention and behaviour although the correlation is on
the lower end 0,217 & 0,116. Attitude is shown to have a higher correlation with intention
than the other independent variables.
Table 5 Correlations clothing
Correlations Clothing
Perceived
Subjective Behavioural Green
Attitude Norms Control Marketing Intention Behaviour
Spearman Attitude Correlation 1,000
's rho Coefficient
Sig.
(2-tailed)
N 486
Subjective Correlation ,251** 1,000
Norms Coefficient
Sig. 0
(2-tailed)
N 486 486
Perceived Correlation ,209** ,145** 1,000
Behaviour Coefficient
al Control
Sig. 0 1
(2-tailed)
N 486 486 486
Green Correlation ,138* ,271** ,385** 1,000
Marketing Coefficient
Sig. 13 0 0
(2-tailed)
N 324 324 324 324
Intention Correlation ,357** ,124** ,308** ,318** 1,000
Coefficient
Sig. 0 6 0 0
(2-tailed)
N 486 486 486 324 486
Behaviour Correlation ,309** ,132** ,335** ,246** ,521** 1,000
Coefficient
Sig. 0 4 0 0 0
(2-tailed)
26N 486 486 486 324 486 486
**. Correlation is significant at the 0.01 level (2-tailed).
*. Correlation is significant at the 0.05 level (2-tailed).
In the clothing sector we can again observe a similar correlation of 0,521 between intention
and behaviour. This again suggests a low to moderate correlation which could indicate the
existence of a gap. Attitude (0,357) again presents the highest correlation towards intention
although in this sector it is closely followed by green marketing (0,318) and perceived
behavioural control (0,308).
In comparison both the grocery sector and the clothing sector show an imperfect correlation
between intention and behaviour. Green marketing seems to have a greater impact on
intention rather than behaviour. In both sectors perceived behavioural control has a greater
correlation with behaviour than intention although the difference is miniscule. Perceived
behavioural control plays a comparatively greater part in the clothing sector than the grocery
sector. Perceived behavioural control and green marketing also seem to be relational in both
sectors with a moderately strong positive correlation of around 0,35 in both sectors. The N in
the correlation tables again describes the number of data inputs, since 3 or in one case 2
questions operationalize the variables this becomes: 162*3 (486) and 162*2 (324).
5. Analysis
5.1 Variables of Theory of Planned Behaviour
5.1.1 Attitude
The general attitude towards sustainability, regardless sector, was positive with a mean over 4
(grocery 4,29 and clothing 4,02). This suggests that swedish consumers are inclined and
positive towards consuming sustainably. The attitude being lower in the clothing sector
suggests that consumers perhaps value sustainable consumption more in certain sectors, in
this case the grocery sector. Looking further at the intention the mean decreases, resulting in a
mean of 3,73 for grocery and 3,14 for clothing. The difference between sectors is therefore
larger in intention than it is in attitude, suggesting other factors are at play decreasing the
27strong reported attitude. Attitude has a moderately strong positive correlation with intention
and behaviour in both observed retail sectors (tables 4 & 5). Meaning that attitude is shown to
be significant to consumer intention and behaviour. Attitude being both reportedly strong in
both sectors and correlated to intention and behaviour is good news for sustainable
consumption, as the stronger the variables in TPB are the more likely a behaviour is to occur.
Attitude is also shown to have low to no correlation with green marketing, suggesting that the
reach and affect of green marketing has no measurable effect on attitude.
5.1.2 Subjective norm
Subjective norms are defined as a social factor where the perceived social pressure to perform
the behaviour or not is taken into consideration (Vermier & Verbeke, 2008). As to drawing
presumptions from subjective norms, this should be done with precaution due to the low
internal consistency in this study. As to why this consistency is low, the respondents answer
normative influence very differently when it comes to family, friends and society. Many
respondents report a much greater normative influence towards sustainability when it comes
to society, but very low when it comes to family. Furthermore this report is reluctant to
present findings on this variable as conclusive due to low internal consistency and
insignificant correlational data. However a slightly lower normative influence towards
sustainability is reported in the clothing sector than the grocery sector.
5.1.3 Perceived behavioural control
Perceived behavioural control as a variable measures the sense of ease, means and ability to
execute the behaviour. In addition, the perceived behavioural control is the only factor that
can affect the behaviour directly, which is shown in the TPB model by Azjen (Appendix 2),
making its importance different from the other two variables affecting intention (Azjen,
1991). Respondents report a great difference in this variable between sectors 2.6 in clothing,
3,78 in groceries (Table 3). There is a moderately strong correlation to green marketing and
respondents report a much greater low availability of products in the clothing sector. Since a
low availability of products would result in difficulties in executing a behaviour towards
those products it could be considered likely that the two factors are intertwined. There is,
however, one important thing to take into consideration here. The survey only considers the
perception of ease and the perception of availability, not the actuality. Regardless it is the
28perception that is of importance and whether this perception can be influenced through green
marketing is a question of importance. The data in this survey suggests a moderately positive
correlation between green marketing and perceived behavioural control and therefore, by
extension, at least a possibility. Strengthening this argument is the findings that support the
suggestion that perceived availability, and perceived consumer effectiveness can be
successfully affected through communication and marketing efforts (Vermier & Verbeke,
2006).
5.1.4 Attitude, subjective norm and perceived behavioural control
As a general rule, the stronger the different variables attitude, subjective norm and perceived
behaviour control is, the more likely it is for a behaviour to happen (Azjen, 1991). However,
the relative importance of the variables might differ depending on situation, and therefore the
intention will be impacted differently (Azjen, 1991). This can be seen in the study where
perceived behaviour control seems to have a larger observed effect on the intention, than the
attitude and subjective norm.
5.2 Attitude-behaviour gap
Attitude or purchasing intentions does not always align with actual purchasing behaviour,
creating an attitude-behaviour gap (Park & Lin, 2020). This study also observes this
phenomenon. The majority of the respondents have a positive attitude toward sustainability
and green products. Many also claim that they have the intention of buying sustainable
products. However, that is not always the case.
When the respondents were asked to name the reasons for this attitude-behaviour gap, the
reasons differed depending on which sector the question referred to. When the question
referred to the grocery sector, the reason with most hit-rate by far was Price followed by Low
availability of products. The same question, but with regards to the clothing sector, had a
much higher hit rate on Low availability of products and was then followed by Price, which
still had a high reported frequency. This might connect to the level of perceived behavioural
control. Not having enough money or feeling that it is hard to find sustainable products due to
low availability are factors that can have an impact on the level of perceived behavioural
control. With perceived behavioural control being lower in the clothing sector, this could
29suggest a connection between the perceptive sense of ease and means to purchase sustainably
being low and a perception of low availability. Perhaps as more sustainable clothing products
enter the market, or the perception of availability is changed through green marketing efforts,
producers could be faced with the same pricing concerns as the grocery sector.
Further, the reason Distrust of sustainable products had similar hit rate regardless if the
question referred to the grocery or the clothing sector. Today there is a lot of information to
be found regarding sustainability, both in terms of what you can do as a consumer to be more
sustainable but also educating information regarding how companies or countries really act
behind their shield of sustainability labels. Greenwashing is a broad phenomenon afflicting
the world, and has also led to consumers being more informed about it - and therefore a
probable cause to why some of the respondents chose the alternative. With the increase of
greenwashing over the years (Dahl, 2010) it is only natural that individuals start asking
questions. This leads to consumer skepticism, where consumers feel distrust towards the
companies executing green marketing campaigns (Da Silva et. al., 2019). This study shows
that consumer skepticism is a fact, and that green marketing might not always affect the
consumer in a positive way.
Companies conducting green marketing campaigns all have a mutual goal; to affect the
consumer in order for him/her to purchase the product. In order to do so, they have to affect
as well as change consumer’s behaviours which will lead to a change in their consumer
decision-making - so called nudging (Thaler & Sunstein, 2008). Especially the grocery sector
has a high percentage of both individuals being reached by green marketing, as well as
affected by it. Individuals affected by green marketing might be a result of companies
nudging them towards a green purchase, making the individual feel good about themselves
since they are making the planet a favour by purchasing sustainably - while the companies
are successful with their green marketing. However, the nudging strategy might not always
work. Looking at the respondents who answered Distrust of sustainable products, nudging
can also be a strategy for greenwashing which has a negative effect on the consumer, since
they don’t trust the green products that are being advertised.
Not enough knowledge had more hit rates for the clothing sector compared to the grocery
sector. Just like with price and low availability of sustainable products this too might be
related to the level of perceived behavioural control. Sustainable food is something that has
30You can also read