Tulane universiTy 2014 Climate Action Plan
←
→
Page content transcription
If your browser does not render page correctly, please read the page content below

Tulane University
2014 Climate Action Plan

                Tulane University 2014 Climate Action Plan A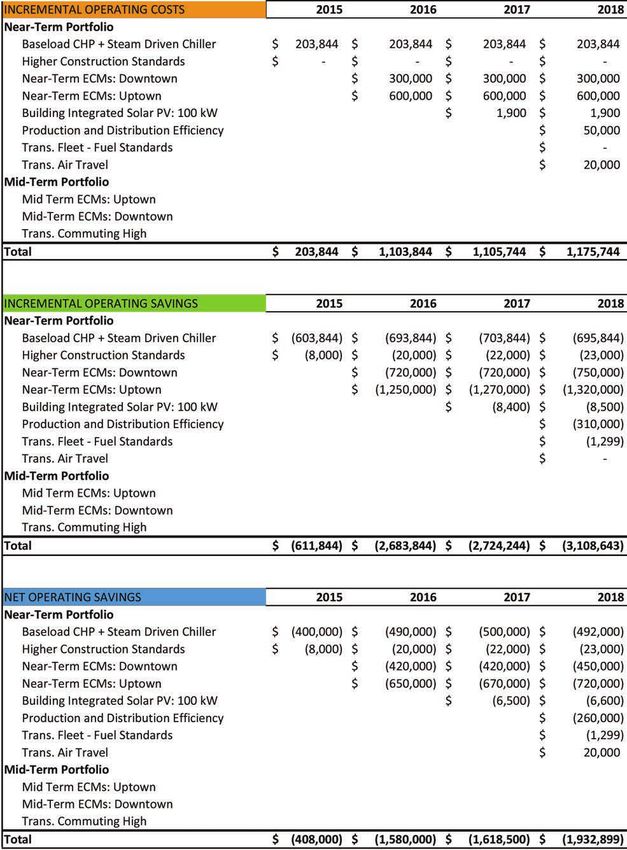
TABLE OF CONTENTS

I. Executive Summary                                                  1
II. The Plan’s Development                                            3
III. Tulane University’s Path to Climate Neutrality                  14
IV. The Climate Action Plan as a Living Document                     25

Appendices
A.   Schedule of Investments and GHG Reductions, 2015 through 2024   27
B.   Abatement Options Profiles                                      33
C.   Key Assumptions                                                 45
D.   Revolving Loan Fund                                             47
E.   Energy Conservation Measure Analysis                            50
F.   Implementing Recommended Energy Conservation Measures           54
G.   Steps for Implementing the Near-Term ECM Bundle                 56
H.   Terms and Acronyms                                              59
I.   Contributors                                                    61
J.   Tulane University Contact                                       63
I. Executive Summary
           The 2014 Tulane University Climate Action Plan is a guide for university investment and       reduction activity to 2050, offering a more comprehensive and detailed description of
           activity to reduce its greenhouse gas (GHG) emissions. Specific to the Uptown and             the necessary steps in this process, with specific focus on the Uptown and Downtown
           Downtown campuses, it describes a variety of investments to be undertaken addressing          Campuses. The plan describes the University decision to:
           carbon-improved energy supply and distribution systems, reduced building energy
           demand, focused university community engagement, and better employment of low-                •   improve energy technologies,
           carbon transportation options. It charts progress towards climate neutrality for the two      •   more aggressively manage building energy demand,
           campuses, to be realized in 2050.                                                             •   leverage student involvement in support of the plan,
                                                                                                         •   enhance energy efficiency in future buildings and major renovations, and
           This document is the product of extensive involvement by faculty, staff, and students.        •   manage transportation services to reduce associated carbon emissions.
           It stretches the collective knowledge of the practical to embrace the community’s
           ambitions to use less energy, use less GHG-intensive energy, and ensure that the              The 2014 Tulane University Climate Action Plan describes near-term, mid-term, and
           students’ social and academic experiences at Tulane University prepares each one to           long-term investment portfolios. Using 2007 as the base year for GHG emissions
           become an effective leader addressing climate change.
                                                                                                      Through this plan the University commits to an active and
           Tulane University’s commitment to reduce its greenhouse                                    long-lasting investment in improving the energy efficiency
           gas emissions is nearly a decade-long. In 2008, its then-                                  of its building stock
           emerging interest assumed greater significance when
           the University pledged to join the American College and
           University Presidents’ Climate Commitment (ACUPCC),                                           reduction, this plan describes University activity that will reduce its GHG emissions at
           a network that has grown to nearly 700 higher education                                       the Uptown and Downtown campuses by 15% in 2020, by 30% in 2025, and to climate
           institutions that have made a public commitment to                                            neutrality by 2050.
           reduce their institution’s GHG emissions in tandem with
           prioritizing support of research and education about                                          The near-term portfolio is powerful. It intends to capture immediately available and
           climate change. Soon after, the University announced                                          important efficiency gains in campus energy supply and distribution, advancing
           that it would immediately reduce its GHG emissions through purchasing energy efficient        building energy demand management, introducing renewable energy sources, and
           equipment, designing new buildings and major renovations to a minimum standard of             gaining efficiency within the campus fleet. It launches a new dimension of Tulane
           LEED Silver, encouraging use of public transportation and the University shuttle system,      University’s sustainability imprint, a Building and Energy Literacy Campaign. This
           and investing in energy conservation. In 2011, Tulane University authored “Tulane             campaign’s intention is to advance University research, teaching, and learning about
           Climate Action: A Roadmap to Reductions.”                                                     climate change, in part by creating a suite of activities that highlight the connection
                                                                                                         to sustainable campus living. This will help each member of the Tulane University
While climate change is a subject of research, learning and                                              community recognize their opportunity to reduce energy/GHG emissions in their capacity
                                                                                                         as individuals who manage, operate and occupy campus buildings. The campaign will
innovation across our academic disciplines, it should also                                               be long-lived, at least through the duration of this report’s study period. The near-term
inform how we build, operate and use our campus facilities.                                              portfolio is estimated to cost $21.9 million, reduce GHG emissions by 23,000 MTCO2e
Every member of our university community has role to play                                                per year, and yield an average annual savings of $2.6 million (2014 $).
in addressing the challenge of climate change.
                                                                                                         The mid-term portfolio perpetuates the strengths of its predecessor phase and
                                                                                                         introduces an ambitious strategy to encourage the University community to walk, bicycle
           The 2014 Tulane University Climate Action Plan builds upon the efforts of the draft           and take transit – low and no-carbon options. During this phase, in 2024, Tulane
           plan. Each of its assumptions, aspirations and strategies have been revisited and             University will rededicate its commitment to GHG emissions reduction through an
           many have proven still relevant, as described in this document. Employing much of the         update of its climate action plan. The mid-term portfolio is estimated to cost $5.5 million,
           same passion, vision, and direction, this plan extends the University’s GHG emissions         reduce GHG emissions by 2,800 MTCO2e per year, and will yield an average annual
                                                                                                         cost of $544,000 (2014 $).
1 Tulane University 2014 Climate Action Plan                                                                                                             Tulane University 2014 Climate Action Plan 2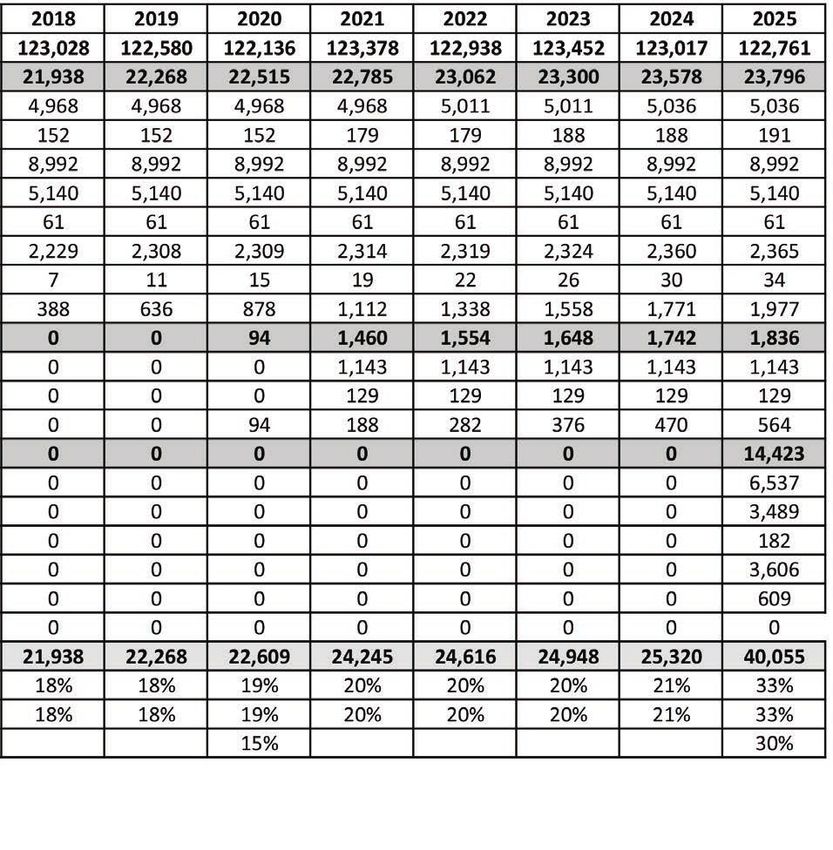
The plan accounts for GHG emissions for University owned-and-operated properties
           Projections for the long-term -- 2025 to 2050 – call for the University to invest in          located on the Uptown and Downtown Campuses. It addresses1 :
           low- and fossil fuel-free energy sources, in building energy demand management, in
           improved transportation, and in the Building and Energy Literacy Campaign. Less               •    Scope 1 GHG emissions – all direct emissions from sources that are owned and
           specificity is offered about investments for this phase because utility prices and options,        controlled by the University such as emissions from fossil fuels burned on site and
           technologies, and fuel source availability are expected to be markedly different within            from University vehicles (owned and leased),
           a decade. Revisiting and updating the 2014 Tulane University Climate Action Plan in           •    Scope 2 GHG emissions – indirect emissions that come from consumption of
           2024 will enhance the certainty about long-term investments described in this plan. The            purchased utilities such as electricity,
           long-term portfolio is estimated to cost $58.5 million, reduce GHG emissions by 12,500        •    A subset of Scope 3 GHG emissions – indirect emissions that come from
           MTCO2e per year, and yield an average annual savings of $435,000 (2014 $).                         transportation related activities in vehicles not owned or controlled by the University
                                                                                                              and electricity-related activities (such as transmission and distribution losses).
           Figure 1: Tulane University GHG Emissions Reduction Over Time
                                                                                                              This study excludes emissions otherwise defined as Scope 3, such as emissions
                                                                                                              associated with vendor supply chains, outsourced services for wastewater treatment
                                                                                                              and for waste disposal, and site remediation.

                                                                                                              Figure 2: Greenhouse Gas Scope Emissions Types2

                                                                                                         The goal of the plan is for the University to reach climate neutrality by 2050. This
                                                                                                         ambitious goal is justified for a number of reasons. The University, as signatory to the
           II. The Plan’s Development                                                                    ACUPCC, relies on the pledge’s 2009 guidance3 to signatories that they address climate

                                                                                                         1 The reader may notice that the University’s annually generated reports on University GHG emissions addresses a broader
           Tulane University’s two main campuses partnered in developing the 2014 Tulane                 geography. Employing the operational control approach, it reports on total emissions for Tulane University holdings in New Orleans,
           University Climate Action Plan. Faculty, staff and students identified and planned for        LA; Covington, LA; Belle Chasse, LA; Biloxi, MS; Madison, MS; and Houston, TX. It also expands Scope 3 emissions count to
                                                                                                         include waste disposal. To focus on the properties that generate the greatest GHG emissions, this CAP is specific to the Uptown
           means of institutionalizing the most effective strategies for reducing University GHG         and Downtown Campuses. It excludes waste management, which represent a small fraction of total GHG emissions, and other
                                                                                                         forms of Scope 3 emissions that are not relevant to University activities or are not measured by the University.
           emissions on their campuses. The ultimate presentation of information combines
           data from both campuses as is appropriate to the single ownership and organizational          2 The sources of a university’s GHG emissions are very similar to those of federal facilities, which are shown in this graphic. USEPA
                                                                                                         http://www.epa.gov/greeningepa/ghg/
           structure of the University.
                                                                                                         3 Implementation Guide: Information and Resources for Participating Institutions, Version 1.1, 2009

3 Tulane University 2014 Climate Action Plan                                                                                                                                  Tulane University 2014 Climate Action Plan 4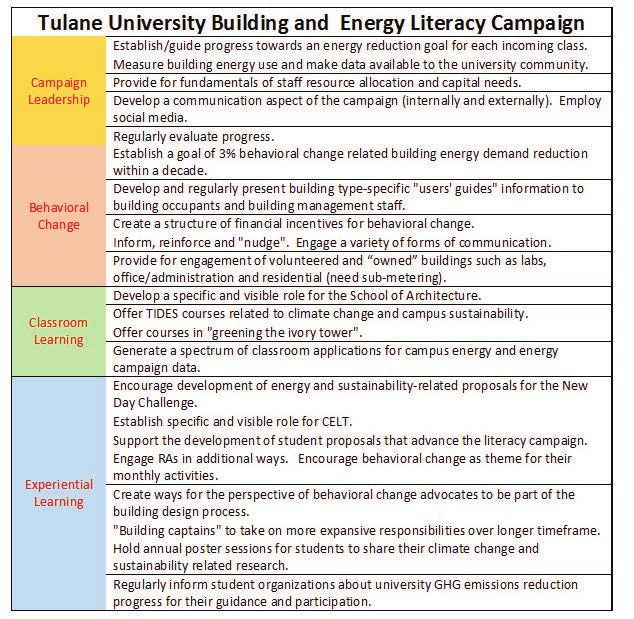
neutrality for their institutions. While the pledge itself is to “achieve climate neutrality
           as soon as possible”, the program’s guidance references the Intergovernmental Panel                Emissions Reduction Opportunity:
           on Climate Change (IPCC) work and its 2050 target to reduce global emissions by                    Idea Generation and Qualitative Screening
           50% to 85% below the 2000 level. Established in 1988, the IPCC uses both 2050 and
           2100 as benchmark years for describing the dimension of activity needed to reduce
                                                                                                              The plan was guided by a steering committee of University administrators and faculty
           greenhouse gas emissions and stabilize the climate system. Use of these years has
                                                                                                              and by four working groups constituted with faculty, staff, and students. At the start of
           become standard across the community of scholars involved in the study of climate
                                                                                                              the planning process, the steering committee established the University vision for the
           science and, specifically, 2050 is employed by entities, such as those in industry and
                                                                                                              plan.
           higher education, in planning their own mitigation activities. Including a goal of climate
           neutrality is an important reminder for the University community that addressing climate
           change will be an ongoing, long-term challenge.                                                 Vision for Path to Climate Neutrality
                                                                                                           Tulane University will make prudent investments to:
           A starting point for Tulane University in considering the goal of climate neutrality            • Reduce GHG emissions in the near, mid and long-term
           for 2050 is to understand the GHG emissions the University would generate if it
                                                                                                           • Apply the University mission of teaching, research and service
           maintained current utility infrastructure, building and fleet/transportation management
           and operations practices, and grows according to its established trajectory. Tulane
                                                                                                             to propel broad awareness of and involvement in University
           University is projecting a nearly even student population over the term of this study with        greenhouse gas emission reductions
           limited need for additional building square footage. University energy management               • Educate undergraduates to become leaders in addressing
           practices and utility costs were used to project a Business-as-Usual (BAU) profile for            climate change
           the University’s GHG emissions and energy management system cost over the course                • Enable continued student involvement in campus sustainability
           of the CAP term of study (to 2050). Referred to as the BAU scenario, this suggests that         • Design new buildings and renovations/restorations that
           Tulane University’s two main campuses will grow from just under 119,000 MTCO2e in                 ambitiously reduce building energy demand/GHG emissions
           2014 to approximately 125,000 MTCO2e in 2050. Potential cost and savings associated
                                                                                                           • Operate and maintain Tulane University campuses to reduce
           with emissions reduction ideas were evaluated relative to this BAU scenario.
                                                                                                             GHG emissions
                                         Projected GHG Emissions
                                                                                                           • Affirmatively purchase equipment and supplies that reduce
                                                                                                             energy use/GHG emissions

                                                                                                              The CAP planning process invited every form of GHG management option to be
                                                                                                              considered. Then, through a process of applying University-articulated criteria
                                                                                                              (both qualitative and quantitative) the most compelling options were more rigorously
                                                                                                              considered. Fundamental to this screening process was adoption of a hierarchy that
                                                                                                              has proven to be effective for others as they reduce their GHG emissions. That is:

                                                                                                              •    The most effective step is to avoid carbon-intensive activities
                                                                                                              •    The second is to reduce emissions through efficiency
                                                                                                              •    Third is to replace high-carbon energy sources with low carbon alternatives
         Figure 3: Tulane University Business-As-Usual Reference Case: Projected Emission (1,000 MTCO2e)
                                                                                                              •    Finally, offsets -- credits procured for GHG emissions reduction that are
                                                                                                                   accomplished by a third party -- are considered4.

                                                                                                              At Tulane University, as with many other higher education institutions, there is a
                                                                                                              specific interest that offsets be avoided or, if purchased, that they support GHG
                                                                                                              emissions reduction activity that benefits the New Orleans region. For example, there
                                                                                                               4 These are generally cost effective as a cost per ton of emissions avoided, but less appealing because they do not offer operational
                                                                                                              or facility enhancement value to the university.

5 Tulane University 2014 Climate Action Plan                                                                                                                                       Tulane University 2014 Climate Action Plan 6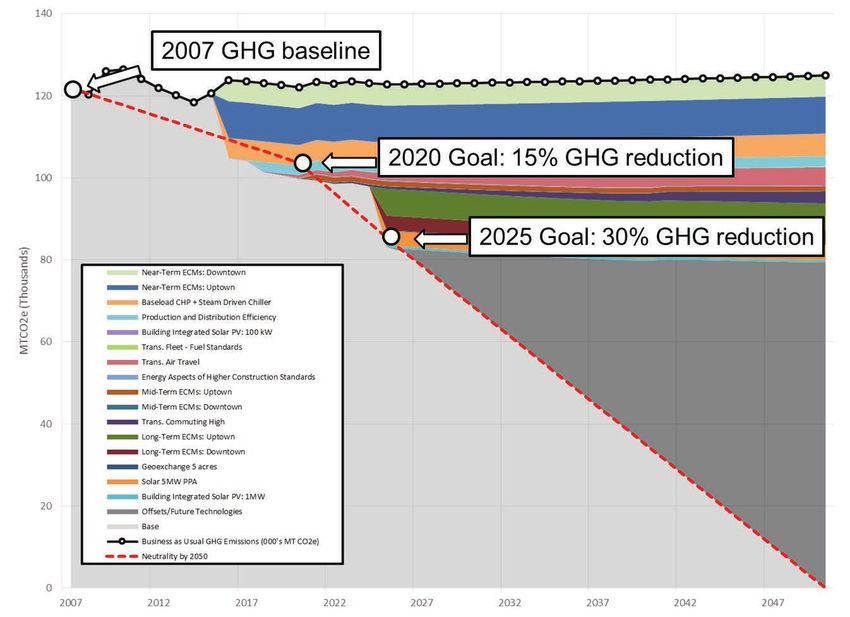
is opportunity to purchase carbon offsets related to wetlands restoration, a goal of                system, and improving thermal distribution.
           importance across the entire state coastline. These offsets promise the additional              •   Assess the GHG emissions reduction potential of air handling unit condensate water
           benefit of connection as Tulane University students, some acting through the School                 reuse and of implementing heat recovery within buildings as a GHG emissions
           of Science and Engineering, are directly involved in not just the study, but the field              reduction technique.
           experience of restoring Louisiana wetlands.
                                                                                                           Group objectives were framed by key assumptions:
           The Energy Demand Working Group was concerned with characteristics of the
           building stock, campus design standards, space use efficiency, energy conservation              •   The University design process will put greater emphasis and value on installation of
           measures, and operating standards and policies. The group’s articulation of its                     building-level low fossil fuel and fossil fuel-free energy systems.
           objectives and strategies for reducing GHG emissions was to:                                    •   The University development officers will integrate this plan’s recommendations as an
                                                                                                               objective for their efforts.
           •   Recommend energy conservation measures (ECMs) by building type and/or applied               •   The University will continue to engage the development community in pursuit of
               to standard building operating schedules                                                        partnerships for financing and operating campus energy systems.
           •   Recommend means of improving building temperature control to minimize the
               perception that buildings are being overcooled in summer                                    The Student Global Citizenship Working Group was concerned with research,
           •   Broaden use of ENERGY STAR® equipment                                                       curriculum, student-oriented initiatives, and creating an overall structure to develop the
           •   Address summer building use scheduling to reduce cooling and electricity use to             perspective and capabilities of Tulane University students to promote GHG emissions
               unused and occasionally used buildings                                                      reduction on campus, locally and globally. The core issue for this group was to offer
           •   Employ energy demand-limiting strategies in new construction and renovation                 an opinion as to whether Tulane University’s sustainability initiatives are sufficiently
               projects. Examples include using card controls in residence hall rooms that would           oriented to the issue of climate change and to advancing the goals of the Tulane
               control room temps and automatically shut off lights and certain electronic equipment       University 2014 Climate Action Plan. The group concluded that more was needed and
           •   Institute behavioral change programs                                                        that the most compelling student-related need or opportunity associated with this plan
           •   Elevate use of renewables as a priority by applying affirmative consideration of its        is to bring greater focus to climate change at the university, and to invest significant
               educational and research value to the campus                                                effort in motivating behavioral change, particularly as relates to building energy demand
                                                                                                           management.
           Group objectives were framed by key assumptions:

                                                                                                                                               Figure 4: Tulane University Vision for Student Engagement
           •   The University will consider both first and life-cycle cost in selecting ECMs                                                   in Climate Change
           •   The University will consider new means of financing ECMs, such as a revolving loan fund
                                                                                                                                               The Student Global Citizenship Working Group interpreted the
           •   The University will not charge administrative and academic units for their utility use                                          Tulane University’s Office of Sustainability directive to students on
                                                                                                                                               what they can do for the purposes of this emissions reduction plan.
                                                                                                                                               Green.Tulane.edu informs students what they can do: Learn more
           The Energy Supply Working Group was concerned with purchased and produced                                                           about climate change, Act to reduce GHG emission and Advance
           utilities, utility plant assets and distribution systems, commodity fuels, carbon pricing and                                       understanding of global warming.

           risk, and climate change adaptation measures. The group’s articulation of its objectives
           and strategies for reducing GHG emissions was to:

           •   As feasible, employ low fossil fuel use and fossil fuel-free energy supply approaches       The group’s articulation of its objectives and strategies for reducing GHG emissions was to:
               such as on-campus solar energy, thermal water storage, geothermal, thermal energy           • Establish a class GHG emissions reduction goal (challenge) for each entering class
               storage, and solar thermal reheat.                                                             and use this as a means of organizing a number of student-engaged strategies.
           •   Assess the viability of approaches that are more energy efficient: combined heat            • Develop campus residential life as an experience that advances University GHG
               and power for the Uptown Campus, using the Uptown campus absorption chiller,                   emissions reductions.
               installing heat recovery chillers, installing plate and frame heat exchangers, installing   • Establish a database of opportunities and guide students towards campus
               a steam turbine generator, employing variable flow systems in the plant and                    involvement —through the Center for Public Service, New Day Challenge, Tulane
               buildings, updating the current steam system or replacing it with a hot water system,          Interdisciplinary Experience Seminar (TIDES), Center for Engaged Learning and
               upgrading building level chillers, improving insulation of the central chilled water           Teaching (CELT), learning grants, student organizations etc. -- which more obviously

7 Tulane University 2014 Climate Action Plan                                                                                                                   Tulane University 2014 Climate Action Plan 8
relates to understanding and reducing campus GHG emissions reduction.                                                              The Transportation/Planning Working Group’s objective was to propose
           •   Feature study of climate change and means of reducing GHG emissions in the                                                         means of reducing University GHG emissions associated with commuting patterns,
               classroom, including offering a student course in “Greening the Ivory Tower” with a                                                campus growth plans and coordination of campus growth plans with municipal and
               focus on the potential represented by building design and use.                                                                     regional plans. It also included reduction associated with air travel and University fleet
           •   Develop leadership and activity through a building-specific program for GHG                                                        operations.
               emissions reduction.
           •   Regularly host events that feature green initiatives accomplishments and campus                                                    The group’s articulation of its objectives and strategies for reducing GHG emission was to:
               research relating to GHG emissions reduction.
           •   Leverage others to lead through example – address campus deferred maintenance,                                                     •   Reduce single occupancy vehicle use for students and employees.
               ensure that building design guidelines are consistent with CAP goals and strategies,                                               •   Coordinate with the New Orleans Regional Transit Authority in pursuit of services
               and improve campus waste and recycling systems.                                                                                        that are more appealing to the Tulane University community.
                                                                                                                                                  •   Focus on developing opportunity for vanpools, shuttles and/or rideshare
                                                                                                                                                      opportunities, particularly for longer distances areas such as Northshore/Covington
                                                                                                                                                      and New Orleans East.
                                                                                                                                                  •   Create fleet equipment purchase and use policies to rationalize use, improve
                                                                                                                                                      maintenance, and phase out inefficient equipment.
                                                                                                                                                  •   Increase the fuel efficiency of the University fleet, including the shuttle system and
                                                                                                                                                      Tulane University Police Department vehicles.
                                                                                                                                                  •   Develop a no-idling policy.
                                                                                                                                                  •   Continually refine the shuttle system routes to reduce fuel use without substantially
                                                                                                                                                      affecting service.
                                                                                                                                                  •   Identify policies and supporting programs to limit or reduce travel, in particular air
                                                                                                                                                      travel, without negatively impacting the research and education missions of the
                                                                                                                                                      University.
                                                                                                                                                  •   The University plans to expand its on-campus housing for the Uptown Campus. In
                                                                                                                                                      so doing, the University will work to limit associated increases in student vehicles
                                                                                                                                                      and promote the use of walking and biking for those living off-campus.
                                                                                                                                                  •   The University is planning to develop satellite facilities in the greater New Orleans
                                                                                                                                                      area. As this occurs, the University will create opportunities and incentives for non-
                                                                                                                                                      single occupant vehicle transportation between campuses and satellite facilities.

                                                                                                                                                  In developing the 2014 Tulane University Climate Action Plan, Tulane University
                                                                                                                                                  surveyed its faculty, staff, and students to identify their current travel patterns and their
                                                                                                                                                  attitudes towards changing these. This process revealed:

                                                                                                                                                  •   While auto use has seen some decline over the past eight years, the car remains
                                                                                                                                                      dominant as mode for commuting, particularly for employees.
                                                                                                                                                  •   Many survey respondents are interested in alternative (non-auto) modes, but feel
                                                                                                                                                      that the options don’t meet their needs. Over a third of the respondents indicated
               Figure 5: Elements of Tulane University’s planned Building and Energy Literacy Campaign. This initiative should be launched with       they would increase their bus usage if service frequency, coverage and/or reliability
               release of the 2014 Tulane University Climate Action Plan.
               Studies consistently show that campaigns like this one thrive when university leadership’s involvement is viable.                      were improved. Only one fifth indicated that they would not use the bus in any

9 Tulane University 2014 Climate Action Plan                                                                                                                                                       Tulane University 2014 Climate Action Plan 10
circumstances.                                                                         responses, residence patterns, and historical efficacy of similar potential programs at
           •    Employees, and particularly students, live close to campus. Over half of employees     other institutions. The analysis incorporates local and national electricity grid and fleet
                and 85 percent of students live within four miles of campus. These individuals are     efficiencies to predict emissions improvement that will occur beyond university systems
                well within what could be provided by transit and in many cases bikeable distance.     and their implications for University mode shift. Those that offer the greatest reductions
           •    Many use the Tulane Shuttle to commute to campus, particularly Downtown                include policies and programs to affect residential location choice, bringing a greater
                students. There is potential to use this to complement or supplement local bus         proportion of students and employees within walking and bicycling distance of campus.
                service with careful review of current residence locations.

                                                                                                       Strategy Evaluation
                                                                                                       Each of the plan’s working groups proposed and vetted strategies for GHG emissions
                                                                                                       reduction that best fit its group’s perspective. The groups screened their ideas, applying
                                                                                                       considerations such as:
                                                                                                       • readiness of the resource/measure for implementation
                                                                                                       • relevance to Tulane University’s mission and dedication to effective student
                                                                                                          engagement
                                                                                                       • fit to the University utility context
                                                                                                       • effectiveness of GHG emissions reduction, first and operating costs, and
                                                                                                       • ease of operations and of implementation

               Figure 6: Tulane University Commuting Patterns

           The group’s recommendations can be characterized as providing University driven
           incentives and disincentives that, with regulatory changes and market-based incentives,
           will work to transition the University commuting patterns to be less carbon-intensive.
           Ultimately, the University-driven elements rest on motivating behavioral change.
           Recognizing the uncertainty of what will work and to what extent, the Transportation/
           Planning Working Group identified a broad range of investments to evaluate and
           recommend. This ensures a robust understanding of the potential benefits of greater
           reductions coupled with associated costs and other tradeoffs.

           The plan recognizes limitations to University programs and policies to affect commuter
           behavior change. For example, Tulane has achieved a lot of success in promoting
           bicycles and faces a short-term challenge of simply offering enough bicycle parking. On
           the other hand, while there is strong interest in enhanced bus service, such changes will
           require a continued and sustained long-term effort by the University to coordinate with
                                                                                                       Figure 7: GHG Management Options
           the New Orleans Regional Transit Authority.                                                 This planning process invited every form of GHG management option for initial consideration. Through the efforts of the working
                                                                                                       groups and steering committee, options were tested qualitatively and quantitatively until refined to those that constitute the portfolio
                                                                                                       proposed in this report.
           Each option considered was evaluated based on the existing mode split, survey

11 Tulane University 2014 Climate Action Plan                                                                                                                                 Tulane University 2014 Climate Action Plan 12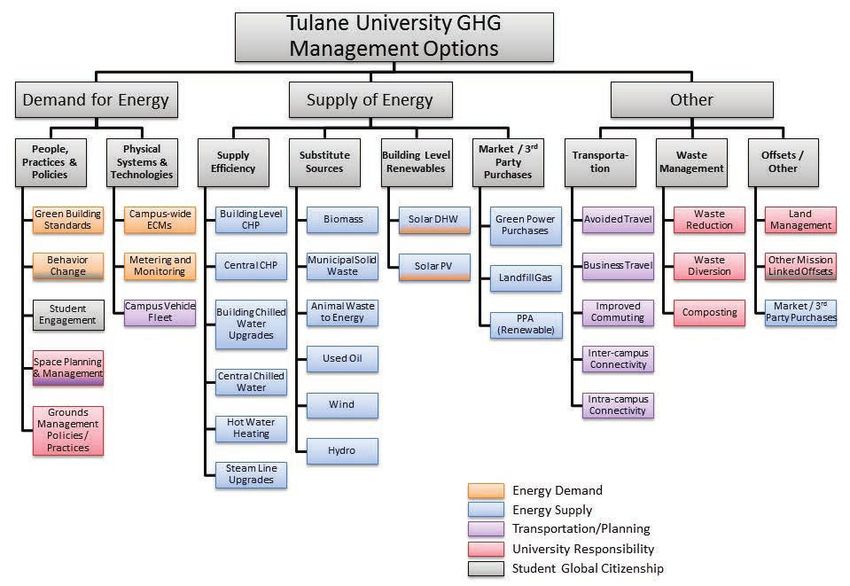
The ideas that best addressed the working groups’ objectives for this study were
                   analyzed for their potential effectiveness as GHG emissions reduction steps. As
                                                                                                                                                                           III. Tulane University’s Path to Climate
                   illustrated in Figure 85, each opportunity proposed for consideration is expressed in the                                                               Neutrality
                   essential metrics of average annual financial impact (cost or savings) per metric ton
                   of carbon emissions avoided and GHG emissions reduction impact (average annual
                                                                                                                                                                           The process of creating this plan was rich in enthusiasm and ideas. The plan’s
                   reduction of metric tons of carbon emissions).
                                                                                                                                                                           investment profile is generally guided by concern for financial return on investment.
                                                                                                                                                                           Exceptions to this have been made in recognition of technologies that are of critical
                                                                                                                                                                           value because of their visibility and/or the learning opportunity that they offer to the
                                                                                                                                                                           University community. In general, these technologies tend to be less appealing
                                                                                                                                                                           financially in the near term. Thus, the plan has emphasized their use in the long-term
                                                                                                                                                                           when it is expected that they will be better established in terms of reliability, more
                                                                                                                                                                           affordable, and more cost effective.

Figure 8: Tulane University Abatement Potential
The width of the bars in Figure 8 indicate monetary savings (blue) or cost (red) per metric ton of potential GHG emissions avoided. The height of each
bar indicates the average annual GHG emission reductions over the life of the project. The chart provides for easy comparison across GHG emission
reduction activities. For example, a program to install 5 acres of geoexchange is estimated to cost $8 per ton of GHG reduction and could potentially
reduce the GHG emissions by approximately 172 metric tons per year on average. This would compare to base loading the combined heat and power
(CHP) system with a waste heat steam driven chiller, which could both save money and reduce GHG emissions (by an average of more than 5,000
metric tons per year). For a more detailed description of these opportunities, see Appendix B.

                   Each working group’s recommendations were then compared to each other to measure
                   their respective GHG emissions reduction impact as absolute and cost-per-ton of
                   emissions reduced. Wedge diagrams6 were created to represent proposed investments.
                   At this point in the process, forums were held to provide for community-wide input. The
                   response to the working groups’ efforts and new ideas elicited in these sessions were
                   then incorporated to make a final set of recommendations for a near (2015 through
                   20197), mid (2020 through 2024) and long-term (2025 to 2050) profile of investments in
                   GHG emissions abatement at Tulane University. The project’s steering group reviewed
                   and advanced these strategies, preparing them as recommendations to President Fitts
                                                                                                                                                                 Figure 9: Tulane University Historic and Projected GHG Emissions8.
                   and the Board of Tulane.
                   5 Note that Figure 8 presents the best of the University’s options and this does not equate to a portfolio as some options are
                   exclusive of each other.
                                                                                                                                                                            8 This graphic adjusts the historic emissions from 2007 to 2013 from those published values in the draft CAP to adjust for changed study
                   6 Climate carbon wedges are a graphical representation used to show the carbon impact over time of a certain activity or set of activities.              of campus properties and emission sources. The scaling was done by comparing gross square feet from the University’s 2007 ACUPCC
                                                                                                                                                                            submission. The adjusted GSF from the 2014 Tulane University Climate Action Plan was 7% lower than then the reported 2007 ACUPCC gsf
                   7 Portfolio dates in this report reference fiscal years.                                                                                                 values.

13 Tulane University 2014 Climate Action Plan                                                                                                                                                                                                Tulane University 2014 Climate Action Plan 14
Key Investments                                                                                     and solar photovoltaic panels on campus buildings. While the University has examined
                                                                                                               the potential of using these technologies, both through direct funding and through
                                                                                                               partnership with third parties, the potential projects’ financial return-on-investment
           First, the single individual investment with the largest potential impact on campus GHG
                                                                                                               have not warranted their development in either new construction or existing buildings.
           emissions (Uptown Campus) is use of a combined heat and power system (also referred
                                                                                                               With creation of this plan, the University has revisited this dilemma and arrived at
           to as co-generation or cogen) in the main utility plant of the Uptown Campus. Figure 10
                                                                                                               additional strategies that should change the fate of building integrated renewable energy
           diagrams conceptually the efficiency of a combined heat and power system compared
                                                                                                               technologies on both campuses.
           to traditional grid sources of electricity. At Tulane, the plan is to re-employ the campus’
           existing combined heat and power plant which has been operated only a few hundred
                                                                                                               •   In revisiting campus design standards the University will include description of low/
           hours a year because of a period of time when the historic rates of electricity and gas
                                                                                                                   non fossil fuel investments in ways such that they are more likely to be proposed and
           rendered it cost prohibitive to operate as a base load resource. Through the CAP
                                                                                                                   less likely to be subject to budget cutting during the design process.
           planning process use of this technology was revisited, initially based only on the fact that
                                                                                                               •   The University will pursue opportunities to secure external gifts specific to this project
           it is generally a very effective means of reducing GHG emissions. The result suggests
                                                                                                                   type.
           that investment in base load use of the combined heat and power system, coupled
                                                                                                               •   The University will develop a mechanism to isolate avoided energy costs realized
           with a steam driven chiller to utilize waste heat, is likely the optimal way to maximize
                                                                                                                   through other CAP investments and hold those to specifically reinvest in low/no
           savings per metric ton of carbon emissions avoided, maximize average annual reduction
                                                                                                                   carbon technologies.
           potential (expressed in metric tons of carbon emissions) and provide cost savings
           compared to the BAU scenario.
                                                                                                            Over the last decade there has been continued interest in
                                                                                                            bringing solar hot water and solar photovoltaic systems to
                                                                                                            campus buildings

                                                                                                               Third, through this plan the University commits to an active and long-lasting investment
                                                                                                               in improving the energy efficiency of its building stock. While the energy
                                                                                                               conservation measure (ECM) investment strategy is comprehensive in addressing
                                                                                                               both technology and building management/operations, a few elements of it deserve
                                                                                                               highlighting:

                                                                              Figure 10:                       •   Through the Building and Energy Literacy Campaign (described below), the entire
                                                                              Efficiency of Combined Heat
                                                                              and Power vs. Purchased
                                                                                                                   campus community will be educated about individuals’ ability to reduce energy use
                                                                              Electricity                          in buildings. This will be enhanced through a series of programs and projects to
                                                                              Combined heat and power (or          motivate change and measure its impact.
                                                                              cogeneration) captures and       •   The New Orleans climate represents challenges to achieving thermal comfort in
                                                                              employs the waste heat that
                                                                              is expelled from most power          buildings and can result in inefficient energy use through dehumidification and
                                                                              plants.
                                                                                                                   reheat. A need to improve thermal comfort and to address the perception on campus
                                                                                                                   that energy is being wasted due to overcooling buildings during hot, humid conditions
                                                                                                                   were discussed as objectives for this plan. The climate in New Orleans requires
                                                                                                                   dehumidification of the ventilation air in order to maintain indoor comfort conditions.
                                                                                                                   Figure 11 illustrates the number of hours during typical office building occupancy (7
                                                                                                                   a.m. to 7 p.m.) when the outdoor temperature conditions require dehumidification.
           Second, the move to combined heat and power is coupled with an equally significant
           type of energy investment: use of low/no fossil fuel-based technologies. In the
           last decade, there has been continued interest in and advocacy on the part of Tulane
           University students and faculty for these technologies, specifically for solar hot water

15 Tulane University 2014 Climate Action Plan                                                                                                                   Tulane University 2014 Climate Action Plan 16
Achieving Thermal Comfort
This plan examined measures to minimize energy use while
improving comfort in University buildings. Minimizing the
amount of ventilation air to that required for indoor air quality is
the first step to avoiding energy use associated with outdoor air
conditioning. Regular retro-commissioning efforts should include
aligning ventilation air setpoints and controls to those required by
code and demand control ventilation, which adjusts to changes in
building occupancy over the course of a day.
Once ventilation air is minimized, alternative methods of
Figure 11: Outdoor air humidity vs Dry-bulb temperature comparison conditioning the air can be used to reduce energy use. Exhaust
air heat recovery systems use the cool dry air being exhausted
Dehumidification is typically achieved by cooling the air and condensing moisture out. from buildings to precondition the ventilation air and reduces
To avoid overcooling the indoor spaces, the air must then be reheated if the load in the the amount of chilled water and steam necessary to complete
space does not call for full cooling. Both of these processes require significant energy
the process. Dedicated outside air systems with desiccant
input and based on the campus energy profile, significant hours of simultaneous heating
and cooling/dehumidification are likely occurring. Figure 12 shows the Uptown campus
dehumidification isolate the interior space loads from the
energy use profile with chilled water use increasing significantly during the warmer ventilation loads and optimize the impact of exhaust air energy
months while steam use only decreases approximately 30%. This points to the need for recovery.
reheat energy.
Temperature setbacks and HVAC equipment scheduling also
reduce energy use, but must be balanced with the need to control
moisture within buildings and avoid additional reheat. When
systems are scheduled off at night, ventilation and exhaust
systems must be included in the operational protocols to avoid
moisture migration and long startup periods. Seasonal setbacks
can be used during warmer conditions as thermal comfort is a
function of outdoor conditions. When occupants enter buildings
from hot, humid outdoor conditions, they are more willing to accept
warmer conditions inside as comfortable. For this to be effective,
cooling at the primary system level has to be adjusted along with
thermostat deadbands in order to prevent excessive reheat energy
requirements described above. Employing these system and
controls strategies will help improve comfort and reduce energy
use and should be considered in the development of more specific
construction standards
Figure 12: Uptown campus energy use profile
17 Tulane University 2014 Climate Action Plan Tulane University 2014 Climate Action Plan 18At this writing, the Uptown Campus buildings have electric meters and the Downtown better than an established guide (LEED) or standard (ASHRAE 90.1). The challenge
buildings are largely independently metered for electricity and natural gas use. Building with this approach is twofold. First, the baseline is constantly changing with each update
level chilled water or steam use is not metered on all Uptown Campus buildings and of the guides and standards which will require the University to adjust the percent
no submetering (i.e. lights, fans, plug load, etc.) is installed at either campus. A pilot savings accordingly. Second, the guide and development timeline is not necessarily in
energy dashboard project is being pursued on four buildings, but otherwise, active line with Tulane’s GHG emissions reduction schedule. For instance, LEED was last
energy management through the use of building level and submetered energy end use updated in 2009 and recent updates have been delayed. The University will likely have
has not been employed. The University’s efforts to reduce energy use have primarily better outcomes if it additionally expresses performance standards in terms of its GHG
been achieved through employing campus energy standards and performance contracts emissions reduction targets and schedule. An example would be using metrics such
with Johnson Controls, Inc. on both the Uptown and Downtown campuses. The campus as energy use intensity (kBtu/square foot/year) and performance requirements specific
energy standards have resulted in several LEED certified buildings and the performance to certain systems (such as ventilation control, setbacks and shutdowns). As building
contracts have replaced outdated primary cooling and heating systems downtown metering is extended to all of University buildings and for each utility, the University will
along with multiple building level upgrades such as variable speed pumping and lighting generate data that will be invaluable to subsequent revisiting of campus standards for
retrofits, but actual measured energy reduction has been limited to comparing overall the purpose of improving building energy performance.
campus energy use data, which has been inconclusive at this point.
Finally, the University is committed to helping students and employees travel with a low
For the University to achieve its ambitious greenhouse gas emissions reduction goals, carbon impact. As travel is often tied to residence and reflects the regional transportation
the University needs to implement building level metering for all utilities (electricity, network, the 2014 Tulane University Climate Action Plan recognizes that such change
steam, chilled water, natural gas, and water) and submetering for end use data (lights, will require a sustained, long-term effort. The approach it adopts is multi-faceted and is
plug load, fans, pumps, heating and cooling). With this data, the University’s facility intended to grow over time as successful programs are reinforced and efforts respond to
management staff can actively manage energy use through the following methods: external changes. Key elements include:
• Benchmark and monitor energy use to establish a known starting point from which • Education, awareness, and travel support – these programs would raise awareness
to measure future use and diagnosis problems such as equipment failures and of travel options and provide individualized support and information to help
overrides so quick corrective action may be taken. These data serve as a foundation employees and students shift to lower carbon intensity modes.
for ongoing building commissioning, minimizing the need for future, more extensive • Incentives – as changing travel choice may represent some level of inconvenience,
commissioning efforts and improving the efficiency of the retro commissioning efforts incentives aim to reward participation and lessen the burden. They can range from
when they are required. rewards to local restaurants and sporting goods stores for not driving to actual cash
• Measure impact and success of system upgrades and operational changes rebates for a lower-intensity mode.
associated with energy conservation measures. When building upgrades are • Transit subsidies – work with RTA and students and employees to develop a program
implemented, it is important to understand how the changes actually impacted to promote usage of the regional transit system by the university community. This
energy use so future efforts can more appropriately target past successes and might be in the form of a U-Pass program or reduced-price (up to complete subsidy)
continuously improve performance. transit passes for those primarily using transit.
• Inform future campus construction standards. As building energy use data become • Bicycle infrastructure improvements – expand bicycle parking in the short term. Over
richer, it can be used to update campus design and construction standards that lead time, spending would increase to cover additional bicycle-related improvements such
to the desired greenhouse gas reduction levels. as bicycle locker rooms.
• Educate building occupants and students on building energy use and encourage • Shuttle fuel efficiency enhancements – the university would work to enhance the fuel
behavioral change by supplying data to building dashboard visualization platforms. efficiency of its shuttle fleet to lessen the impacts of those commuting to campus via
university shuttle.
Tulane University’s commitment to extended use of its existing building stock is • Housing incentives program – a comprehensive set of incentives to encourage
exemplified in the fact that the Uptown Campus was listed on the National Register employees and students to live close enough to campus to walk or bike, primarily.
of Historic Places in 1978. This provides compelling reason to revisit existing design This could be in the form of housing subsidies, loan guarantees/discounts, or
standards to ensure that renovations include improvements that reduce building energy assistance with closing costs. It may also be possible to work more broadly to partner
use as necessary to support the University’s greenhouse gas emission reduction goals. with private developers and/or local government to redevelop parcels close to Tulane
Currently, the Tulane University standards (Green Building Design and Construction campuses to provide additional capacity and/or enhanced quality.
Standards & Guidelines, 2011) require performance that is measured as a percent
19 Tulane University 2014 Climate Action Plan Tulane University 2014 Climate Action Plan 20This plan endorses the actions aimed at achieving roughly a fifty percent reduction in
commuting-related GHG emissions, relative to the BAU. This represents a substantial
commitment to enhancing travel options and supporting commuters in their ability to
reduce their commuting footprint. The programs above outline the broad strokes of
the plan, but its ultimate success will require commitment from Tulane University to
raise awareness of travel options and ensure that they respond to commuters’ needs.
Table 1: Impact of Near-Term Portfolio
Achieving such a noticeable reduction in commuting-related GHG emissions will rest on
the number of individuals whose commute has no carbon impact: those who walk and
bike to campus. A balance of incentive and disincentives will be necessary, as incentive-
based programs are almost never as effective as those which are accompanied by some
level of disincentive such as increasing parking prices or reducing the number of spaces
provided.
Providing university-driven incentives and disincentives will
transition commuting patterns to be less carbon-intensive
The plan recognizes that because travel patterns are tied to behavior and long-term
patterns, including housing choice, it must reflect Tulane’s values and priorities to
succeed. The university should expect that its commuting program costs will vary
as participation grows and as participation rates reach trigger points where it will be
necessary to recalibrate programs to perpetuate reduced single occupant vehicles
(SOV) use. Establishing a dedicated revenue stream at the start of the plan’s
implementation term will provide campus transportation planners with finances to
support their desired agility to evolve these programs.
Investment Portfolios
Figure 13: Near-Term Portfolio (2015 to 2019)
Near-term investments are those for which Tulane University identifies compelling
reason for immediate implementation (occurring 2015 through 2019). These measures
Mid-term investments are, as a category, financially less compelling than that of the
are estimated to achieve a 15% reduction from the University’s base year GHG
near-term phase. Once developed, these measures will expand on the impact of near-
emissions (2007). These investments use existing equipment, are in harmony with other
term investments to yield a 21% reduction from the University’s 2007 GHG emissions
campus investments, offer synergistic opportunities within the category of near-term
level. They are synergistic within the category of mid-term investments, build well off
investments, and represent the greatest return on investment (savings per metric ton of
the impact of the immediate investments, include technologies that are projected to gain
carbon emissions avoided). Tulane University’s near-term portfolio features investments
cost effectiveness, and/or are assigned to this timeframe to allow for the preparation
in energy conservation, employing the University’s underused cogeneration assets, and
time needed to implement the measures and sequence with other investments. Tulane
investing in steam production and distribution efficiency.
University’s mid-term portfolio is to occur 2020 through 2024 and it features investments
in energy conservation and transportation programs. It is also planned that the
University will revisit its climate action plan during this term, ten years after development
of this document.
21 Tulane University 2014 Climate Action Plan Tulane University 2014 Climate Action Plan 22Table 3: Impact of Long-Term Portfolio
Table 2: Impact of Mid-Term Portfolio
Figure 15: Long-Term Portfolio (2025 to 2050)
Figure 14: Mid-Term Portfolio (2020 to 2024)
Each portfolio should be considered to extend from its respective start date to 2050.
Long-term investments are scheduled for 2025 to 2050 and are intended to take
The total capital and total operating & maintenance costs for each portfolio include the
the University to climate neutrality. This is a period of less certainty, so more of the
costs from start date to 2050. For example, while the Near-Term Portfolio includes $6M
investment opportunities aren’t specific. The expectation is that technologies will
for higher energy efficiency standards for new construction, that total includes costs for
develop and costs will change. For example, the cost of solar installations might
new construction built beyond the near term. For a more detailed presentation of this
justify an expanded scale of installations, third party arrangements to purchase
information, see Appendix A: Schedule of Investments.
renewable energy-sourced electricity might become more available and affordable,
and partner arrangements for on-campus energy investments may become more
attractive. Changes like these in the next decade will position Tulane University to bring
considerably greater certainty to this document’s long-term investment portfolio when
the University next updates the CAP, expected to be drafted within a decade of this
report. In the interim, this report recommends that long-term investments include energy
conservation, renewable energy (1 MW PV, solar thermal) technologies, and offsets and/
or future technologies.
23 Tulane University 2014 Climate Action Plan Tulane University 2014 Climate Action Plan 24IV. Climate Action Plan as a Living
Document Staff Resources for the Tulane University Office of
Sustainablity
Tulane University’s Office of Sustainability is responsible for guiding and coordinating
implementation of this plan. Organizationally assigned to the University Planning Office, Ensuring that the 2014 Tulane University Climate Action Plan
the Office of Sustainability is the University’s reference source, coordinator, student is successful will require increased staff resources within the
guide, and planner of University GHG emissions reduction activities. It authors the
Office of Sustainability to engage the university community
University’s reports on campus sustainability and GHG emissions9. It also leads the
coordination of development of information about sustainability and its dissemination and guide resources for implementation. In this plan, cost
and consideration within the University community. estimates for the Near-Term Energy Conservation Measures
include an annual budget of $270,000 for a Building and Energy
Tulane University plans to finance its greenhouse gas emissions reduction activities Literacy Campaign, which includes increased staffing. To start
through a combination of bonding for capital expenses, operating budget, a revolving
exploration of this issue, the report looked to the staff size and
loan fund, alumni support, and student investment. Of emerging interest is a Tulane
University revolving loan fund to invest in energy conservation, energy efficiency and
profile of climate action plan-implementing offices at other,
other GHG emissions reduction measures. At least fifty colleges and universities comparable institutions. These institutions are like Tulane in that
have such funds. According to Greening the Bottom Line, a study published by the they are privately owned, made an early (2008) commitment to
Sustainable Endowments Institute (2011), revolving funds that allocate funds in a “self- the ACUPCC, have a completed climate action plan and robust
directed” manner are gaining popularity at colleges and universities throughout the U.S. sustainability profile, and are of comparable size. The research
These funds are focused on investing in energy conservation and efficiency as well as
other aspects of sustainable operations. For a detailed exploration of revolving loan
on staffing revealed that:
funds for energy conservation and energy efficiency, see Appendix D.
• each has an office director (Director of Sustainability)
The University’s mission is to “create, communicate and conserve knowledge in order to • each has between 2 and 4 program-specific professional staff
enrich the capacity of individuals, organizations and communities to think, to learn and (titles are Sustainability Manager Sustainability Coordinator,
to act and lead with integrity and wisdom”. In the context of this plan, the university’s
Sustainability Project Coordinator, Stakeholder Engagement
mission has been interpreted to bring emphasis to the role of organizations and
communities. Thus, an essential aspect of making this a living document is ensuring Coordinator, and Recycling/Zero Waste Manager)
that its interpretation is carried forward through campus organizations, both existing and • half of them have an administrative staff person and
yet to be born, and that the plan impacts not just the college community, but that of the • they have as many as 24 student interns
city and the region. The plan conceives of Tulane University students acting with the
University’s imprimatur to reduce greenhouse gas emissions through their individual
and collective actions – in study, research, community service and engagement, as
contributors to campus investment decisions and as building occupants.
9 This reporting is outside of any permit-related reporting undertaken by University Environmental Health and Safety staff.
25 Tulane University 2014 Climate Action Plan Tulane University 2014 Climate Action Plan 26Appendix A: Schedule of Investments &
GHG Reductions, 2015 through 2024
Capital expenditures
27 Tulane University 2014 Climate Action Plan Tulane University 2014 Climate Action Plan 28operational expenditures
Note: Savings are shown as if measures are implimented in isolation. Implemented together, the improved efficiency of one mea-
sure may reduce the savings of another.
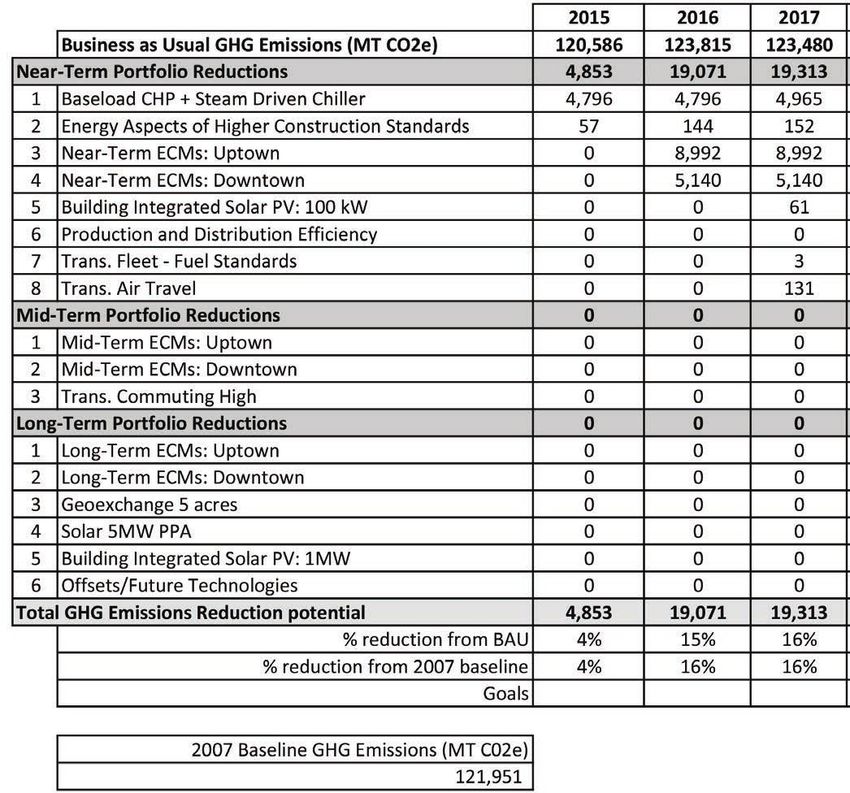
29 Tulane University 2014 Climate Action Plan Tulane University 2014 Climate Action Plan 30GHG Emissions 31 Tulane University 2014 Climate Action Plan Tulane University 2014 Climate Action Plan 32
Appendix B: Abatement Options Profiles
Capital (2014 $)
The following opportunities are represented in this document’s abatement profile and in Building and Energy • None
the plan’s model (recommended investments). Literacy Campaign Annual O&M (2014 $)
• $270,000
Near-Term Portfolio Integrated activities that bring
Change in Demand
greater University focus to
• Reduce purchased fuels
Capital (2014 $) climate change. This is intended
• Reduce purchased electricity
Air Travel • $40,000/yr in 2015 (throughout project life with to stimulate behavioral change
Change in Supply
decrease to $25,000/y in 2024 to reduce University GHG
• None
Promote more efficient air travel O&M (2014$) emissions in part by linking the
Impact on GHG Emissions
by prioritizing air carriers with • Approximately ¼ FTE to support programs issue between classroom and
• Net reduction in scope 1 & 2
lower emissions per passenger- • Savings from avoided travel grows to $450,000/ other aspects of the university
Start Date
mile. This could result in an yr by 2036 (5% of total travel expenditure) experience.
• 2015
agreement of a preferred airline, Change in Demand Phase 1 – Integrate building energy Useful Life
for example. Develop programs • Additional ½% reduction in air travel emissions information into student and staff • 40 years
to support increased electronic from improved carrier efficiency community through social media,
Average Annual Savings (2014 $)
communication including • ½% reduction in travel for 20 years (2017-2036)
curricula, incentive programs and
educational guides • $335k
distribution of webcams, etc. Change in Supply Phase 2 – Set targets for each class Simple Payback
• None and hold contests
Phase 3 – Tulane to establish itself as
• < 1 year
Impact on GHG Emissions national expert
• Decrease in Scope 3 (Note: O&M charge appears as part of
Start Date ECMs)
• 2015
Useful Life
• Indefinite Capital (2014 $)
Average Annual Savings (2014 $) Building Integrated PV • $381,000 (100kW); $3.8M (1MW)
• 303,000 Annual O&M (2014 $)
Simple Payback • $1,900 (100kW); $19,000 (1MW)
Install a 100kW and a 1MW
• more than 36 years Change in Demand
building integrated solar
• None
photovoltaic (BIPV) system.
Change in Supply
• Reduce Purchased Electricity
Additional Information:
Impact on GHG Emissions
• PV Watts-solar resource
• Reduce scope 2
Start Date
• 2015 (100kW); 2025 (1MW)
Useful Life
• 25 years
Average Annual Savings (2014 $)
• $8,060 (100kW); $80,600 (1MW)
Simple Payback
• more than 36 years
33 Tulane University 2014 Climate Action Plan Tulane University 2014 Climate Action Plan 34You can also read