Trent College Physics Department

 Preparing for A-Level
←
→
Page content transcription
If your browser does not render page correctly, please read the page content below
Trent College Physics Department Preparing for A-Level

Contents

 Information
 1. Introduction to the A-Level Course at Trent College
 2. Reading List
 3. Useful Websites
 4. Specification 7408
 Transition Tasks
 5. Units
 6. Standard Form, Prefixes & Significant Figures
 7. Mathematical Skills
 8. Practical Physics
 9. Graphing Data
 10. Vectors & Diagrams
 11. Noting
 12. Online Experiments
 13. Knowledge Check – Atomic structure, electricity, forces, waves
 14. Physics Baseline Assessment

Sections 1 to 4 contain useful information for the A- Level Physics
Course at Trent College.

Sections 5 to 14 contain notes and tasks that you need to complete as
part of bridging the gap between GCSE and A-Level.
1. Introduction

 1. Subject Content

We follow AQA Physics Specification 7408 with the Course split between two teachers: one covering 6 lessons and one
covering 7 lessons per fortnight. The subject is broken down in to distinct topics, although many of them interlink, and
are taught in the sequence below:

 Teacher 1 – 7 Periods per fortnight Teacher 2 – 6 Periods per fortnight
 Year 12
 Waves – progressive & stationary waves, Particle Model – atoms & fundamental particles
 Optics - reflection, refraction, TIR, diffraction Standard Model – quarks, leptons & interactions
 Year 12 November Exams
 Mechanics (Static) – Moments, bodies in Quantum Theory – Photoelectric Effect & Wave-
 equilibrium Particle Duality
 Mechanics (Dynamic) – linear & projectile DC Circuits – Circuit Theory, EMF & Internal
 motion Resistance
 Newton’s Laws of Motion Materials – Bulk properties of Solids
 Momentum
 End of Year 12 Exam
 Thermal Physics – energy transfer, specific heat Further Mechanics – Circular & Periodic Motion
 capacity and change of state and Resonance
 Year 13
 Fields – Gravitational & Electric Fields Nuclear Physics – nuclear radiation, radioactive
 decay, mass-energy equivalence, fission &
 fusion
 Capacitors – design, function & use Gas Law – Experimental & Ideal Gas Laws and
 Kinetic Theory
 Year 13 Mocks
 Electromagnetism – Motor & Generator Effects, Astrophysics – Optical & Non-Optical
 Alternating Current, Transformers Telescopes, Stellar Classification & Evolution and
 Cosmology
 A – Level Exams

 2. Prep

There is no fixed prep timetable in the Sixth Form; teachers will issue prep as and when it is needed. You can expect
to do a minimum of four hours across the subject. The amount required of you outside of prep very much depends on
how you are what your aspirations are and how you feel you are progressing. Those aiming for A* will undoubtedly
need to go the extra mile and those feeling they want to improve will certainly wish to push themselves to do that
little bit more.

There is never ‘no prep’ in Physics. Should your teacher decide not to issue you a specific prep, one of the standing
tasks below should be done.

Find & Fix Go back over previous work and make corrections
Organise Go through your folder and organise your work thematically
Lab Book Go through your lab book and ensure work is completed
Isaac Physics Create a login to Isaac Physics (www.isaacphysics.org) and attempt some challenging physics
 questions
Noting Read your textbook and create short notes for each chapter.
Revision Aids Make revision aids as you go
Practise Practise, Practise, Practise! (Be sure to review to improve each time)
3. Practicals

You will be issued a lab book to use in each year. Your Lab Book will contain all of your practicals (methods, results,
conclusions etc) and should be maintained to a good standard.

All students in the A-Level sciences are expected to complete Common Practical Assessment Criteria (CPACs) which
are assessed during 12 compulsory practical tasks. (You will do many more than just these 12). You can be graded as
Not Achieving, Achieving or Mastering each of the five criteria. Most universities insist on students passing the CPAC
element of the course as well as meeting a particular grade.

The criteria and practicals are:

 CPACs Required Practical
 1 – Follow written procedures 1 – Stationary Waves on a String
 2 – Apply investigative approaches and 2 – Double Slit Interference & Diffraction Gratings
 methods when using instruments and 3 – Investigation of ‘g’ by free-fall
 equipment 4 – Determination of Young’s Modulus
 3 – Safely use a range of practical 5 – Determination of Resistivity of a Wire
 equipment and materials 6 – Investigation of EMF & Internal Resistance
 7 – Investigation Simple Harmonic Motion
 4 – Make and record observations 8 – Investigation of Boyle’s & Charles’ Law
 5 – Researches, references and reports 9 – Investigation of Capacitor Charge & Discharge
 10 – Investigating Force on a Current Carrying Wire
 11 – Investigation of Magnetic Flux Linkage
 12 – Proving the Inverse Square Law for Gamma Radiation

 4. Assessment

Assessment is a fundamental part of A – Level study. The assessments we carry out are in order to gauge progress,
prepare for examinations and re-inforce curriculum knowledge and skills. Full engagement with the assessment and
review process is a characteristic shared by all successful students.

You will receive regular short tests at the end of each topic. Your teachers will guide you through a self-review of each
so that you can improve over the course; these tests will be used to inform the report grades that go home. You will
have three key assessments over your time in the Sixth Form: November of Year 12, Summer of Year 12 and January
of Year 13. These key assessments should be prepared for as fully as possible as they closely mirror you A-Level Exams
at the end of Year 13.

Your A – Level in Physics is assessed through three exam papers, each 2 hours in length, covering:

Paper 1 – Year 12 + Further Mechanics

Paper 2 – Year 13 without the Option Topic

Paper 3 – Practical Skills + Option Topic (Astrophysics)

 5. Co-Curricular

Opportunities for Physics outside of the classroom are varied and open to anyone to pursue. We have students take
part in the British Physics Olympiad through the AS and A2 Challenges as well as the option for a group to work through
the Experimental Project Competition. There are external and internal essay competitions to stretch and challenge
you beyond the confines of the course content. The new Lower School STEM club will be available for Sixth Form
students to help with or lead. If you have any ideas of anything co-curricular that you wish to be a part of, just let us
know and we will make it happen.

The Department also looks to run another trip to CERN, Geneva. COVID cancelled the last trip but we still managed a
virtual visit which will happen again if the trip is not possible.
6. How to get help

You will find some of A-Level Physics difficult and we would not be doing our job right if there was nothing in your
course that challenged you. Should you need help, there are a wide range of resources open to you:

Peers – discussing Physics helps improve your own understanding and working together to solve problems is the basis
of scientific endeavour
Textbook – we provide a good quality text book for you to use which will explain the subject content in detail; the
answer is normally in there somewhere
Online – the Department has an Intranet page as well as a subscription to Kerboodle. These, along with free sites like
Seneca Learning, are great sources of help and information. Mr Powell also has his own website with many useful
resources. https://animatedscience.co,uk
Help Sessions – the Department runs a weekly help session for those who cannot find their answers any other way.
Keep an eye out in the Science Building for the day & time of the help sessions.

 7. How to prepare

Over the summer holiday before joining Year 12, you have a good opportunity to familiarise yourself with the
forthcoming subject content. Review what you covered across your GCSEs and look to explore the course content
ahead of September. Come in refreshed and eager to learn how Physics can develop even further beyond Year 11.

 8. How to get the most out of Physics

In a word, try. Approaching Physics with the right mind-set is essential to success. There are elements of the course
that are challenging, there are elements that are easy but as long as you put in the effort, you will meet with success.
Reading around the subject and doing independent work and review outside of that which is assigned for prep is
essential to gaining a full understanding of the course content. Don’t forget to look to your peers; discussion and
conversation about Physics material will help cement your own understanding and allow you to convey your ideas
with fluency. Both of these are essential for written communication in exams as well as verbal communication in a
university interview.
9. Published Material

There are a number of CGP guides and other published material to help you prepare. Some of the companion resources
to the course are listed below. Please note that purchasing these is not a requirement but you may wish to use some
alongside the material you are provided by us:

 Provided by Trent College Physics Department

Oxford: AQA Physics Second Edition – Textbook used by students. International students have these provided as
part of their fees, day students have the cost of the textbook added to their school bill.

CGP: AQA A-Level Physics Exam Practice Workbook – this will be issued at the end of Year 12 and will form the Year
12 Summer Work Assignment.

CGP: AQA A-Level Physics Complete Revision & Practice – revision guide with additional question material. It is
intended that you will be issued one of these in Year 13.

 Available but not provided by Trent College Physics Department

Hodder: Aiming for an A in Physics – Part of the ‘Aiming for an A’ series. Covers study skills and techniques for those
aiming for the highest grades in the subject.

Hodder: Physics Review – Magazine (annual subscription for 4 issues per year) which applies Physics to context
while also highlighting and extending concepts covered in the course. Great for personal interest and intended for
use by Year 12 and 13.

Hodder: Physics Student Guide – Multiple books covering different sections of the specification containing summary
notes with practice questions and answers. (Ensure that these are for the 2015 Specification)

CGP: Essential Maths Skills for A-Level Physics – Study notes, examples and practice questions aimed at improving
mathematical skills as required in the context of A-Level Physics

CGP: Head Start to A-Level Physics – Revision Guide style book with some short questions intended to bridge the
gap between GCSE & A-Level
2. Reading List
Reading for pleasure and reading scientific writing regularly will help improve your performance in Physics and all of
your academic subjects. Exposure to a wide range of vocabulary and writing styles improves comprehension and
writing fluency which are essential skills at A-Level.

The below are recommended Physics books to further your interest in the subject:

 Title Author
 Storm in a Teacup: The Physics of Everyday Life Helen Czerski
 Wonders of the Universe Brian Cox
 Wonders of the Solar System Brian Cox
 How to Build a Universe Brian Cox & Robin Ince
 A Short History of Nearly Everything Bill Bryson
 An Astronauts Guide to Life on Earth Chris Hadfield
 17 Equations that Changed the World Ian Stewart & John Davey
 Astrophysics for People in a Hurry Neil deGrasse Tyson
 Seven Brief Lessons on Physics Carlo Rovelli
 The End of Everything: Astrophysically Speaking Katie Mack
 What If?: Serious Scientific Answers to Absurdly Randall Munroe
 Hypothetical Questions

 3. Useful Websites
The websites below provide useful study material for A-Level Physics. Some you have access to through school, some
you must create a free account for and some are freely available.

 Website Description url
 Seneca Review & Self-Test on Specification material.
 www.senecalearning.com
 Learning Login via Firefly
 Online question papers and online textbook.
 Kerboodle www.kerboodle.com
 Account created by school in Year 12.
 Online Questions designed to stretch &
 Isaac Physics www.isaacphysics.org
 support
 PhET Online experiment simulations https://phet.colorado.edu/
 Khan Academy Videos explaining physics concepts www.khanacademy.org
 YouTube channel with short explanations of
 Minute Physics https://www.youtube.com/user/minutephysics
 Physics concepts
 Animated Explanations, questions, PowerPoints and www.animatedscience.co.uk
 Science videos developed by Mr Powell https://www.youtube.com/djrpowell

 4. Specification
The A-Level Course at Trent College follows AQA Physics with the Astrophysics Option; the syllabus code for this is
7408A.

The AQA website has a downloadable specification and other support material.

https://www.aqa.org.uk/subjects/science/as-and-a-level/physics-7407-7408
5. Units Units are defined so that, for example, every scientist who measures a mass in kilograms uses the same size for the kilogram and gets the same value for the mass. Scientific measurement depends on standard units – most are Système International (SI) units. Every measurement must give the unit to have any meaning. You should know the correct unit for physical quantities. Base units – these are the seven fundamental quantities from which all other units are derived. Physical quantity Unit Symbol Physical quantity Unit Symbol length metre m electric current ampere A mass kilogram kg temperature Kelvin K difference time second s amount of substance mole Mol Derived units Example: distance travelled speed time taken If a car travels 2 metres in 2 seconds: 2 = = 1 = 1 −1 2 This defines the SI unit of speed to be 1 metre per second (m/s), or 1 m s−1 (s−1 = 1 / s) AQA exams often require students to give units as an independent mark in a calculation question so a good knowledge of the ones used is important. In A-Level Physics, units do not use the per symbol “/”. Instead, they raise the unit to the power of -1. E.g Metres per Second is no longer m/s but becomes ms-1 Metres per second squared is no longer m/ss but becomes ms-2
Task 1 – Complete the table. Fill in the table with the relevant SI Unit and base unit. You should try to do them all yourself but you can look them up if needed. Derived quantity Defining equation Standard SI unit Equivalent (if applicable) base units speed S=d/t n/a m∙s-1 momentum p=mv n/a kg∙m∙s-1 acceleration a = (v - u) / t n/a Force F=ma newton (N) power = work/time Power P = W/t frequency = 1/time period frequency s-1 f=1/T charge = current × time Charge coulomb (C) A∙s Q=It potential voltage = work/charge difference V = W/Q resistance R=V/I specific heat SHC = Energy / (mass × temperature change) capacity c = Q / (m × )
6. Standard Form, Prefixes & Significant Figures
When describing the structure of the Universe you have to use very large numbers. There are billions of galaxies and
their average separation is about a million light years (ly). The Big Bang theory says that the Universe began expanding
about 14 billion years ago. The Sun formed about 5 billion years ago. These numbers and larger numbers can be
expressed in standard form and by using prefixes.

In standard form, the number is written with one digit in front of the decimal point and multiplied by the appropriate
power of 10. For example:

The diameter of the Earth, for example, is 13 000 km.

13 000 km = 1.3 × 10 000 km = 1.3×10⁴ km.

The distance to the Andromeda galaxy is 2 200 000 light years = 2.2 × 1 000 000 ly = 2.2×10⁶ ly.

At the other end of the scale, the diameter of an atom is about a tenth of a billionth of a metre. The particles that
make up an atomic nucleus are much smaller. These measurements are represented using negative powers of ten and
more prefixes. For example:

The charge on an electron = 1.6×10⁻¹⁹ C.

The mass of a neutron = 0.016 75 × 10−25 kg = 1.675×10⁻²⁷ kg (the decimal point has moved 2 places to the right).

There are a billion nanometres in a metre, that is 1 000 000 000 nm = 1 m.

There are a million micrometres in a metre, that is 1 000 000 μm = 1 m.

 Good A-Level Physics students are able to recall the common prefixes used and are confident in their use.

Significant Figures (also called sig figs and s.f.) - Read from the left and start counting sig figs when you encounter the
first non-zero digit

All non-zero numbers are significant (meaning they count as sig figs)

• 613 has three sig figs
• 123456 has six sig figs

Zeros located between non-zero digits are significant (they count)

• 5004 has four sig figs
• 602 has three sig figs
• 6000000000000002 has 16 sig figs!

Trailing zeros (those at the end) are significant only if the number contains a decimal point; otherwise they are
insignificant (they don’t count)

• 5.640 has four sig figs
• 120000. has six sig figs
• 120000 has two sig figs – unless you’re given additional information in the problem
Zeros to left of the first nonzero digit are insignificant (they don’t count); they are only placeholders!

• 0.000456 has three sig figs
• 0.052 has two sig figs
• 0.000000000000000000000000000000000052 also has two sig figs!

Rules for calculations

When you perform a calculation the answer should be given to the same number of significant figures as the weakest
piece of data that was used in the calculation. For example if a piece of card is 11.3 cm long and 2.4 cm wide then the
area = 27.12 cm2 (on the calculator), but should be written as 27 cm2 (i.e. 2 sig fig) because the width (2.4) was only
given to 2 sig fig.

Task 2 – Complete the table

Fill in the table with the correct prefixes used in A-Level Physics and what each of them denote.

 Symbol Multiplier Which means…

 terra

 × 109

 M × 1,000,000

 k × 1000

 (None) --- --- ×1

 m

 micro / 1,000,000

 n

 × 10-12

 f
Task 3 – Answer the following questions

1. Expand each of these quantities to write out the answer in full (i.e. without the prefixes)

 900 mV
 12 MJ
 1.67 mm
 3.456 kg
 700 nm
 0.72 pA

2. Write each of the following using an appropriate prefix:

 0.005 A
 30000 s
 5 × 10⁵ m
 1001 m
 0.006 V
 2,100,000 N

3. Convert each of the following to the indicated units:

 34 nm mm

 0.012 s µs

 4.5 MJ kJ
Task 4 – Answer the following questions.

1. State the number of sig figs in each of the following numbers:

 0.0000055 g 1.6402 g 3.40 × 10³ mL

2. Compare the following numbers:

 370 000 vs 3.70 × 10⁶ (standard form)

Explain the advantage of giving an answer in standard form

3. Complete each of the following calculations using your calculator, giving your answer in standard form with the
correct number of significant figures, with your answer in the units indicated.

 (a) ρ = m / V = 0.542 g / 0.027 cm3 =
 g∙cm-3
 (b) E = m c2 = 231.5 × 10-3 × (3.00 × 108)2 =
 J
 (c) Mean time = (23 + 20 + 21 + 22 + 25) / 5 =
 s
 (d) Height difference = 2.32m – 2.07m =
 m
7. Mathematical Skills
There is no getting away from it, A-Level Physics requires you to do some maths. In fact, 40% of the marks across the
question papers will assess mathematical skills at higher tier GCSE level.

 All A-Level Physics students need to be able to re-arrange, substitute and simplify equations throughout the
 course

Some helpful examples of re-arrangements

 = + = −

 = =

 = 2 = √

 =
 = √

 1
 = −1 =

 1 2
 = 2 =√
 2

 sin( ) = = sin−1 ( )

 = = ln( )

 = 10 = log( )
Task 5 – Complete the table below showing the correct re-arrangements.

Hint: If you are unable to insert equations, use the following expressions:

x^2 = x-squared. b^(-1) = b to the power of -1. a/b = a divided by b. sqrt(z) = square root of z.

arcsin = inverse sin (or sin to the minus 1)

 Initial Equation 1st re-arrangement 2nd re-arrangement 3rd re-arrangement

 y=x/t x= t=

 F=ma

 a = (v – u) / t v= u= t=

 s = ut + ½ a t2 u= a= t

 (1/x) = (1/y) + (1/z) y= z=

 Sin (c) = 1 / n c= n=
Laying out your calculations When answering physics questions you need to lay out your working clearly showing all the steps, working left to right and top to bottom. Your final answer should be found to the bottom right of your working and should be underlined. Below is an example for you to base your own answer style on. Ch6, Q4 A white snooker ball with a kinetic energy of 15J collides with a red ball. On impact the white ball stops, transferring all of its KE to the red ball. The mass of the red ball is 120 g. What would be the velocity of the red ball immediately following the collision? STEPS: List the values you know and the values you don’t know. Helps you narrow down the equation you need. Equation being used Some questions have marks for this. Rearrange Easier to do before the numbers go in. Values inserted Re-arrangement + substitution = 1 mark Calculated answer Give unrounded first, then rounded. Units Often given, sometimes worth marks. Sig fig Often ignored, sometimes worth marks. = 15 = 120 = 0.12 =? ? 1 2 KE mv 2 2 KE v2 m 2×15 v= √0.12kg 15.8 ms -1 16 ms -1 (2sf ) EIGHT STEPS TO IMPROVE THE QUALITY OF YOUR WORKING Show all steps Work left to right and top to bottom Rearrange equations before substituting values If a calculation is two step, underline the answer to the first step before proceeding as this may get marks Your writing should be small and neat. Don’t scrawl. You should be able to easily check over your working to find mistakes Plan to use the available answer space wisely Try to leave space for correcting mistakes if you go wrong
Both of the answers below are correct, both calculate a value that rounds to 2.0m. Aim for the one on the right!

Task 6 – Answer the question below by hand. Show you working out in a clear and logical fashion following the
steps above. Once finished, take an image of the working with the MS Office Lens app and upload the image along
with the assignment in Teams.

Ensure the submission is labelled cleared with “Task 6” and your name.

A measuring cylinder is filled with 1.00 litres of water. The column of water inside forms a regular cylinder 32.0 cm
high.

What is (a) the area of the surface of the water (in mm2)?

(b) the internal diameter of the cylinder (in mm)?

(TIP: Visualise the problem clearly. Draw a diagram if it helps. Use the equation or the volume of a cylinder)
8. Practical Physics
 As a practical subject, Physics requires a good amount of skill in the collection, recording and processing of
experimental data. Not only will these skills be checked as part of your Common Practical Assessment Criteria (CPACs)
in your required practicals but they will also be examined in the first section of Paper 3 at the end of the course.

 AQA publish a Practical Handbook designed to help guide staff & students through their course. A hard copy of
 the Department’s version will be provided in September. AQA’s version is available here:

 https://filestore.aqa.org.uk/resources/physics/AQA-7407-7408-PHBK.PDF

Collecting Data

In A-Level Physics, you will use a range of equipment, some familiar and some new. When recording data in a results
table, there are simple rules that need to be followed:

 1. Data is recorded as you go. Do not scribble results on paper and copy them up neat later on
 2. All columns have headings of the form: quantity / unit. E.g. length / m
 3. All results in the column should be to the same precision. This is the precision of the device used to collect the
 data. For example, if a Voltmeter records to 2 d.p, all results in that column will be to 2 d.p.
 4. Results should be repeated up to at least three readings with mean calculated to the same precision as the
 results.
 5. Anomalous results are ignored or re-tested before the mean is calculated.
 6. Increments for the independent variable should be equal and sensible. i.e. they should go up by the same
 amount each time.

Task 7 – Identify the four mistakes that have been made by the student when they recoded the data below.

 Time

 Length/cm Trial 1 Trial 2 Trial 3 Mean

 10 1.45 1.48 1.46 1.463

 22 2.78 2.72 2.74 2.747

 30 4.05 4.01 4.03 4.03

 41 5.46 5.47 5.46 5.463

 51 7.02 6.96 6.98 6.98

 65 8.24 9.68 8.24 8.72

 70 9.01 9.02 9.0 9.01

Type your answers in the table below.

 1
 2
 3
 4
Task 8 – Complete the table below to show the effect of anomalies on the mean.

For each set of values calculate the mean and then calculate the mean from the data shown then the mean ignoring
any anomalous results.

 1 2 3 Mean (raw) Mean (without anomalies)
 4152 2996 4018
 935.5 925.8 926.7
 16.2 19.1 17.4
 80.1316 80.1324 80.1466
 2229 2011 1610
 127.664 127.416 127.489
 55.88 11.97 37.59
 3.767 3.763 3.751
 375.5 511.5 463.4
 1048 888 1655
 0.507 0.415 0.230
 27145 25157 26017
 1450 1014 2238
 9104.32 10529.45 9160.97
Accuracy, Precision and Resolution An accurate result is one that is judged to be close to the true value. It is influenced by random and systematic errors. The true value is the value that would be obtained in an ideal measurement. A precise measurement is described when the values ‘cluster’ close together. We describe measurements as precise when repeated values are close together (consistent). It is influenced by random effects. Resolution is the smallest change in the quantity being measured that causes a perceptible change in the output of the measuring device. This is usually the smallest measuring interval. It does not mean a value is accurate. Uncertainty is variation in measured data and is due to random and systematic effects. We usually assume the uncertainty is the same as the resolution of the measuring instrument. Example: ruler, resolution +/- 1 mm so uncertainty is also +/- 1 mm Stop watch used by a pupil, resolution +/- 0.01 s but uncertainty estimated as +/- 0.2 s due to human reaction time. For our exam we estimate uncertainty and as long as you have a sensible justification your answer will be ok. E.g. The true temperature of the room is 22.4 C. One thermometer gives a reading of 22 C and another gives a reading of 23.4 C . Which is most accurate and estimate its uncertainty? 23.4 C has the best resolution but is not close to the correct value. 22C has less resolution but is more accurate as it is closer to the correct result. The uncertainty in this reading is C Errors There are two main types of error in Science: 1) Random error 2) Systematic error Random errors can be caused by changes in the environment that causes readings to alter slightly, measurements to be in between divisions on a scale or observations being perceived differently by other observers. These errors can vary in size and can give readings both smaller and larger than the true value. The best way to reduce random error is to use as large values as possible (eg. Large distances) and repeat and average readings, as well as taking precaution when carrying out the experiment.
Systematic errors have occurred when all readings are shifted by the same amount away from the true value.
The two main types of systematic error are:
 i) Zero error – this is where the instrument does not read zero initially and therefore will always produce
 a shifted result (eg. A mass balance that reads 0.01g before an object is placed on it). Always check
 instruments are zeroed before using.
 ii) Parallax error – this is where a measurement is not observed from eye level so the measurement is
 always read at an angle producing an incorrect reading. Always read from eye level to avoid parallax.

 Parallax Error
 Zero Error

Repeat and averaging experiments will not reduce systematic errors as correct experimental procedure is not being
followed.

There are occasions where readings are just measured incorrectly or an odd result is far away from other readings –
these results are called anomalies. Anomalies should be removed and repeated before used in any averaging.

Improving Experiments

When improving accuracy, you must describe how to make sure your method obtains the best results possible. You
should also try to use as large quantities as possible as this reduces the percentage error in your results. Also make
your range as large as possible, with small intervals between each reading.

Resolution refers to the smallest scale division provided by your measuring instrument, or what is the smallest non-
zero reading you can obtain from that instrument.

Reliability refers to how ‘trustworthy’ your results are. You can improve reliability by repeating and averaging your
experiment, as well as removing anomalies.
Task 9 - For each of the measurements listed below identify the most likely source of error what type of error this is
and one method of reducing it.

 Measurement Source of error Type of error

 A range of values are obtained for the
 length of a copper wire

The reading for the current through a wire
 is 0.74 A higher for one group in the class

 A range of values are obtained for the
rebound height of a ball dropped from the
 same start point onto the same surface.

 A few groups obtain different graphs of
 resistance vs light intensity for an LDR. A
 light bulb placed at different distances
 from the LDR was used to vary the light
 intensity.

The time period (time of one oscillation) of
 a pendulum showing a range of values
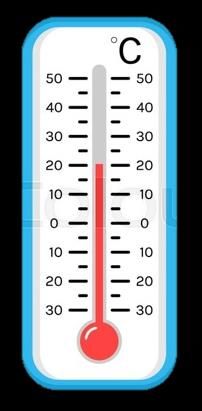
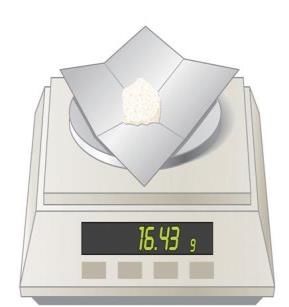
Task 10 – Complete the table below to state how to use the measuring instruments as accurately as possible, as
well as stating the precision (smallest scale division) of each instrument.

 Resolution
 Accuracy
 Measuring Instrument State the resolution of
 What procedures should you use to ensure you the instruments
 gain accurate results? shown in the diagram.

 Measuring Cylinder

 Top Pan Electronic (Mass) Balance

 Ruler

 Thermometer
9. Graphing Data
Producing graphs in Physics is an essential skill. Every experiment will require one and there a number of exam
questions every year that focus on interpreting graphs.

You will be marked on graphs in a similar way to GCSE, only with stricter adherence to the criteria. (Remember A-Level
= Advanced Level).

When drawing graphs, you will be marked on the following criteria:

 1) Axes – Your independent variable is on the x axis, and your dependent variable is on the y axis. Both axes
 need to be labelled.
 2) Units – Add units to your axes when labelling.
 3) Scale – Make your scale as large as possible so that your data fills most of the page. You don’t have to start
 your axes at the origin. Make sure you have a regular scale that goes up in nice numbers – 1, 2, 5, 10 etc…
 4) Points – mark each point with a cross using a sharp pencil. Don’t use circles or dots as points.
 5) Line of best fit – draw a smooth line of best fit – straight or curved depending on what pattern your data
 follows.

An easy way to remember these points is….. S cale
 L ine
 A xes
 P oints
 U nits
When drawing lines of best fit, draw a smooth straight or curved line that passes through the majority of the points.
If you can, try to have an even number of points above and below the line if it can’t go through all points.

When describing the trend, use the phrase….

“As ‘X’ increases, ‘Y’ increases/decreases in a linear/non-linear fashion.”

To add more detail, refer to whether the gradient (steepness) increases or decreases.

Substitute the quantities into X and Y, and choose either of the two options to describe the graph.

 Eg.

 As time increases, the count rate decreases in a non-linear fashion.
 There is a decreasing negative gradient.
Task 11 -Draw a line of best fit for each of the graphs and describe the trend shown by each (call the quantities X
and Y).

 1. 2.

 3. 4.
Task 12 - Plot graphs for the following sets of data, including a line of best fit for each.

 Surface area of Time taken for
 pendulum / cm2 pendulum to stop/ s

 5.0 170

 6.2 127

 7.4 99

 8.0 86

 8.8 70

 9.9 56

 Current / A Voltage / V

 0.07 1.46

 0.14 1.44

 0.21 1.42

 0.30 1.40

 0.41 1.38

 0.57 1.33

 0.81 1.29

Grids are available on the next page.
Remember - SLAPU
Gradients (straight lines)

Gradients are a useful tool that show how fast or slow quantities change – eg speed tells us how fast distance is
changing, or how quickly energy is being lost over time.

To calculate the gradient, pick any two points on the line as far away as possible and draw a large triangle between
them.
The gradient is given by:

 =

But make sure the you subtract the values in the same order! Remember – if the line slopes up, the gradient should be
positive; if the line slopes down, then the gradient should be negative.
 For the example here:
 5−3
 =
 6−2
 2
 =
 4
 = 0.5

Gradient Units

Graphs with particular variables plotted on the y and x axes will have units derived from those on the axes. A common
example from GCSE is that of velocity. The gradient of a graph of distance against time will give the velocity. The units
of each axis are combined to give units of the gradient.

The gradient units always follow the same format:

 (y-unit)(x-unit)-1

For example:

 Y-Axis Unit X-Axis Unit Gradient Unit
 Metres, m Seconds, s Metres per second, ms-1
 Volts, V Metres, m Volts per Metre, Vm-1
 Time2, seconds2 Metres, m T2m-1
Task 13– Calculate the gradients of the graphs below.

Calculate the gradients of the graphs below

 1 2

 3 4

Give the correct unit for the gradient of each graph:

 Graph X – Variable Y – Variable Gradient Unit (words) Gradient Unit (symbols)
 1 Voltage Current

 2 Resistance Length

 3 Power Area

 4 Energy Temperature
Gradients – Curved Lines

A number of graphs in Physic will not produce linear relationships but will instead form curved, non-linear graphs. To
find the gradients for these graphs, we find the gradient at the point we are interested in.

If we want to know the gradient at a particular point, firstly we need to draw a tangent to the curve at that point.
A tangent is a straight line that follows the gradient at the required point. Once we have drawn the straight line
tangent, its gradient can be calculated in exactly the same way as the previous page showed.

Tip – make sure your tangents and gradient triangles are as big as possible to be as accurate as you can!

Examples of drawing tangents and calculating the gradient of a tangent:

 Rate = - 0.00025 M/s
Task 14 - Draw a tangent to the line and calculate its gradient at the following x-axis values:

Graph 1 - 2.0 and 4.0

Graph 2 - 1.5 and 3.5
Interpreting Graphs

When interpreting graphs that are worth more than 2 marks, you need to go into more detail describing how the
gradient changes over time and pick specific values to help support your answer.

Tips:
Use the quantities on the axes to support your answer.
Are there any points where the y value doesn’t change? What is this value? When does this happen on the x axis?
Are there any maximum or minimum values? What are they? When do they occur?
The gradient increases/decreases at a constant/increasing/decreasing rate….
Does the gradient represent anything (eg. velocity or acceleration)?
Are there multiple gradients? Are some steeper than others?

As the mass of the load increases, the diameter of the parachute needed also increases at a constant rate. This occurs
to a mass of 3.4kg (which gives a diameter of 2.8m), where the gradient increases at a decreasing rate until the
diameter remains constant at 3.1m for any load beyond 4.4kg. .
Task 15 - Describe in detail each graph. Write your answer at the side of each graph. Include the points mentioned
under ‘tips’ in your answers.
10. Vectors & Diagrams

Resolving vectors
In A level Physics you will need to work with vectors that act at odd angles. Often the easiest way to deal with this is
to convert the diagonal vector into horizontal and vertical components.

Vectors are quantities with both magnitude and direction.

Scalars are quantities with magnitude only.

E.g.

Speed: Scalar

Velocity: Vector

Force: Vector

Temperature: Scalar

Directions for vectors can be given using the positive & negative symbols if a positive direction is specified. For
example, is upwards is defined as positive, a falling object would have a negative velocity. Directions can also be given
using angles measured against a certain direction. E.g. North-East would be 450 to the right of Vertical.

Representing Vectors

To represent vectors in a diagram, an arrow is used. The length of the arrow shows the magnitude of the vector and
the direction of the arrow is the direction of the vector.

Combining Vectors

Forces can be combined together to form a Resultant Force which shows the combined effect of both forces. They
can be drawn to scale or be calculated using trigonometry.

 For example, in the case of a force F acting at an angle ϴ, can be treated
 as two forces acting horizontally (Fx) and vertically (Fy). These can be
 calculated with trigonometry:

 Fy = F Sin (ϴ) and Fx= F Cos (ϴ)
Task 16 – Vectors

Watch the YouTube video linked below.

 https://www.youtube.com/watch?v=fMkctIXg8P0

In the space below, make notes that will instruct you on how to solve problems involving Vectors in the future.
11. Noting
Textbook Notes

Your A-Level textbook is 586 pages long – that’s a lot of information. As with all textbooks, it contains more information
than is needed as there are times it looks to stretch you beyond the scope of the syllabus. Being able to take concise,
accurate and, above all, useful notes from a textbook is key to success at A-Level.

Guided Noting: Your teachers will, on occasion, require to make notes from a textbook chapter using a Guided
 Noting task. This will use prompts and questions to ensure that you pick out the key
 information from each chapter.

Un-Guided Noting: Your teachers will, on occasion, require to make notes from a textbook chapter using an Un-
 Guided Noting task. This will require you to select the most important information and
 examples from a Chapter without necessarily being told which ones you should go for.

There is no set way to make notes from a textbook, but there are two key aspects to them:

 They are not direct copies of the textbook.

 They are useful to you

Classroom Notes

Your A-Level teachers will not always tell you what you need to write down. You are, by studying A-Level, preparing
for university and lecturers will certainly not tell you what to write. You will find it challenging to write down everything
that is covered in a lesson but there are methods that will help.

The YouTube video below shows a range of different note taking styles.

 5 Different Note-Taking Methods
Task 17 – Noting.

1. Watch the Video linked below and write notes on it using one of the methods outlined in the previous YouTube
 video.

 https://www.youtube.com/watch?v=Ch6jti8i6u4

2. In the space below, describe which method you used and comment on the benefits and drawbacks that you
 encountered.
12. Online Experiments

In order to practise your results taking and graphing skills, you are going to perform some online experiments using
the Focus eLearning suite.

Task 18 – Experiments

Experiment 1 – Bending a Beam

http://www.focuselearning.co.uk/s/2kolm8nb8pbz

Using the link above, conduct an experiment to arrive at a graph of Deflection (y-axis) against Load (x-axis)

You will need to produce:

 1. A results table with headings, units, repeats and averages
 2. An accurately plotted graph with line of best fit
 3. A calculated gradient
 4. A conclusion based on the shape of the graph.

Experiment 2 – Lift on a Wing

http://www.focuselearning.co.uk/s/5er4azigx6ee

Using the link above, conduct an experiment to arrive at an answer to the following question:

 “At what angle would a wing generate the greatest force of lift”

You will need to produce:

 1. A results table with headings, units, repeats and averages
 2. An accurately plotted graph with line of best fit
 3. A conclusion based on the shape of the graph.
13. Knowledge Check

A firm grasp on concepts covered at GCSE Level is required for those studying A-Level Physics.

Task 19 – Knowledge Check – Trent Students

For those with Trent College access to GCSE Pod. Click the link below, watch the videos included and make detailed
notes about the content of each.

https://members.gcsepod.com/shared/podcasts/title/13637/82007

Task 19 – Knowledge Check – External Applicants

For those without a Trent College access to GCSE Pod, notes for the full IGCSE Physics course can be found here:

https://drive.google.com/drive/folders/1oFovMLHFdO_3U-4J7NewNTwCGDCHeR3A?usp=sharing

Review the notes and produce a knowledge organiser of their content so they are secure in your mind.
14. Physics Baseline Assessment
In order to give you and us an idea of how well prepared you are for the coming A-Level course, complete the test
outlined below.

You can type in to the spaces provided or print and complete the work by hand.

Submitting the work can be done by MS Teams (Trent Students) or by e-mail to the Head of Department on:

ben.hayton@trencollege.net
A Level Physics Transition Baseline Assessment

40 Marks – 40 Minutes

A single piece of graph paper is required for the completion of the assessment.

You may use a calculator.

 Question Topic Score
 Number

 1 Symbols and Prefixes /3

 2 Standard Form & Significant Figures /7

 3 Re-arranging Equations /3

 4 Atomic Structure /3

 5 Recording Data /3

 6 Graphing /4

 7 Forces and Motion /10

 8 Electrical Circuits /5

 9 Waves /5

 Total /40
Q1 Complete the following table:

 Unit prefix Meaning
 k (kilo) x 1000
 X 0.000001
 M (mega)
 N (nano)
 [3]

Q2

a) Write the following numbers into standard form.

 0.012
 120000
 0.00000012

 [3]

b) Complete the following calculations and right your answers to an appropriate number of significant figures.

 2.1 X 0.15
 0.345 ÷ 0.114

 [4]

Q3 Re-arrange the following equations to make R the subject of the equation.

 Q = WERTY

 Q2 = WR2

 Q = W – RT2
 [3]

Q4 Name the 3 particles (from GCSE) that make up an atom.

 [1]

Which one of the above particles is not found in the nucleus of an atom?

 [1]

Which of the above particles will be found in varying quantities in the nuclei of isotopes of the same element?

 [1]
Q5

Complete the following table

 __________ (A)

 Voltage (__)

 Repeat 1 Repeat 2 Average

 2 0.23 0.26 0.25

 4 0.46 0.53

 6 0.69 0.78 0.74

 8 0.92 1.04 0.98

 10 1.15 1.30 1.23

 [3]

Q6

a) Use your piece of graph paper to plot a graph of Current (x-axis) against Voltage (y-axis) drawing a line of best fit
through your data points.

 [4]

b) Find the gradient of your line of best fit

 [3]

 Paste a Photograph of both Graph and Gradient Calculation on the next page.
Q7 The graph below shows the journey of a skydiver after they have left the plane.

a) Explain the shape of the graph commenting on how and why the forces have changed.

 [6]
b) Calculate the distance travelled whilst at the second terminal velocity.

 [2]

c) Calculate the average acceleration in the first 20 seconds.

 [2]

Q8

 a) Draw a circuit diagram to show how the resistance of a filament bulb could be measured using an ammeter
 and a voltmeter.

 PASTE PHOTOGRAPH HERE

 [2]

b) Look at the circuit diagram below. All of the resistors are identical.

Write the missing values of current and potential difference:

 V1 =
 V2 =
 A1 =

 [3]
Q9 The diagram below shows a diagram of 3 complete longitudinal wave oscillations on a slinky:

 a) State the wavelength of the wave shown

 [1]

b) Label a complete wavelength on the diagram above with the correct symbol used for wavelength in GCSE and A
Level Physics

 [1]

c) If the above wave had a frequency of 5Hz how long would it take an individual hoop to complete 1 full oscillation?

 [1]

 d) Calculate the speed of the wave and give the unit

 = ×

 END OF ASSESSMENT
You can also read