Treadmill Running Induces Remodeling of the Infrapatellar Fat Pad in an Intensity-dependent Manner - Research Square
←
→
Page content transcription
If your browser does not render page correctly, please read the page content below
Treadmill Running Induces Remodeling of the Infrapatellar
Fat Pad in an Intensity-dependent Manner
Ni Zeng
First Affiliated Hospital of Fujian Medical University
Tao Liao
First Affiliated Hospital of Fujian Medical University
Xin-yuan Chen
First Affiliated Hospital of Fujian Medical University
Zhi-peng Yan
First Affiliated Hospital of Fujian Medical University
Jie-ting Li
First Affiliated Hospital of Fujian Medical University
Guo-xin Ni ( niguoxin@bsu.edu.cn )
First Affiliated Hospital of Fujian Medical University
Research Article
Keywords: infrapatellar fat pad, treadmill running, fibrosis, remodeling, inflammation
Posted Date: March 30th, 2021
DOI: https://doi.org/10.21203/rs.3.rs-361688/v1
License: This work is licensed under a Creative Commons Attribution 4.0 International License. Read Full License
Page 1/14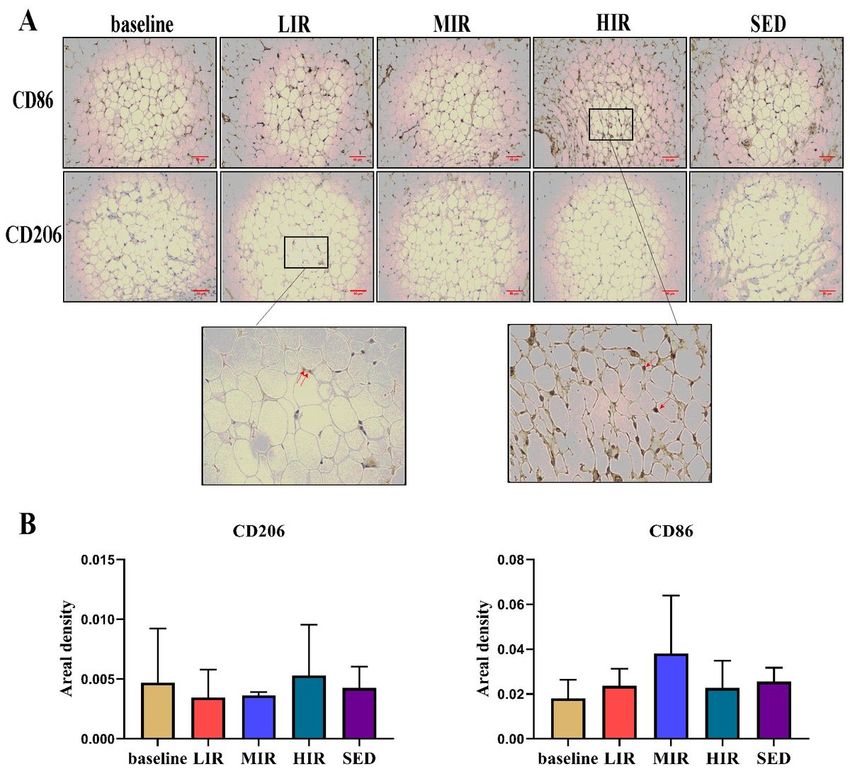
Abstract
Objective: To investigate the response of the infrapatellar fat pad (IFP) to running at different intensities and further
explore the underlying mechanisms of these responses under different running-induced loadings.

Methods: Animals were randomly assigned into the sedentary (SED), low-intensity running (LIR), medium-intensity
running (MIR), and high-intensity running (HIR) groups. Rats in the LIR, MIR, and HIR groups were subjected to an 8
week treadmill running protocol. In each group, the IFP was examined at the baseline and the 8th week to perform
histomorphology, immunohistochemistry, and mRNA expression analyses.

Results: Compared with LIR and MIR, HIR for 8 weeks led to a considerable increase in the surface cellularity
(1.67±1.15), fibrosis (1.29±0.36), and vascularity (33.31±8.43) of the IFP but did not increase IFP inflammation or M1
macrophage polarization. Compared with the SED group, low-to-medium running resulted in unchanged or decreased
fibrosis, vascularity, and surface cellularity in the IFP. Furthermore, serum leptin and visfatin levels were significantly
lower in the LIR and MIR groups than in the SED group or HIR group (P
the IFP [9]. Using a rat model, running was found to transiently upregulate IFP inflammation, activate macrophages,
and induce fibrosis, suggesting a physiologic role for inflammation in load-induced IFP remodeling in young healthy
knees [9]. However, a single running program was applied in this study. In this regard, the present study aimed to
investigate the response of the IFP to running at different intensities and further explore the underlying mechanisms of
the responses of the IFP under different running-induced loadings.

Material And Methods
Animals

This study was approved by Animal Ethics Committee of Fujian Medical University. Thirty male Sprague-Dawley rats at
8 weeks of age, 200–220 g in weight, were randomly and evenly assigned to one of four groups as follows: the (1)
sedentary (SED) group, (2) low-intensity running (LIR) group, (3) medium-intensity running (MIR) group, and (4) high-
intensity running (HIR) group. The animals were housed under a 12 h/12 h light/dark cycle with food and water
available ad libitum.

Exercise protocols

The animals in all exercise groups were first accustomed to exercise for 1 week by running on a treadmill at speed of
10 m/min for 30 min/day. Subsequently, according to previously described running protocols [2], animals in the HIR
group, LIR group, and MIR group ran on a motor-driven treadmill designed for rodents once a day, 5 days a week for 8
weeks. The speed and inclination were determined according to the following schema: LIR: 15.2 m/min with 0° of
inclination for 60 min, MIR: 19.3 m/min with 5° of inclination for 60 min, and HIR: 26.8 m/min with 10° of inclination
for 60 min. Animals in the SED group were maintained in a sedentary state.

Animals in each group were euthanized under anesthesia by cervical dislocation either on the 1st day of the formal
experiment (baseline) or the 8th week. Their IFPs from both sides were collected; the right IFP was used for histological
assessment, and the left one was used for gene expression analysis.

Histological assessment

Paraffin-embedded samples were used to prepare 4-μm-thick sections that were then stained with hematoxylin-eosin
(HE) or Masson for histological assessment. The HE-stained sections of the IFP were used to determine the number
and size of adipocytes, cellularity, number of crown-like structures per 1,000 adipocytes, and vascularization, whereas
the MT-stained sections were used to assess the amount of collagen (fibrosis) in the IFP. The number and size of
adipocytes in the IFP were determined using Image-pro plus 6.0 (Media Cybernetics, Inc., Rockville, MD, USA). The
number of crown-like structures (a structure formed by monocytes/ macrophages localized in the periphery of
degenerating adipocytes that is associated with the inflammation of adipose tissue) per 1,000 adipocytes was
evaluated to reflect the inflammatory state of the IFP according to previously described criteria [14]. Vascularization
was evaluated in the HE-stained tissue sections; the number of vessels was counted in a whole slice, and four slices
were counted for each sample to obtain the averaged value. The % area of fibrosis was measured using ImageJ
software (National Institutes of Health, Bethesda, MD, USA). Additionally, IFP cellularity and fibrosis score were semi-
quantitatively evaluated according to previously described criteria [15].

Immunohistochemical assessment

Sections were stained with CD86 and CD206 antibodies for the immunohistochemistry (IHC) evaluation and
assessment of the phenotypes of macrophages that infiltrated into the IFP. Images were analyzed using Image-pro plus

                                                        Page 3/14
6.0. Positive staining for CD86 indicated the M1 macrophage phenotype, and positive staining for CD206 indicated the presence of M2 macrophages. Serum adipokine measurements After blood samples were kept at room temperature for 1 h, the serum was collected after centrifugation at 300 × g for 15 min and stored at -80 °C until analyzed. Serum levels of leptin and visfatin were detected by enzyme-linked immunosorbent assay (ELISA) according to the manufacturer’s instructions (Elabscience Biotechnology Co., Ltd., Wuhan, China). Quantitative real-time polymerase chain reaction (qRT-PCR) Messenger RNA (mRNA) levels of PPARg, ATGL, LPL, SFRP2, HOXC9, IL-6, and MCP-1 were quantitated by quantitative polymerase chain reaction (qPCR) using a Real-Time PCR Detection System (ABI). The PCR primer sequences are listed in Table 1. Fold changes (x-fold) in gene expression levels were calculated by the 2ct method. Statistical analysis Data were statistically analyzed using SPSS 23.0 software. All experimental data are expressed as the mean ± standard deviation. Differences between multiple groups were determined statistically by one-way ANOVA followed by a homogeneity test of variance. Post hoc LSD or Kruskal-Wallis H tests were used for multiple comparisons. P
groups between the baseline and 8th week values of each parameter. Additionally, for the values of the parameters at
the 8th week, no significant differences were found among the four groups.
Cellularity
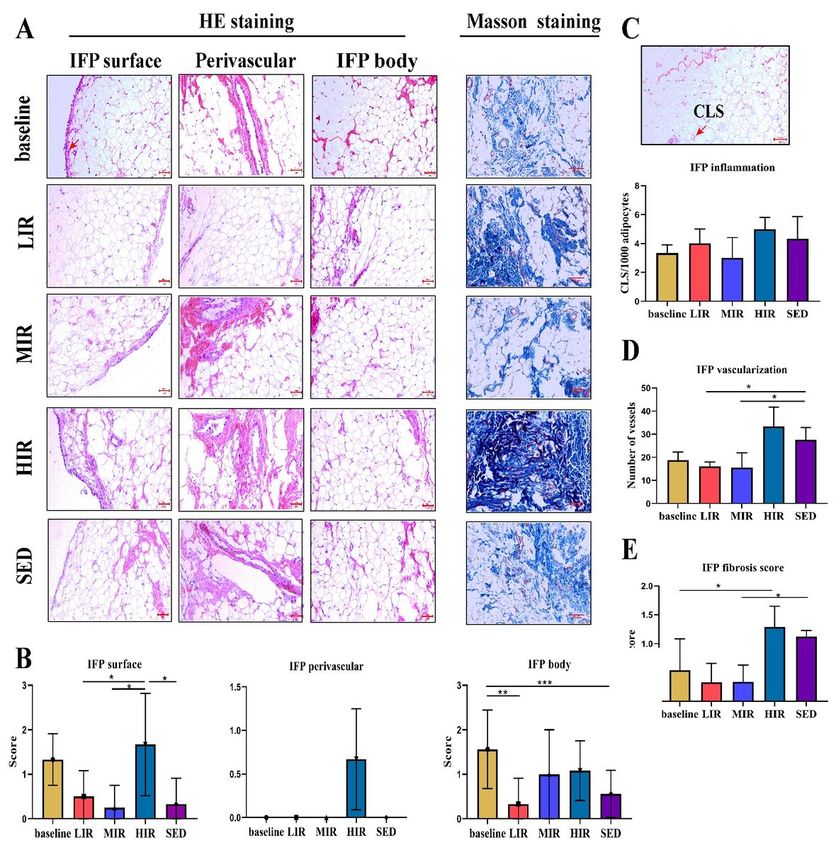
Figure 3 presents images of the IFP body, perivascular region, and IFP surface regions (3A), as well as the results of the
semiquantitative evaluation of cell number (3B). For the cell number between the baseline and the 8th week, a
significant difference was found for the IFP body region in the LIR group (1.56±0.88 vs. 0.33±0.58, P=0.016) and SED
group (1.56±0.88 vs. 0.56±0.53, P=0.006). On the other hand, at the 8th week, no significant differences were found in
cell number among the four groups for the IFP body region or perivascular region. However, for the IFP surface region,
the cell number was significantly higher in the HIR group (1.67±1.15) than in the LIR (1.67±1.15 vs. 0.50±0.58,
P=0.049), MIR (1.67±1.15 vs. 0.25±0.50, P=0.023), and SED (1.67±1.15 vs. 0.33±0.58, P=0.040) groups.
IFP inflammation
Adipose inflammation in the IFP was assessed using the number of CLS/1,000 adipocytes. As shown in Figure 3C, for
each group, no significant difference was found between the numbers at the baseline and the 8th week. Similarly, there
were no significant differences among the four groups in the values at the 8th week.
Vascularization
As shown in Figure 3D, the vascularity of the IFP in the HIR group was statistically significantly higher (33.31±8.43) at
the 8th week than at the baseline (18.83±8.50) (P=0.007), while no significant differences were found in other three
groups between the baseline and 8th week values. For the 8th week values, compared with the score in the SED group
(27.58±5.36), a significant lower score was found in the LIR (16.00±2.00, P=0.034) and MIR (15.50±6.44, P=0.013)
groups.
Fibrosis
IFP fibrosis was scored using Masson staining. As shown in Figure 3E, a significant difference was found only in the
HIR group between the baseline (0.54±0.54) and 8th week (1.29±0.36) values (P=0.019). However, at the 8th week,
compared with that in the SED group (1.12±0.10), a significantly lower score was found in the MIR group (0.34±0.29)
(P=0.021) and LIR group (0.33±0.33) (P=0.020).
Macrophage infiltration
We evaluated the effects of different intensities of running on CD86 and CD206 adipose tissue macrophages, as
determined using immunohistochemical staining. There was no significant difference in any group in the presence of
CD86+ and CD206+ cells between the baseline and 8th week. Similarly, at the 8th week, there were no significant
differences among the four groups in the presence of CD86+ and CD206+ cells (Figure 4).
qRT-PCR analysis
Figure 5 presents the mRNA expression results of genes related to lipid metabolism (ATGL, LPL, PPAR-g, FABP4),
development (SFRP2 and HoxC9), and inflammation (IL-6, MCP-1) in the IFP in the four groups. For each gene, there
was no significant difference in any group between the values at the baseline and 8th week. Similarly, at the 8th week,
there were no significant differences among the four groups in the expression of any of the genes.
Page 5/14Discussion
OA is considered to be a whole-joint disease, and the IFP is hypothesized to contribute to the risk of knee OA because of
its proinflammatory phenotype in OA joints. Although it was reported that exercise affects IFP remodeling and
inflammation [9], it remains unknown how the IFP responds to running at different intensities. Our findings indicate that
running has an intensity-dependent effect on IFP remodeling. Contrary to LIR and MIR, HIR led to an increase in the
cellularity, fibrosis, and vascularity of the IFP. Furthermore, the HIR-induced IFP fibrosis was probably due to mechanical
stress, rather than pathologic proinflammatory M1/M2 polarization.
The IFP is local adipose tissue located below the patella, and it plays an important role in maintaining the health of the
knee joint. Accumulating lines of evidence indicate that it is involved in the development of KOA [4, 16]. Using the same
animal model as in the present study, we previously found that treadmill running at low-to-medium intensity maintains
cartilage homeostasis [2]. In the present study, we found that low-to-medium running led to unchanged or decreased
fibrosis, vascularity, and surface cellularity in the IFP, which likely contributed to maintenance of optimal joint
homeostasis. High-intensity running, however, may cause cartilage degradation [7]. This effect of high-intensity running
may be, at least partially, attributable to the considerable increase in IFP fibrosis and vascularization as was found in
the present study. These pathologic structural changes have been reported in patients with KOA [6].
An intensity-dependent effect of running was also found on the expression of serum adipokine. Low-to-medium
intensity running resulted in considerably lower leptin levels, whereas high-intensity running was associated with an
increase in the visfatin level. It has been reported that leptin and visfatin can exert their proinflammatory and pro-
catabolic actions on cartilage [14, 17]. Leptin has been shown to regulate chondrocyte anabolism by inducing the
mRNA and protein expression of some proinflammatory or pro-catabolic genes in vivo, including MMP-9, ADAMTS-4/5,
NO, PGE2, IL-6, and IL-8 [18]. In parallel, visfatin has been shown to affect chondrocytes by inducing the expression of
MMPs and reduce the synthesis of matrix components [19, 20]. These findings suggest that, contrary to high-intensity
running, low-to-medium intensity running reduces high levels of circulating proinflammatory and pro-catabolic
adipokines, thus benefiting joint health.
As noted earlier, high-intensity running may induce a variety of pathological manifestations in the IFP, among which
fibrosis may be the most typical characteristic. Abundant fibrosis has been observed in patients with end-stage KOA [6],
and increased fibrosis (accompanying increased structural damage) has been observed in mice fed a high-fat diet [5].
Fibrosis is regarded as an ubiquitous tissue response to an unresolved chronic inflammation, and it is also a reparative
process initiated during tissue healing in response to an injury and related to the degree of joint damage [21]. IFP
fibrosis is triggered by inflammation and/or mechanical stress [5, 21, 22]. A possible explanation for the association of
adipose tissue fibrosis with inflammation is that CD86+M1 positive macrophages generate proinflammatory signals to
shift preadipocytes away from an adipogenic lineage and toward a myofibroblast phenotype [5]. However, in this study,
similar inflammatory changes were found in the three running groups, including M1 macrophage polarization, crown-
like structures, and the expression of inflammatory-related genes, implying that pathologic proinflammatory M1/M2
polarization likely does not serve as the direct trigger factor for HIR-induced IFP fibrosis.
Mechanical stress is widely recognized as the single most important environmental factor responsible for joint
homeostasis [23, 24]. Our previous studies demonstrated that running-induced mechanical stimulus may induce an
intensity-dependent effect on bone remodeling and cartilage maintenance [2, 13]. It has been suggested that there is a
biomechanical “window” for maintaining optimal joint homeostasis [24]. The findings from the present study clearly
indicated that mechanical stress plays a vital role in the remodeling of the IFP. Barboza et al. [5] reported additional
evidence, suggesting that obesity-induced IFP fibrosis may occur via physiologic signaling mediators, such as
Page 6/14mechanical stress, rather than pathologic proinflammatory M1 polarization. Further investigations are warranted to
better understand the underlying mechanism behind the responses of the IFP to various mechanical stresses.
There are several potential limitations to this study. First, the lack of information on the expression of pro-inflammatory
or anti-inflammatory cytokines and adipokines in the IFP likely limits the understanding of the intensity-dependent
effect of running on the IFP inflammation phenotype. Moreover, the immunohistochemical assessment only included
M1 and M2 macrophages. Other immune cells such as T cells could also contribute to the inflammation of the IFP. In
the future, flow cytometry should be used to identify various immune cell types to better understand the origin of IFP
inflammation.
In summary, in the present study, the effects of running at different intensities on the IFP were examined. The results
indicate that the effect of running on IFP remodeling is intensity dependent. Contrary to LIR and MIR, HIR increased the
fibrosis and vascularity of the IFP. Additionally, the HIR-induced IFP fibrosis was probably due to mechanical stress,
rather than pathologic proinflammatory M1/M2 polarization
Abbreviations
SED: sedentary; LIR: low-intensity running; MIR: medium-intensity running; HIR: high-intensity running; IFP: infrapatellar
fat pad; KOA: knee osteoarthritis; SAT: subcutaneous adipose tissue; IL-6: interleukin-6; TNF: tumor necrosis factor; HE:
hematoxylin-eosin; CLS: crown-like structures; IHC: immunohistochemistry; ELISA: enzyme-linked immunosorbent
assay; ANOVA: a one-way analysis of variance; SD: standard deviation
Declarations
Acknowledgment
Not applicable.
Author’s contributions
NZ and GXN conceived research concept; NZ and TL designed and performed the experiments, analyzed data, and
prepared figures, XYC, YZP, JTL sample collection and sample storage, and GXN and XYC drafted, revised and edited
the manuscript.
Funding
This work was supported by National Natural Science Foundation of China (81572219, 81871848), and Startup Fund
for scientific research, Fujian Medical University(Grant number:2017XQ2040)
Availability of data and materials
The necessary data were provided to support the assumption of this study (data will be made available on demand).
Ethics approval and consent to participate
This study was approved by Animal Ethics Committee of Fujian Medical University (2017-061).
Consent for publication
Not applicable.
Page 7/14Competing interests
The authors declare that they have no competing interests.
References
[1] Bastiaansen-Jenniskens YM, Clockaerts S, Feijt C, Zuurmond AM, Stojanovic-Susulic V, Bridts C, et al. Infrapatellar
fat pad of patients with end-stage osteoarthritis inhibits catabolic mediators in cartilage. Ann Rheum Dis 2012; 71: 288-
294.
[2] Ni GX, Liu SY, Lei L, Li Z, Zhou YZ, Zhan LQ. Intensity-dependent effect of treadmill running on knee articular
cartilage in a rat model. Biomed Res Int 2013; 2013
[3] Eymard F, Chevalier X. Inflammation of the infrapatellar fat pad. Joint Bone Spine 2016; 83: 389-393.
[4] Ni Zeng Zhi-Peng Yan, Xin-Yuan Chen, Guo-Xin Ni. Infrapatellar Fat Pad and Knee Osteoarthritis. Aging and disease
2020, 11: 1317-1328.
[5] Barboza E, Hudson J, Chang WP, Kovats S, Towner RA, Silasi-Mansat R, et al. Profibrotic Infrapatellar Fat Pad
Remodeling Without M1 Macrophage Polarization Precedes Knee Osteoarthritis in Mice With Diet-Induced Obesity.
Arthritis Rheumatol 2017; 69: 1221-1232.
[6] Favero M, El-Hadi H, Belluzzi E, Granzotto M, Porzionato A, Sarasin G, et al. Infrapatellar fat pad features in
osteoarthritis: a histopathological and molecular study. Rheumatology (Oxford) 2017; 56: 1784-1793.
[7] Gessel T, Harrast MA. Running Dose and Risk of Developing Lower-Extremity Osteoarthritis. Curr Sports Med Rep
2019; 18: 201-209.
[8] Bohnsack M, Hurschler C, Demirtas T, Rühmann O, Stukenborg-Colsman C, Wirth CJ. Infrapatellar fat pad pressure
and volume changes of the anterior compartment during knee motion: possible clinical consequences to the anterior
knee pain syndrome. Knee Surg Sports Traumatol Arthrosc 2005; 13: 135-141.
[9] Barboza E KT, Hudson.J, Kovats S, Griffin TM. Exercise induces transient inflammatory and pro-fibrotic remodeling
the infrapatellar fat pad. Osteoarthritis and Cartilage 2017; 25: S67.
[10] Timmins KA, Leech RD, Batt ME, Edwards KL. Running and Knee Osteoarthritis: A Systematic Review and Meta-
analysis. Am J Sports Med 2017; 45: 1447-1457.
[11] Rios JL, Boldt KR, Mather JW, Seerattan RA, Hart DA, Herzog W. Quantifying the Effects of Different Treadmill
Training Speeds and Durations on the Health of Rat Knee Joints. Sports Med Open 2018; 4: 15.
[12] Appleton CT. Osteoarthritis year in review 2017: biology. Osteoarthritis and cartilage 2018; 26: 296-303.
[13] Li Z, Liu SY, Xu L, Xu SY, Ni GX. Effects of treadmill running with different intensity on rat subchondral bone. Sci
Rep 2017; 7: 1977.
[14] Warmink K, Kozijn AE, Bobeldijk I, Stoop R, Weinans H, Korthagen NM. High-fat feeding primes the mouse knee
joint to develop osteoarthritis and pathologic infrapatellar fat pad changes after surgically induced injury. Osteoarthritis
Cartilage 2020; 28: 593-602.
Page 8/14[15] Inomata K, Tsuji K. Time course analyses of structural changes in the infrapatellar fat pad and synovial membrane
during inflammation-induced persistent pain development in rat knee joint.BMC Musculoskelet Disord 2019; 20: 8.
[16] Ioan-Facsinay A, Kloppenburg M. An emerging player in knee osteoarthritis: the infrapatellar fat pad. Arthritis Res
Ther 2013; 15: 225.
[17] Ouchi N, Parker JL, Lugus JJ, Walsh K. Adipokines in inflammation and metabolic disease. Nat Rev Immunol 2011;
11: 85-97.
[18] Belluzzi E, El Hadi H, Granzotto M, Rossato M, Ramonda R, Macchi V, et al. Systemic and Local Adipose Tissue in
Knee Osteoarthritis. J Cell Physiol 2017; 232: 1971-1978.
[19] Gómez R, Conde J, Scotece M, Gómez-Reino JJ, Lago F, Gualillo O. What's new in our understanding of the role of
adipokines in rheumatic diseases? Nat Rev Rheumatol 2011; 7: 528-536.
[20] Yammani RR, Loeser RF. Extracellular nicotinamide phosphoribosyltransferase (NAMPT/visfatin) inhibits insulin-
like growth factor-1 signaling and proteoglycan synthesis in human articular chondrocytes. Arthritis Res Ther 2012; 14:
R23.
[21] Ioan-Facsinay A, Kloppenburg M. Osteoarthritis: Inflammation and fibrosis in adipose tissue of osteoarthritic joints.
Nat Rev Rheumatol 2017; 13: 325-326.
[22] Mack M. Inflammation and fibrosis. Matrix Biol 2018; 68-69: 106-121.
[23] Alentorn-Geli E, Samuelsson K, Musahl V, Green CL, Bhandari M, Karlsson J. The Association of Recreational and
Competitive Running With Hip and Knee Osteoarthritis: A Systematic Review and Meta-analysis. J Orthop Sports Phys
Ther 2017; 47: 373-390.
[24] Ni GX. Development and Prevention of Running-Related Osteoarthritis. Curr Sports Med Rep 2016; 15: 342-349.
Tables
Table 1 Primer sequences used for quantitative real-time polymerase chain reaction (RT-PCR)
Primer Forward Reverse (5′-3′) Product size (bp)
GAPDH CTGGAGAAACCTGCCAAGTATG GGTGGAAGAATGGGAGTTGCT 138
PPARg GTCTCACAATGCCATCAGGTTT AGGGGGGTGATATGTTTGAACT 285
ATGL GAACCGAAAGACCTGATGACCAC CAGGCAGCCACTCCAACAAA 133
LPL ATCAACAAGGTCAGAGCCAAGA ATGTCCACCTCCGTGTAAATCA 248
Sfrp2 GTTCCTGTGCTCGCTCTTCG CGTTGTCATCCTCGTTCTTAGTTT 272
Hoxc9 CAGCAAGCACAAAGAGGAGAAG GGGCAGGGTTTAGGATTGTTC 292
IL-6 AAGCCAGAGTCATTCAGAGCAA GTCTTGGTCCTTAGCCACTCCT 154
MCP-1 CCAATGAGTCGGCTGGAGAAC GAAGTGCTTGAGGTGGTTGTGG 287
Page 9/14Table 2 The morphometry of adipocytes in IFP
Number of Total area of Area of single Number of Adipocyte diameter
adipocytes adipocytes adipocyte adipocytes per
unit area
Baseline 69.22(5.68) 0.0645(0.0038) 0.00095(0.00027) 1002.00(142.35) 0.0394(0.0032)
8th week LIR 54.67(8.33) 0.0668(0.0030) 0.00129(0.00026) 791.31(170.59) 0.0418(0.0065)
MIR 61.67(2.91) 0.0652(0.0024) 0.00110(0.00007) 892.63(73.02) 0.0389(0.0004)
HIR 59.33(7.46) 0.0665(0.0009) 0.00110(0.00005) 858.86(186.94) 0.0330(0.0012)
SED 49.89(3.27)* 0.0640(0.0026) 0.00131(0.00019) 722.15(82.07)* 0.0402(0.0029)
Values are mean (SD); ∗P < 0.05 compared to baseline;
Figures
Figure 1
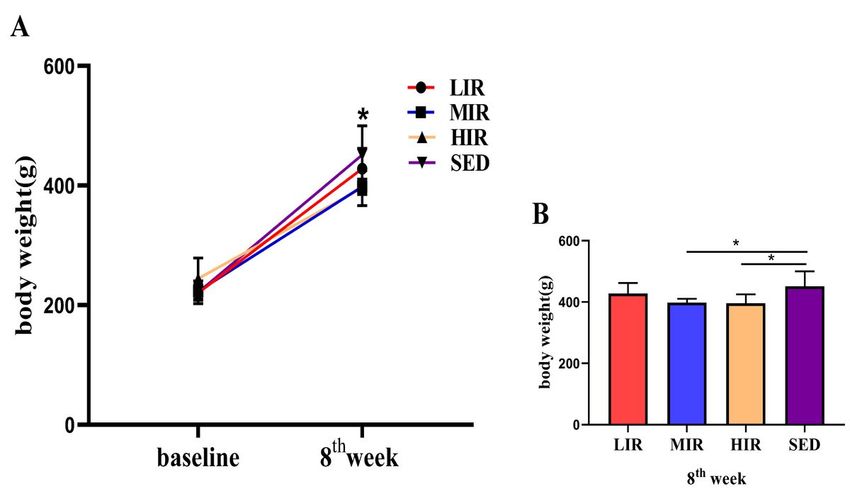
Body weight and serum adipokine expression in the four groups: A) Body weight at the baseline and 8th week in each
study group. * PFigure 2 Histological features of the infrapatellar fat pad in the four groups: A) Representative photographs showing H&E staining of the IFP body, perivascular region, and IFP surface (highlighted by the arrow) regions and Masson staining in the baseline, LIR, MIR, HIR, and SED groups. B) Semiquantitative evaluation of the cell number in the IFP body, perivascular region, and surface. C) Crown-like structure (highlighted by the arrow) count in the IFP, expressed per 1,000 adipocytes. D) Semiquantitative evaluation of IFP vascularization. E) Semiquantitative evaluation of IFP fibrosis. Scale bar represents 50 µm. * P
Figure 3

Macrophages in the IFP in the four groups:A) Representative images of the immunohistochemistry staining. Positive
cells are shown in red and indicated with arrows. B) Statistical analysis. Scale bar represents 50 µm.

                                                       Page 12/14
Figure 4
mRNA expression in the IFP in the four groups: The mRNA expression levels of SFRP2, PPARg, ATGL, HOXC9, LPL, IL-6,
and MCP-1 in the IFP at baseline and at the 8th week in the LIR, MIR, HIR, and SED groups (data are shown as the mean
± SD).
Page 13/14Figure 5
Figure 5 presents the mRNA expression results of genes related to lipid metabolism (ATGL, LPL, PPAR-g, FABP4),
development (SFRP2 and HoxC9), and inflammation (IL-6, MCP-1) in the IFP in the four groups. For each gene, there
was no significant difference in any group between the values at the baseline and 8th week
Page 14/14You can also read