TissueNexus: a database of human tissue functional gene networks built with a large compendium of curated RNA-seq data
←
→
Page content transcription
If your browser does not render page correctly, please read the page content below

D710–D718 Nucleic Acids Research, 2022, Vol. 50, Database issue                                                  Published online 26 November 2021
https://doi.org/10.1093/nar/gkab1133

TissueNexus: a database of human tissue functional
gene networks built with a large compendium of
curated RNA-seq data
Cui-Xiang Lin1,2 , Hong-Dong Li1,2 , Chao Deng1,2 , Yuanfang Guan                                                  3
                                                                                                                       and Jianxin Wang                 1,2,*

1
  School of Computer Science and Engineering, Central South University, Changsha, Hunan 410083, P.R. China,
2
  Hunan Provincial Key Lab on Bioinformatics, Central South University, Changsha, Hunan 410083, P.R. China and
3
  Department of Computational Medicine and Bioinformatics, University of Michigan, Ann Arbor, MI 48109, USA

                                                                                                                                                                  Downloaded from https://academic.oup.com/nar/article/50/D1/D710/6442700 by guest on 20 February 2022
Received August 12, 2021; Revised October 10, 2021; Editorial Decision October 26, 2021; Accepted November 18, 2021

ABSTRACT                                                                          which differs from coexpression or regulatory networks
                                                                                  where there is only one type of edges. For example, the edge
Mapping gene interactions within tissues/cell types                               in a regulatory network represents transcriptional factor-
plays a crucial role in understanding the genetic ba-                             target gene binding. FGNs have been continuously devel-
sis of human physiology and disease. Tissue func-                                 oped and applied successfully to solving fundamental bi-
tional gene networks (FGNs) are essential models for                              ological and biomedical questions, including novel inter-
mapping complex gene interactions. We present Tis-                                action discovery and disease gene prioritization (1,10–13).
sueNexus, a database of 49 human tissue/cell line                                 Early efforts in this field are devoted to constructing global
FGNs constructed by integrating heterogeneous ge-                                 (i.e. not tissue-wise) gene networks (2). Because gene inter-
nomic data. We adopted an advanced machine learn-                                 actions may be remodeled in different tissues, tissue net-
ing approach for data integration because Bayesian                                works are later constructed, examples of which are included
classifiers, which is the main approach used for con-                             in the GIANT (1), diseaseQUEST (5) and BaiHui databases
                                                                                  (8).
structing existing tissue gene networks, cannot cap-
                                                                                     In the broader context of human gene networks including
ture the interaction and nonlinearity of genomic fea-                             coexpression and regulatory networks, RNA-seq data have
tures well. A total of 1,341 RNA-seq datasets con-                                been successfully applied to network modeling. For exam-
taining 52,087 samples were integrated for all of                                 ple, using the expression data generated by the Genotype-
these networks. Because the tissue label for RNA-                                 Tissue Expression (GTEx) consortium, coexpression net-
seq data may be annotated with different names or                                 works for 35 human tissues are constructed, providing a rich
be missing, we performed intensive hand-curation                                  resource for understanding gene regulation and function
to improve quality. We further developed a user-                                  (14). The gene regulatory networks built with the GTEx ex-
friendly database for network search, visualization,                              pression data suggest the tissue specificity of transcriptional
and functional analysis. We illustrate the applica-                               control (15). Further, sample-specific regulatory networks
tion of TissueNexus in prioritizing disease genes.                                are constructed for yeast and lymphoblastoid cell lines (16).
                                                                                  A database of sample-specific regulatory networks for hu-
The database is publicly available at https://www.
                                                                                  man tissues is later developed (17,18). In the area of FGNs,
diseaselinks.com/TissueNexus/.                                                    RNA-seq data have also been used but in a limited number
                                                                                  of studies. One example is the HumanNet database (13), for
INTRODUCTION                                                                      which RNA-seq expression data are used to build the net-
Functional gene networks (FGNs) (1–7) are an essential                            work.
model for mapping the functional interaction landscape                               For FGNs, existing networks have mainly been built with
among genes. In an FGN, the node represents a gene and                            Bayesian Classifiers (BCs) (1,4,5,8), and a few are built
the edge weight indicates the co-functional probability that                      using Bayesian-based likelihood (13). Both methods have
two genes participate in the same biological pathway (9).                         the limitation of not considering the dependence among
The evidence that supports the co-functional relationship                         features, and they cannot capture the nonlinearity in real
of two genes includes diverse interaction data, such as reg-                      data well (19,20). Because the functional interaction be-
ulatory relationship, coexpression, protein-protein interac-                      tween genes is complex and have nonlinear nature, leverag-
tion, etc. (1,6,8). Constructed by integrating heterogeneous                      ing more advanced machine learning models may improve
genomic data, FGNs are a type of composite network,                               the accuracy of networks.

* To   whom correspondence should be addressed. Tel: +86 731 88830212; Fax: +86 731 88830212; Email: jxwang@mail.csu.edu.cn

C The Author(s) 2021. Published by Oxford University Press on behalf of Nucleic Acids Research.
This is an Open Access article distributed under the terms of the Creative Commons Attribution-NonCommercial License
(http://creativecommons.org/licenses/by-nc/4.0/), which permits non-commercial re-use, distribution, and reproduction in any medium, provided the original work
is properly cited. For commercial re-use, please contact journals.permissions@oup.com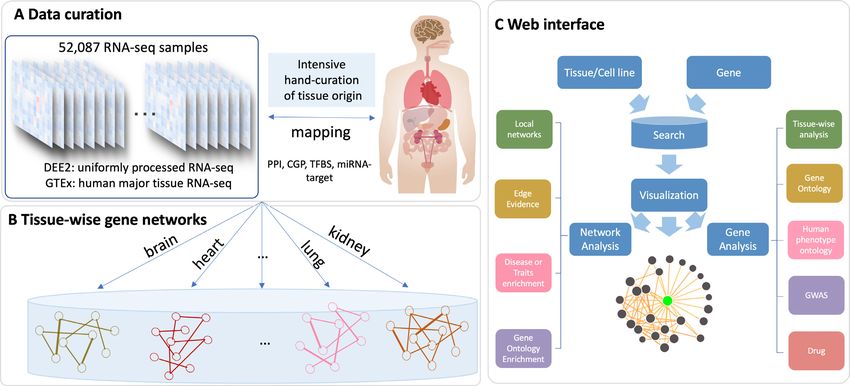
Nucleic Acids Research, 2022, Vol. 50, Database issue D711

   In this work, we improve the construction of human             model per million mapped reads (FPKM) values. Because
tissue FGNs as follows. First, rather than using BCs, we          the tissue labels of the expression data may be annotated
adopt XGBoost, which is a state-of-the-art machine learn-         with different names or be missing, we manually read the
ing method and can capture nonlinearity in data (21–23), to       descriptions of individual samples and performed intensive
predict functional interactions between genes. Another rea-       hand-curation of the tissue label of the input expression
son for choosing XGBoost is that it can be scaled to large        data. Thus, we assigned a tissue or cell line label to each
datasets; this is important in practice because the number of     sample. Because the Pearson correlation coefficients (PCCs)
training samples (gene pairs) is on the order of millions. In     of pairs of genes in each dataset need to be calculated as
addition, because tissue labels of public genomic data may        features and PCCs could be spurious if the number of sam-
be annotated with different names or be missing, we per-          ples is small, we retained only the datasets containing at
formed intensive hand-curation of the tissue labels of the        least 10 samples following the practice applied in the pre-
input expression data. Thus, we obtained a set of RNA-seq         vious work (26). In each dataset, lowly expressed genes (i.e.
expression datasets for each tissue.                              those with FPKM values < 0.1 in more than 90% samples

                                                                                                                                   Downloaded from https://academic.oup.com/nar/article/50/D1/D710/6442700 by guest on 20 February 2022
   With the proposed approach, we constructed Tis-                as used in (26)) were removed. This preprocessing procedure
sueNexus, a compendium of 49 tissue/cell line FGNs. What          was applied to the data of each tissue. Finally, we obtained
distinguishes our networks from existing FGNs is summa-           RNA-seq gene expression data for 49 tissues. The numbers
rized in Table 1. The major features of TissueNexus in-           of the RNA-seq datasets and samples for each tissue are
clude the following. (i) The tissue labels of the input gene      shown in Table 2. The details of these datasets are available
expression data are intensively hand-curated. The curation        at https://diseaselinks.com/TissueNexus/data.php.
of a large number of RNA-seq datasets is extremely labor-
intensive and has not previously been available. (ii) The
                                                                  Construction and analysis of TissueNexus networks
networks are constructed by integrating by far the largest
number of RNA-seq datasets (n = 1,341) and samples                Feature calculation. Genomic features are calculated as in-
(n = 52,087). (iii) The networks are constructed using an         put for machine learning approaches to build gene net-
advanced machine learning approach, namely, XGBoost,              works. Because we predict pairwise gene-gene relationships,
which can result in more accurate networks as will be shown       pairwise features must be used. For each RNA-seq dataset,
in the Construction and analysis of TissueNexus networks          the PCC of gene pairs was calculated and used as a feature.
section.                                                          Therefore, the number of expression-based features is equal
   We deployed a web server for users to query genes and          to that of RNA-seq datasets for each tissue. Taking the liver
visualize functional interactions between the queried gene        tissue with 35 RNA-seq datasets as an example, the num-
and its neighbors for each individual tissue. To gain func-       ber of RNA-seq expression features is 35 (Table 2). In addi-
tional insight into the network, we implemented functional        tion to expression-based features, we also integrate six pair-
analysis tools for the network including Gene Ontology en-        wise genomic features, which are obtained from the GIANT
richment and disease enrichment. We also provide func-            website (1), including shared 3 UTR microRNA binding
tional annotations of the queried gene such as annotations        motifs, the cooccurrence of transcription factor binding
of associated diseases/traits and drugs. We illustrate the ap-    sites, chemical and genetic perturbations, and three protein-
plication of TissueNexus to prioritizing risk genes of com-       protein interaction (PPI) features from MINT (27), IntAct
plex diseases and demonstrate its better performance over         (28) and BioGRID (29), respectively. For each tissue, gene
existing networks.                                                expression is the dominant feature type used to construct
                                                                  the network (Table 1).
MATERIALS AND METHODS
                                                                  Network construction and performance. For each tissue,
An overview of TissueNexus is presented in Figure 1. The          the tissue-wise RNA-seq features and the six general inter-
methods employed to construct the networks and the in-            action features are integrated to build the FGN using XG-
structions for using the web server are described below.          Boost (Figure 1A; see details in Supplementary Note 1).
                                                                  The evidence supporting the functional relationship of gene
                                                                  pairs comes from both RNA-seq and the general features.
Curation and processing of RNA-seq data for each tissue/cell
                                                                  Only the expressed genes in each tissue are used to build the
line
                                                                  network. In the network, the node represents a gene and
The Digital Expression Explorer 2 (DEE2) (24) is a                the edge weight represents the probability (in the range of
database of RNA-seq gene expression data generated by             [0, 1]) that two genes take participate in the same biological
applying a unified pipeline to the raw RNA-seq reads in           process or pathway.
the short read archive (SRA) database (25). In DEE2,                 We evaluate the performance of each functional gene net-
the RNA-seq data are organized into datasets, with each           work based on 5-fold cross-validation. To avoid overesti-
dataset containing gene expression measurements of mul-           mation of performance, the cross-validation is conducted
tiple different samples. The human RNA-seq data along             based on gene holdout rather than edge holdout; that is,
with the description of sample information including tis-         genes are split into 5-fold to make sure that any gene used
sue origins were downloaded. We also downloaded gene              for training models during cross-validation will not occur in
expression data of different tissues from the GTEx por-           the holdout set. The FGNs based on XGBoost are accurate,
tal (version:v8, https://gtexportal.org/home/datasets). Gene      with AUROC = 0.9249 ± 0.0119 and AUPRC = 0.4817
expression is measured in fragments per kilobase of exon          ± 0.0355 across all tissues; the AUROC and AUPRC for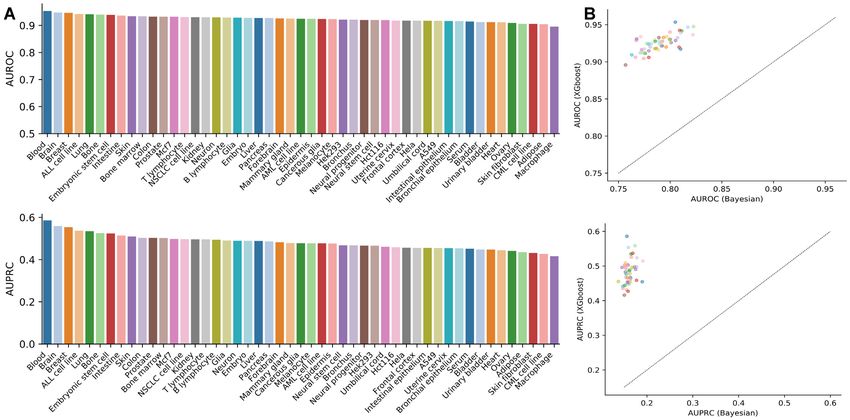
D712 Nucleic Acids Research, 2022, Vol. 50, Database issue

Table 1. Comparison of TissueNexus with existing functional gene network databases
                                            Gene expression               Tissue gene        #Datasetsa
Databases             Tissues               technology                    expression       (all/expression)      #Samples       Methods        References
mouseNet              Not tissue-wise       Microarray                        No               340/333            13,634        Bayesian           (2)
                                                                                                                                classifier
diseaseQUEST          Multiple tissues      Microarray                        No               174/169             2,736        Bayesian           (5)
                                                                                                                                classifier
GIANT                 Multiple tissues      Microarray                        No               987/980            38,000        Bayesian           (1)
                                                                                                                                classifier
HumanNet              Not tissue-wise       Microarray                        No               NAb /158           16,220        Bayesian           (6)
                                            (125 datasets)
                                            RNA-seq (33 datasets)                                                               likelihood
BaiHui                Brain only            Microarray                        Yes              216/213             4,688         Bayesian          (8)
                                                                                                                                 classifier

                                                                                                                                                              Downloaded from https://academic.oup.com/nar/article/50/D1/D710/6442700 by guest on 20 February 2022
TissueNexus           Multiple tissues      RNA-seq                           Yes            1,345/1,341          52,087        XGBoost        This work
a In the Datasets column, all and expression indicate the numbers of all genomic datasets and only the gene expression datasets used to build functional
networks in each database, respectively. Expression is the dominant data type used to construct networks.
b The number of all integrated datasets is not provided in the original paper.

Figure 1. Overview of the TissueNexus database. (A) Hand-curation of tissue labels for human RNA-seq samples of the DEE2 database. The gene expres-
sion data in the GTEx portal are also included. A total of 1,341 RNA-seq datasets containing 52,087 samples were obtained for 49 tissues or cell lines. (B)
Construction of functional gene networks for each tissue or cell line. The networks are stored in the MySql database. (C) Network search, visualization and
analysis. After querying a gene, its local network containing top-connected neighbors is obtained and visualized. The web server also provides a series of
analyses for the network and the queried gene, including analyses of Gene Ontology enrichment, disease enrichment, evidence supporting the functional
relationship of gene pairs, expression level across tissues, annotation of associated diseases/traits, and annotation of associated drugs.

each network is shown in Figure 2 A. A comparison based                         same gene vary across tissues and the edge weight of the
on exactly the same data shows that XGBoost outperforms                         same pair of genes also change from tissue to tissue; most
Bayesian classifiers which have AUROC = 0.7893 ± 0.0159                         interactions are shared between tissues and some belong to
and AUPRC = 0.1612 ± 0.0103 (Figure 2B). Further, we                            one of the tissues compared (Supplementary Figure S2);
investigated whether the networks achieved high precision                       this result suggests the importance of tissue context when
at low recall values. We considered three low recall values =                   analyzing functional interactions between genes.
0.05, 0.1 and 0.2. The precisions for each tissue network at                          We investigate the influence of feature datasets on tis-
these three low values are shown in Supplementary Figure                        sue functional gene networks. We observe that restricting
S1. At recall = 0.05, these networks show appreciably high                      RNA-seq data to the tissue of interest improves network
precision values ranging from 0.8625 to 0.9253 across all tis-                  performance compared to integrating RNA-seq data also
sues, with a mean = 0.890 and standard deviation = 0.014.                       from other tissues (Supplementary Figure S3). We test the
When the recall increases to 0.1 and 0.2, respectively, the                     performance of the network built with only RNA-seq fea-
precision decreases correspondingly (Supplementary Fig-                         tures. The AUROC and AUPRC values across all tissues are
ure S1). We find that the number of interacting genes of the                    0.7901 ± 0.0237 and 0.1857 ± 0.0295, respectively, which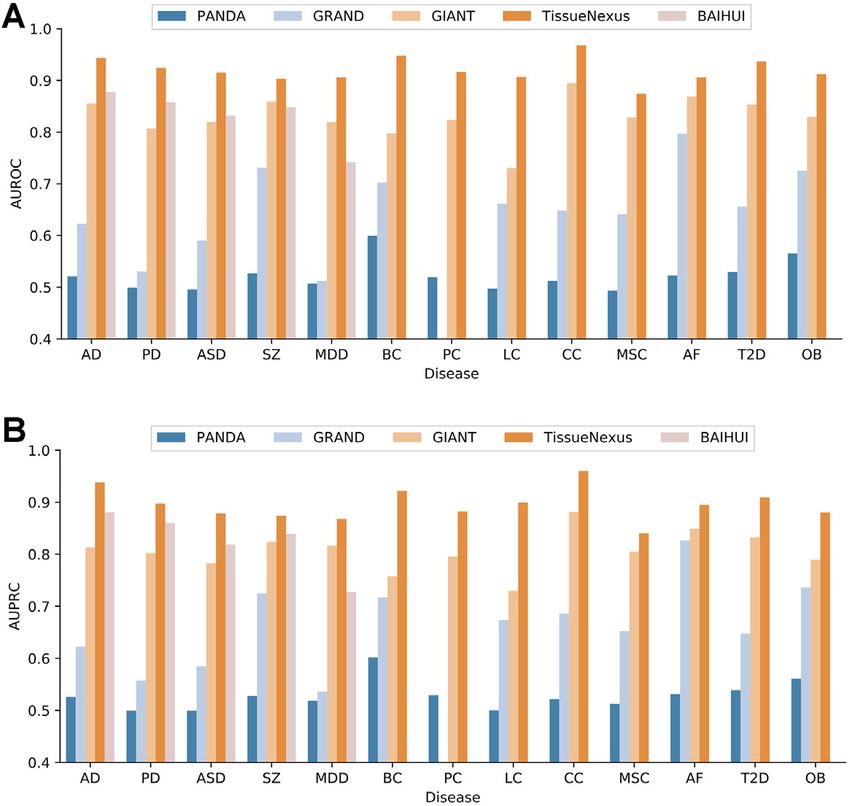
Nucleic Acids Research, 2022, Vol. 50, Database issue D713

Table 2. The numbers of human RNA-seq datasets and samples integrated       We compare the coverage of the networks with existing
for each tissue or cell line                                             human RNA-seq based gene networks, including coexpres-
                                  Proportion              Proportion     sion networks in GTEx-TSN (14), regulatory networks in
                                      of                      of         GTEx-PANDA (15), and sample-specific regulatory net-
#Tissues              #Datasets   datasets%    #Samples   samples%       works in GRAND (17,18). We observe that GTEx-PANDA
A549                     13          1.0         264          0.5        has higher coverage than GTEx-TSN. For some tissues, the
Acute                    46          3.4         1250         2.4        coverages of TissueNexus networks are higher than that
lymphoblastic                                                            in GTEx-PANDA; for the other tissues, GTEx-PANDA
leukemia                                                                 networks have higher coverages (Supplementary Table S1).
Acute myeloid            20          1.5         1435         2.8
leukemia
                                                                         The coverages of GRAND networks vary across individual
Adipose                 12           0.9         1856         3.6        samples and the mean coverage of each tissue network is
B lymphocyte            33           2.5         768          1.5        roughly on the same order of magnitude of GTEx-PANDA
Bladder                 12           0.9         254          0.5        or TissueNexus networks.

                                                                                                                                          Downloaded from https://academic.oup.com/nar/article/50/D1/D710/6442700 by guest on 20 February 2022
Blood                   112          8.4         7619        14.6
Bone                    41           3.1         1383         2.7
Bone marrow             31           2.3         1210         2.3        Implementation
Brain                   48           3.6         4459         8.6
Breast                  71           5.3         2477         4.8
                                                                         TissueNexus has been implemented with a mixture of pro-
Bronchial               14           1.0         373          0.7        gramming languages on the Apache HTTP server (v2.4.41).
epithelium                                                               The HTTPS protocol is deployed on TissueNexus to sup-
Bronchus                 16          1.2         501          1.0        port secure communication over computer networks. The
Chronic myeloid          11          0.8         765          1.5        main web interface is implemented using PhP (v7.4.3) and
leukemia
Colon                    57          4.3         1988         3.8        HTML5. As the full database contains tens of millions of
Embryo                   28          2.1         610          1.2        records (gene pairs), the network data of each tissue or cell
Embryonic stem           30          2.2         743          1.4        line are stored in the open-source MySql (v8.0.25) database
cell                                                                     to make the database robust and scalable. The network of
Epidermis                27          2.0         909          1.7
Forebrain                15          1.1         540          1.0
                                                                         the queried gene is stored in json format, which enables ef-
Frontal cortex           14          1.0         630          1.2        ficient communication between the server and client when
Glia                     18          1.3         568          1.1        coupled with Ajax. The d3 JavaScript package is used to
Glioma                   13          1.0         406          0.8        visualize the network of each query gene. A sliding bar is
Hct116                   20          1.5         375          0.7        designed to dynamically visualize subnetworks containing
Heart                    13          1.0         1621         3.1
Hek293                   28          2.1         580          1.1        only the edge with weights higher than the threshold set by
Hela                     23          1.7         430          0.8        the sliding bar. The queried network in json format is stored
Intestinal               16          1.2         288          0.6        as HTTP cookies, thus enabling highly efficient threshold-
epithelium                                                               ing of the network. In addition, considering the widespread
Intestine                15          1.1         326          0.6
Kidney                   30          2.2         605          1.2
                                                                         application of mobile devices, the web server is also de-
Liver                    35          2.6         1304         2.5        signed to be mobile-friendly.
Lung                     49          3.7         1902         3.7
Macrophage               17          1.3         446          0.9        DATABASE OVERVIEW
Mammary gland            12          0.9         315          0.6
Mcf7                     35          2.6         722          1.4        Database content
Melanocyte               29          2.2         962          1.8
Neural progenitor        13          1.0         302          0.6        TissueNexus is a database of FGNs for 49 human tissues
Neural stem cell         17          1.3         560          1.1        or cell lines, which are constructed by integrating hand-
Neuron                   29          2.2         683          1.3        curated tissue functional genomic data. The web server pro-
Non-small cell lung      31          2.3         1097         2.1
cancer
                                                                         vides functions to query functional interactions between
Ovary                    15          1.1         477          0.9        genes for each individual tissue, visualize the network, view-
Pancreas                 22          1.6         873          1.7        ing the evidence of each interaction, investigate biological
Prostate                 36          2.7         915          1.8        functions, and download the network. The web interface
Serum                    10          0.7         179          0.3        mainly consists of three modules: (i) tissue and gene input,
Skin                     55          4.1         3349         6.4
Skin fibroblast          19          1.4          371         0.7        (ii) network visualization and (iii) network and gene analy-
T lymphocyte             36          2.7         1241         2.4        sis, which are summarized in Figure 1 and detailed below.
Umbilical cord           15          1.1         366          0.7
Uterine cervix           26          1.9         496          1.0        Tissue and gene input
Urinary bladder          13          1.0         294          0.6
                                                                         On the Home page, users can select one of the 49 tissues/cell
                                                                         lines from the pull-down menu. To input gene symbols,
                                                                         the autocomplete function is implemented so that candi-
                                                                         date gene symbols will pop up when one or more characters
are lower than that based on all features (Supplementary                 are typed in by users. In addition, we also implemented the
Figure S4). We also observe that, for each tissue, the net-              function to query multiple genes at a time. Users can in-
work performance is correlated with the number of RNA-                   put multiple genes separated by a comma. Then, when the
seq datasets of the tissue of interest (Supplementary Fig-               Search button is clicked, users will be guided to the result
ure S5).                                                                 page for the queried gene and network.
D714 Nucleic Acids Research, 2022, Vol. 50, Database issue
Downloaded from https://academic.oup.com/nar/article/50/D1/D710/6442700 by guest on 20 February 2022
Figure 2. Performance of tissue functional gene networks. (A) Network performance of each network based on 5-fold cross-validation. The cross-validation
is conducted based on gene holdout rather than edge holdout; that is, genes are split into 5-folds to make sure that any gene used for training models during
cross-validation will not occur in the holdout set. (B) Comparison of XGBoost with Bayesian classifiers in constructing tissue functional gene networks.
Network visualization en/latest/functional-networks.html#evidence. The evidence
of the edge on each dataset is provided on the web
On the result page, the local network containing the queried
server.
gene and its top-connected neighbors will be shown. For the
sake of visualizability, only the top 25 connected genes as
well as the between-neighbor connections are shown. Users Gene analysis. This panel provides five types of annota-
can use the sliding bar to determine the threshold of the tions for the queried gene, including expression levels across
edge weight and only connections with weights higher than tissues, annotation in the GO database (http://ftp.ncbi.nlm.
the threshold will be displayed. nih.gov/gene/DATA/gene2go.gz, 2021-5-21), annotation of
human phenotype ontology (Jun 2021 release), annotation
of disease/traits based on the GWAS Catalog database
Network and gene analysis (2020-11-20), and annotation of drugs based on DGIdb
Functional analysis and annotation are implemented for (2021-May).
the network and the queried gene (Figure 1C), as detailed
below. An example search
Network analysis. First, the weight of the top neighbors An example of the usage of our database is provided by
connected to the queried gene is presented. Second, to searching the brain network for APOE, a gene related
help users to gain functional insight into the network, to multiple diseases/traits, such as blood lipid levels and
Gene Ontology enrichment analysis (GOEA) is performed Alzheimer’s disease (AD) (31–33). An overview of this ex-
using GOTermFinder (30). The enrichment analysis is ample search is presented in Figure 3.
based on the most recent versions of the Gene Ontology First, we select the brain tissue, and we type in APOE
database (2021-09-01 version, http://current.geneontology. on the Home page (Figure 3A).
org/ontology/go-basic.obo) and functional gene annota- Second, on the result page, the local network of APOE
tions (2021-09-01 version, http://geneontology.org/gene- containing the top-connected genes is visualized. The edge
associations/goa human.gaf.gz). Third, a disease enrich- color indicates the weight between two genes. Users can use
ment approach established in our previous work (8) is the sliding bar below the network to adjust the threshold of
applied to test whether a disease or trait is overrepre- edge weight (Figure 3B).
sented in the network. To help users understand whether Third, we can investigate the network via the functional
a given edge is supported by RNA-seq based features or analysis implemented on the server. These analyses consist
other general features or both, we estimated the contri- of two parts: network analysis and gene analysis (Figure 3C).
bution of each dataset to the functional relationship of The network analysis panel includes submenus. The weight
gene pairs using a Bayesian approach, of which the de- between APOE and each neighbor is shown under the local
tails are described on https://humanbase.readthedocs.io/ network menu. For example, MAPT is functionally relatedNucleic Acids Research, 2022, Vol. 50, Database issue D715
Downloaded from https://academic.oup.com/nar/article/50/D1/D710/6442700 by guest on 20 February 2022
Figure 3. Overview of an example search. The brain network is searched for APOE. (A) Selecting brain tissue and inputting the APOE gene. (B) Visualiza-
tion of the local network of APOE containing the top-connected genes. (C) Functional analysis of the local network, including Gene Ontology and disease
enrichment. (D) Annotation to APOE, including expression level across tissues and annotation of GO terms, phenotypes, diseases/traits, and drugs.
to APOE with weight = 0.9155; these two genes are known is observed that the network is associated with dementia
to interact with each other, supporting the high weight be- (FDR = 5.52×10⁻⁶ ) and neurofibrillary degeneration (FDR
tween them. The network is enriched in biological processes = 1.63 × 10⁻³ ).
such as the amyloid fibril formation (GO:1990000, false dis- The gene analysis panel provides expression profiles
covery rate (FDR) = 1.8 × 10⁻⁶ ), negative regulation of across tissues and functional annotation for the queried
endothelial cell proliferation (GO:0001937, FDR = 7.5 × gene based on publicly available databases. As shown in Fig-
10-4 ). Some of these processes, e.g. amyloid fibril forma- ure 3D, APOE is most highly expressed in the liver and is
tion, are associated with AD, suggesting that the network associated with multiple disease/traits such as LDL choles-
is biologically meaningful because APOE is a known ge- terol levels. The associated drugs, such as lutein and ganci-
netic risk factor of AD. Based on disease enrichment, it clovir, are also provided.D716 Nucleic Acids Research, 2022, Vol. 50, Database issue
Application to prioritizing disease risk genes
Gene networks can be applied to many subsequent analysis,
such as gene function prediction, novel interaction discov-
ery, and disease gene prediction, etc. The focus of this work
is not the application of networks but presenting a resource
of tissue FGNs for the community. Here we illustrate the
application of FGNs in prioritizing disease risk genes. We
test the performance of our networks in predicting disease
risk genes using the approach established in previous work
(1,4). Briefly, this method first extracts network weights as
features to characterize each gene, and then adopts machine
learning methods to build a model to distinguish disease-
Downloaded from https://academic.oup.com/nar/article/50/D1/D710/6442700 by guest on 20 February 2022
associated genes (positives) from non-disease genes (nega-
tives) (see the method details in Supplementary Note 2). We
obtain disease genes from GWAS and Online Mendelian In-
heritance in Man (OMIM). For GWAS, following the previ-
ous study (1), the genes achieving genome-wide significance
(P < 5.0 ×10⁻⁸ ) in the GWAS Catalog database (down-
loaded on 2020-11-20) are treated as positives. Negatives are
randomly sampled after excluding positives. The tree-based
method ExtraTree is used to build the model.
We consider a number of diseases representing a wide Figure 4. Comparison of TissueNexus to existing tissue gene networks
spectrum of pathological mechanisms, including cancers based on their performance in predicting risk genes for different types of
(breast cancer (BC), prostate cancer (PC), colorectal diseases. (A) AUROC. (B) AUPRC. (Notes: The BaiHui database contains
cancer (CC), lung cancer (LC), melanoma skin cancer only a brain gene network and is therefore compared on only brain dis-
orders; For the GRAND database, Because it contains multiple sample-
(MSC)), neurological degeneration disease (Alzheimer’s specific networks for each tissue, we calculate the mean and standard de-
disease (AD), Parkinson disease (AD)), psychiatric disor- viation of AUROC and AUPRC. The mean of AUROC and AUPRC is
ders (autism spectrum disorder (ASD), major depression presented, with the standard deviation provided in Supplementary Table
disorder (MDD), and schizophrenia (SZ)), heart disease S2; GRAND does not contain networks for prostate so that prostate can-
(atrial fibrillation (AF)), and metabolic disorders (type 2 cer gene prediction is not performed on GRAND). Disease abbreviations:
AD (Alzheimer’s disease), PD (Parkinson’s disease), ASD (autism spec-
diabetes (T2D) and obesity (OB)). The genes for these trum disorder), SZ (schizophrenia), MDD (major depression disorder),
diseases are deposited to the Zenodo repository (https:// BC (breast cancer), PC (prostate cancer), LC (lung cancer), CC: (colon
zenodo.org/record/5553579). Based on the above-described cancer), MSC (melanoma skin cancer), AF (atrial fibrillation), T2D (type
method, we evaluate the performance of these networks in 2 diabetes), OB (obesity).
predicting disease risk genes using 5-fold cross-validation.
During each fold, the features corresponding to the left out
genes are also removed to avoid overestimation of the per-
formance. The AUROC and AUPRC are used as the per- of the diseases (Supplementary Figure S6). Furthermore,
formance metrics. For each disease, a relevant tissue net- we also compare our networks with general integrated net-
work is selected to construct the feature matrix. For exam- works including PCNet (7), STRING (35) and HumanNet
ple, because Parkinson’s disease is pathologically rooted in (6). We find that TissueNexus networks achieve overall bet-
the brain, the brain network is selected. As shown in Figure ter performance (Supplementary Figure S7).
4, the networks accurately predict disease risk genes accord- We investigate whether disease gene prediction could
ing to AUROC and AUPRC. be improved by using relevant tissue networks. We ana-
We compare our networks with the tissue FGNs in the lyze T2D and AD as case studies. The pancreas and brain
GIANT and BaiHui databases, the regulatory networks networks are used as the disease-relevant tissue networks
in the GTEx-PANDA and GRAND databases (disease- for T2D and AD, respectively. For T2D, we compare the
QUEST and mouseNet are not compared because they are pancreas network to all other tissue networks. We find that
not human networks. GTEx-TSN networks are not com- the pancreas network ranks in the first place among all 49
pared, because their low coverage results in a highly sparse networks (Supplementary Figure S8A), suggesting that the
feature matrix; the high sparsity matrix further makes the prediction model based on relevant tissues is more accurate
network not able to predict the disease gene well and makes than using other tissue networks. For AD, we compared the
it unfair to compare with other networks with high cover- brain network to all other tissue networks. The brain net-
age. The BaiHui database contains only a brain gene net- work ranks in the fourth place (the top 8%) among all 49
work and is therefore compared only on brain disorders). networks (Supplementary Figure S8B). Although the brain
We find that TissueNexus perform better than GIANT, Bai- network does not rank in the first place, the percentile of
Hui, GTEx-PANDA and GRAND (Figure 4). In addition, the rank (8%) is appreciable, especially considering the com-
we compare these networks using independent test genes plexity of AD, the cross talk among tissues, and the noise
from the DisGeNet database (34). Briefly, for these dis- in genomic data. This analysis suggests that the network of
eases, we obtain additional risk genes from DisGeNet. We relevant tissues is more informative in predicting risk genes
find that TissueNexus achieves better performance for most than other tissue networks.Nucleic Acids Research, 2022, Vol. 50, Database issue D717
In summary, these results suggest that our networks of gene functions. Such network mining approaches will be
could be valuable for prioritizing disease risk genes. implemented in our subsequent work to better exploit the
networks.
In summary, we present TissueNexus as a rich resource
DISCUSSION AND FUTURE DIRECTIONS
of 49 tissue-/cell line functional gene networks. We illus-
FGNs represent essential models for mapping the func- trate its application in prioritizing disease risk genes. It is
tional interaction landscape among genes. To help under- expected that these networks will contribute to the under-
stand the functional interaction in different tissues, we built standing of gene functions and complex diseases, and will
a compendium of FGNs for 49 human tissue-/cell lines. become a valuable resource in the field.
Our comparison shows that the interaction partners of the
same gene across different tissues are different and that the
weight of the same pair of genes also varies across tissues. DATA AVAILABILITY
This finding indicates the remodeling of functional gene The web interface of the database is available at https://
Downloaded from https://academic.oup.com/nar/article/50/D1/D710/6442700 by guest on 20 February 2022
network in human tissues. The differences among these net- www.diseaselinks.com/TissueNexus/. This website is freely
works could be further explored to understand the molecu- accessible to all users, without the need for logging on or a
lar basis of tissues or cell types. In a broader context, tissues password.
gene networks have been constructed in other studies, such
as the tissue coexpression networks (14), tissue-specific reg-
ulatory networks (15), and sample-specific regulatory net- SUPPLEMENTARY DATA
works (16). FGNs are different from coexpression or reg-
ulatory networks, because the edge in an FGN represents Supplementary Data are available at NAR Online.
the co-functional probability that two genes participate in
the same biological pathway (9). In contrast, the edge in FUNDING
coexpression networks represents the correlation between
gene expression profiles and the edge in a regulatory net- National Natural Science Foundation of China [U1909208,
work means transcriptional factor-target gene binding. 61972423, 61732009]; 111 Project [B18059]; Hunan Provin-
Motivated by the study of sample-specific regulatory net- cial Science and Technology Program [2018WK4001].
works (16–18), a natural and meaningful extension of our Funding for open access charge: National Natural Science
work is to build FGNs for individual samples. To this end, Foundation of China [U1909208].
the merits of the method used in building sample-specific Conflict of interest statement. None declared.
regulatory networks could be leveraged and novel meth-
ods that take into account the specific nature of functional
gene networks need to be established. Further, a challenge REFERENCES
we would face is how to evaluate the accuracy of sample- 1. Greene,C.S., Krishnan,A., Wong,A.K., Ricciotti,E., Zelaya,R.A.,
specific networks, due partly to the difference for networks Himmelstein,D.S., Zhang,R., Hartmann,B.M., Zaslavsky,E.,
from individuals to individuals and the dynamic nature of Sealfon,S.C. et al. (2015) Understanding multicellular function and
disease with human tissue-specific networks. Nat. Genet., 47, 569.
the networks. 2. Guan,Y., Myers,C.L., Lu,R., Lemischka,I.R., Bult,C.J. and
Regarding the application of tissue FGNs to disease gene Troyanskaya,O.G. (2008) A genomewide functional network for the
prediction, we have shown that FGNs are promising for pre- laboratory mouse. PLoS Comput. Biol., 4, e1000165.
dicting risk genes. However, because the human body is a 3. Guan,Y., Ackert-Bicknell,C.L., Kell,B., Troyanskaya,O.G. and
Hibbs,M.A., (2010) Functional genomics complements quantitative
system and interactions exist between tissues, it is possible genetics in identifying disease-gene associations. PLoS Comput. Biol.,
that including multiple tissues that are related to the dis- 6, e1000991.
ease could further improve risk gene prediction. We plan to 4. Guan,Y., Gorenshteyn,D., Burmeister,M., Wong,A.K.,
study this question in the future. In addition, it needs to be Schimenti,J.C., Handel,M.A., Bult,C.J., Hibbs,M.A. and
noted that tissue gene networks-based prediction of disease Troyanskaya,O.G. (2012) Tissue-specific functional networks for
prioritizing phenotype and disease genes. PLoS Comput. Biol., 8,
genes could be affected by multiple factors, including the e1002694.
above-mentioned between-tissue interactions, the noise in 5. Yao,V., Kaletsky,R., Keyes,W., Mor,D.E., Wong,A.K., Sohrabi,S.,
genomic data, and the false positives of disease genes. De- Murphy,C.T. and Troyanskaya,O.G. (2018) An integrative
signing novel approaches to address these issues could po- tissue-network approach to identify and test human disease genes.
Nat. Biotechnol., 36, 1091–1099.
tentially improve disease gene prediction and benefit subse- 6. Hwang,S., Kim,C.Y., Yang,S., Kim,E., Hart,T., Marcotte,E.M. and
quent applications such as drug development. Lee,I. (2019) HumanNet v2: human gene networks for disease
Our database could be improved in several ways in the research. Nucleic Acids Res., 47, D573–D580.
future. First, except for some cell line networks, most net- 7. Huang,J.K., Carlin,D.E., Yu,M.K., Zhang,W., Kreisberg,J.F.,
works in this database are built for major organs or tis- Tamayo,P. and Ideker,T. (2018) Systematic evaluation of molecular
networks for discovery of disease genes. Cell Systems, 6, 484–495.
sues. As human tissues are composed of heterogeneous cell 8. Li,H.-D., Bai,T., Sandford,E., Burmeister,M. and Guan,Y. (2019)
types that carry out different functions, we plan to extend BaiHui: cross-species brain-specific network built with hundreds of
this work to build cell type networks by integrating sin- hand-curated datasets. Bioinformatics, 35, 2486–2488.
gle cell RNA-seq data (36–38). Second, while this work 9. Troyanskaya,O.G., Dolinski,K., Owen,A.B., Altman,R.B. and
Botstein,D. (2003) A Bayesian framework for combining
focuses on presenting the networks as a rich resource for heterogeneous data sources for gene function prediction (in
the community, mining these networks using advanced ma- Saccharomyces cerevisiae). Proc. Natl. Acad. Sci. U.S.A., 100,
chine learning approaches may deepen our understanding 8348–8353.D718 Nucleic Acids Research, 2022, Vol. 50, Database issue
10. Recla,J.M., Robledo,R.F., Gatti,D.M., Bult,C.J., Churchill,G.A. and highest-connected splice isoforms: from the chromosome 17 human
Chesler,E.J. (2014) Precise genetic mapping and integrative proteome project. J. Proteome. Res., 14, 3484–3491.
bioinformatics in diversity outbred mice reveals hydin as a novel pain 27. Ceol,A., Chatr Aryamontri,A., Licata,L., Peluso,D., Briganti,L.,
gene. Mamm. Genome, 25, 211–222. Perfetto,L., Castagnoli,L. and Cesareni,G. (2010) MINT, the
11. Hu,J., Wan,J., Hackler,L. Jr, Zack,D.J. and Qian,J. (2010) molecular interaction database: 2009 update. Nucleic Acids Res., 38,
Computational analysis of tissue-specific gene networks: application D532–D539.
to murine retinal functional studies. Bioinformatics, 26, 2289–2297. 28. Orchard,S., Ammari,M., Aranda,B., Breuza,L., Briganti,L.,
12. Ata,S.K., Wu,M., Fang,Y., Ou-Yang,L., Kwoh,C.K. and Li,X.L. Broackes-Carter,F., Campbell,N.H., Chavali,G., Chen,C.,
(2020) Recent advances in network-based methods for disease gene del-Toro,N. et al. (2014) The MIntAct project–IntAct as a common
prediction. Brief. Bioinform., 22, bbaa303. curation platform for 11 molecular interaction databases. Nucleic
13. Huang,X., Liu,H., Li,X., Guan,L., Li,J., Tellier,L., Yang,H., Wang,J. Acids Res., 42, D358–D363.
and Zhang,J. (2018) Revealing Alzheimer’s disease genes spectrum in 29. Oughtred,R., Rust,J., Chang,C., Breitkreutz,B.J., Stark,C.,
the whole-genome by machine learning. BMC Neurol., 18, 5. Willems,A., Boucher,L., Leung,G., Kolas,N., Tyers,M. et al. (2021)
14. Pierson,E. and GTEx ConsortiumGTEx Consortium, Koller,D., The BioGRID database: a comprehensive biomedical resource of
Battle,A., Mostafavi,S., Ardlie,K.G., Getz,G., Wright,F.A., Kellis,M., curated protein, genetic, and chemical interactions. Protein Sci., 30,
Volpi,S. et al. (2015) Sharing and specificity of co-expression 187–200.
Downloaded from https://academic.oup.com/nar/article/50/D1/D710/6442700 by guest on 20 February 2022
networks across 35 human tissues. PLoS Comput. Biol., 11, e1004220. 30. Boyle,E.I., Weng,S., Gollub,J., Jin,H., Botstein,D., Cherry,J.M. and
15. Sonawane,A.R., Platig,J., Fagny,M., Chen,C.Y., Paulson,J.N., Sherlock,G. (2004) GO::TermFinder–open source software for
Lopes-Ramos,C.M., DeMeo,D.L., Quackenbush,J., Glass,K. and accessing Gene Ontology information and finding significantly
Kuijjer,M.L. (2017) Understanding tissue-specific gene regulation. enriched Gene Ontology terms associated with a list of genes.
Cell Rep., 21, 1077–1088. Bioinformatics, 20, 3710–3715.
16. Kuijjer,M.L., Tung,M.G., Yuan,G., Quackenbush,J. and Glass,K. 31. Serrano-Pozo,A., Das,S. and Hyman,B.T. (2021) APOE and
(2019) Estimating sample-specific regulatory networks. iScience, 14, Alzheimer’s disease: advances in genetics, pathophysiology, and
226–240. therapeutic approaches. Lancet Neurol., 20, 68–80.
17. Lopes-Ramos,C.M., Chen,C.Y., Kuijjer,M.L., Paulson,J.N., 32. Zalocusky,K.A., Nelson,M.R. and Huang,Y. (2019) An
Sonawane,A.R., Fagny,M., Platig,J., Glass,K., Quackenbush,J. and Alzheimer’s-disease-protective APOE mutation. Nat. Med., 25,
DeMeo,D.L. (2020) Sex differences in gene expression and regulatory 1648–1649.
networks across 29 human tissues. Cell Rep., 31, 107795. 33. Haddy,N., De Bacquer,D., Chemaly,M.M., Maurice,M.,
18. Ben Guebila,M., Lopes-Ramos,C.M., Weighill,D., Sonawane,A.R., Ehnholm,C., Evans,A., Sans,S., Do Carmo Martins,M., De
Burkholz,R., Shamsaei,B., Platig,J., Glass,K., Kuijjer,M.L. and Backer,G. et al. (2002) The importance of plasma apolipoprotein E
Quackenbush,J. (2021) GRAND: a database of gene regulatory concentration in addition to its common polymorphism on
network models across human conditions. Nucleic Acids Res., inter-individual variation in lipid levels: results from Apo Europe.
gkab778. Eur. J. Hum. Genet., 10, 841–850.
19. Dojer,N., Bednarz,P., Podsiadlo,A. and Wilczynski,B. (2013) 34. Pinero,J., Bravo,A., Queralt-Rosinach,N., Gutierrez-Sacristan,A.,
BNFinder2:faster Bayesian network learning and Bayesian Deu-Pons,J., Centeno,E., Garcia-Garcia,J., Sanz,F. and Furlong,L.I.
classification. Bioinformatics, 29, 2068–2070. (2017) DisGeNET: a comprehensive platform integrating information
20. Huttenhower,C., Hibbs,M., Myers,C. and Troyanskaya,O.G. (2006) on human disease-associated genes and variants. Nucleic Acids Res.,
A scalable method for integration and functional analysis of multiple 45, D833–D839.
microarray datasets. Bioinformatics, 22, 2890–2897. 35. Szklarczyk,D., Morris,J.H., Cook,H., Kuhn,M., Wyder,S.,
21. Chen,T. and Guestrin,C. (2016) XGBoost: a scalable tree boosting Simonovic,M., Santos,A., Doncheva,N.T., Roth,A., Bork,P. et al.
system. In: Proceedings of the 22nd ACM SIGKDD International (2017) The STRING database in 2017: quality-controlled
Conference on Knowledge Discovery and Data Mining. pp.785–794. protein-protein association networks, made broadly accessible.
22. Zheng,R., Li,M., Chen,X., Wu,F.X., Pan,Y. and Wang,J. (2019) Nucleic Acids Res., 45, D362–D368.
BiXGBoost: a scalable, flexible boosting-based method for 36. Heaton,H., Talman,A.M., Knights,A., Imaz,M., Gaffney,D.J.,
reconstructing gene regulatory networks. Bioinformatics, 35, Durbin,R., Hemberg,M. and Lawniczak,M. (2020) Souporcell:
1893–1900. robust clustering of single-cell RNA-seq data by genotype without
23. Ogunleye,A. and Wang,Q.G. (2020) XGBoost model for chronic reference genotypes. Nat. Methods, 17, 615–620.
kidney disease diagnosis. IEEE/ACM Trans. Comput. Biol. 37. Li,X., Wang,K., Lyu,Y., Pan,H., Zhang,J., Stambolian,D.,
Bioinform, 17, 2131–2140. Susztak,K., Reilly,M.P., Hu,G. and Li,M. (2020) Deep learning
24. Ziemann,M., Kaspi,A. and El-Osta,A. (2019) Digital expression enables accurate clustering with batch effect removal in single-cell
explorer 2: a repository of uniformly processed RNA sequencing RNA-seq analysis. Nat. Commun., 11, 2338.
data. Gigascience, 8, giz022. 38. Zhao,T., Lyu,S., Lu,G., Juan,L., Zeng,X., Wei,Z., Hao,J. and Peng,J.
25. Leinonen,R., Sugawara,H., Shumway,M. and International (2021) SC2disease: a manually curated database of single-cell
Nucleotide Sequence Database Collaboration (2011) The sequence transcriptome for human diseases. Nucleic Acids Res., 49,
read archive. Nucleic Acids Res., 39, D19–D21. D1413–D1419.
26. Li,H.D., Menon,R., Govindarajoo,B., Panwar,B., Zhang,Y.,
Omenn,G.S. and Guan,Y. (2015) Functional networks ofYou can also read