Tisane: Authoring Statistical Models via Formal Reasoning from Conceptual and Data Relationships
←
→
Page content transcription
If your browser does not render page correctly, please read the page content below
Tisane: Authoring Statistical Models via Formal Reasoning from Conceptual
 and Data Relationships

 EUNICE JUN, University of Washington, USA
 AUDREY SEO, University of Washington, USA
 JEFFREY HEER, University of Washington, USA
 RENÉ JUST, University of Washington, USA
 Proper statistical modeling incorporates domain theory about how concepts relate and details of how data were measured. However,
arXiv:2201.02705v1 [cs.AI] 7 Jan 2022

 data analysts currently lack tool support for recording and reasoning about domain assumptions, data collection, and modeling choices
 in an integrated manner, leading to mistakes that can compromise scientific validity. For instance, generalized linear mixed-effects
 models (GLMMs) help answer complex research questions, but omitting random effects impairs the generalizability of results. To
 address this need, we present Tisane, a mixed-initiative system for authoring generalized linear models with and without mixed-effects.
 Tisane introduces a study design specification language for expressing and asking questions about relationships between variables.
 Tisane contributes an interactive compilation process that represents relationships in a graph, infers candidate statistical models, and
 asks follow-up questions to disambiguate user queries to construct a valid model. In case studies with three researchers, we find that
 Tisane helps them focus on their goals and assumptions while avoiding past mistakes.

 ACM Reference Format:
 Eunice Jun, Audrey Seo, Jeffrey Heer, and René Just. 2022. Tisane: Authoring Statistical Models via Formal Reasoning from Conceptual
 and Data Relationships. In CHI Conference on Human Factors in Computing Systems (CHI ’22), April 29-May 5, 2022, New Orleans, LA,
 USA. ACM, New York, NY, USA, 25 pages. https://doi.org/10.1145/3491102.3501888

 1 INTRODUCTION
 Statistical models play a critical role in how people evaluate data and make decisions. Policy makers rely on models to
 track disease, inform health recommendations, and allocate resources. Scientists use models to develop, evaluate, and
 compare theories. Journalists report on new findings in science, which individuals use to make decisions that impact
 their nutrition, finances, and other aspects of their lives. Faulty statistical models can lead to spurious estimations of
 disease spread, findings that do not generalize or reproduce, and a misinformed public. The challenge in developing
 accurate statistical models lies not in a lack of access to mathematical tools, of which there are many (e.g., R [63],
 Python [52], SPSS [58], and SAS [24]), but in accurately applying them in conjunction with domain theory, data
 collection, and statistical knowledge [26, 38].
 There is a mismatch between the interfaces existing statistical tools provide and the needs of analysts, especially
 those who have domain knowledge but lack deep statistical expertise (e.g., many researchers). Current tools separate
 reasoning about domain theory, study design, and statistical models, but analysts need to reason about all three together
 in order to author accurate models [26]. For example, consider a researcher developing statistical models of hospital

 Permission to make digital or hard copies of all or part of this work for personal or classroom use is granted without fee provided that copies are not
 made or distributed for profit or commercial advantage and that copies bear this notice and the full citation on the first page. Copyrights for components
 of this work owned by others than the author(s) must be honored. Abstracting with credit is permitted. To copy otherwise, or republish, to post on
 servers or to redistribute to lists, requires prior specific permission and/or a fee. Request permissions from permissions@acm.org.
 © 2022 Copyright held by the owner/author(s). Publication rights licensed to ACM.
 Manuscript submitted to ACM

 1
To Appear, CHI 2022, USA Eunice Jun, Audrey Seo, Jeffrey Heer, and René Just

expenditure to inform public policy. They collect data about individual hospitals within counties. Based on their domain
knowledge, they know that counties have different demographics and that hospitals in these counties have different
funding sources (private vs. public), all of which influence hospital spending. To model county-level and hospital-level
attributes, the researcher may author a generalized linear mixed-effects model (GLMM) that accounts for clustering
within counties. But which variables should they include? How do they account for this clustering? The three most
common mistakes in modeling hierarchical data [9] lead to miscalibrated statistical power, “ecological fallacies” [49],
and/or results that may not generalize, which impact not only the validity of research findings [3] but also enacted
policies. How can the researcher avoid these issues?
 To reduce threats to validity and improve analytical practices, how might we derive (initial) statistical models
from knowledge about concepts and data collection? Inferring a statistical model raises two challenges: (1) How
do we elicit the information necessary for inferring a statistical model? and (2) How do we infer a statistical model,
given this information? We present Tisane, a system for integrating conceptual relationships, data collection
details, and modeling choices when specifying generalized linear models (GLMs) and generalized linear
mixed-effects models (GLMMs). GLMs and GLMMs are meaningful targets because they are commonly used (e.g.,
in psychology [9, 35], social science [29], and medicine [3, 5]) yet are easy to misspecify for statistical experts and
non-experts alike [3, 9]. We designed Tisane to support researchers who are domain experts capable of supplying
conceptual and data collection information but lack the statistical expertise or confidence to author GLM/GLMMs
accurately.
 Tisane provides a study design specification language for expressing relationships between variables. For example,
the public health researcher can express that average county income is associated with hospital spending based on health
economics theory or specify that hospitals exist within counties. Tisane compiles the explicitly stated relationships
into an internal graph representation and then traverses the graph to infer candidate GLMs/GLMMs. In this process,
Tisane engages analysts in interactive compilation. Analysts can query Tisane for a statistical model that explains
a specific dependent variable from a set of independent variables. Based on the input query, Tisane asks analysts
disambiguating questions to output a script for fitting a valid GLM/GLMM. Interactive compilation enables analysts to
focus on their primary variables of interest as the system checks that analysts do not overlook relevant variables, such
as potential confounders or data clustering that could compromise generalizability. Figure 1 provides an overview of
this process.
 To examine how Tisane affects real-world analyses, we conducted case studies with three researchers. The
researchers described how Tisane focused them on their research goals, made them aware of domain assumptions, and
helped them avoid past mistakes. Tisane even helped one researcher correct their model prior to submitting to the
ACM Conference on Human Factors in Computing (CHI). These findings corroborate those from an earlier pilot study
that informed our design process (see supplemental material).
 We contribute (1) a study design specification language and graph representation for recording and reasoning about
conceptual relationships between variables and data collection procedures (Section 5), (2) an interactive compilation
process that asks disambiguating questions and outputs code for fitting and visualizing a GLM/GLMM (Section 6), and
(3) three case studies with researchers that demonstrate the feasibility and benefit of prioritizing variable relationships
to author linear models (Section 7). We also provide an open-source Python implementation of Tisane.1

1 Tisane is available for download on pip, a popular Python package manager. The source code is available at https://github.com/emjun/tisane.

 2
Tisane: Authoring Statistical Models via Formal Reasoning from Conceptual and Data Relationships To Appear, CHI 2022, USA

 = 0 + 1 1 + · · · +

 2

 import tisane as ts 0

 −2
 −5 0 5

 Input Study Design Specification Graph IR Disambiguation Output Code

 Interactive Compilation

Fig. 1. Overview of the Tisane system. Analysts specify a set of variable relationships (Input Study Design Specification). Tisane
represents these in an internal graph (Graph IR). To infer a statistical model, Tisane engages analysts in an interactive compilation
process that elicits additional input from analysts in a disambiguation process (Disambiguation) and outputs a script for fitting a valid
GLM and visualizing its residuals (Output Code).

2 BACKGROUND AND RELATED WORK
We first provide brief background about data analysis practices, GLMs/GLMMs, and causal analysis. Then, we discuss
how Tisane extends prior work on tools for conceptual reasoning, study design, and automated statistical analysis.

2.1 Data Analysis Practices
Studies with analysts have found that data analysis is an iterative process that involves data collection; cleaning and
wrangling; and statistical testing and modeling [21, 31, 32]. To formalize their hypotheses as statistical model programs,
analysts engage in a dual-search process involving refinements to their conceptual understanding and iterations on
model implementations, under constraints of data and statistical knowledge [26]. Analysts incorporate and refine their
domain knowledge, study design, statistical models, and computational instantiations of statistical models while creating
statistical model programs. Tisane facilitates one formalization cycle in this iterative process: deriving statistical models
from conceptual knowledge and data measurement specifications.

2.2 Generalized Linear Models and Generalized Linear Mixed-effects Models
Tisane supports two classes of models that are widely applicable to diverse domains and data collection settings [3, 5, 35]:
Generalized Linear Models (GLMs) and Generalized Linear Mixed-effects Models (GLMMs). Both GLMs and GLMMs
consist of (i) a model effects structure, which can include main and interaction effects and (ii) family and link functions.
The family function describes how the residuals of a model are distributed. The link function transforms the predicted
values of the dependent variable. This allows modeling of linear and non-linear relationships between the dependent
variable and the predictors. In contrast to transformations applied directly to the dependent variable, a link function
does not affect the error distributions around the predicted values. The key difference between GLMs and GLMMs is that
GLMMs contain random effects in their model effects structure. Random effects describe how individuals (e.g., a study
participant) vary and are necessary in the presence of hierarchies, repeated measures, and non-nesting composition
(subsubsection 5.2.2)2 .

2 Traditionally,
 the term “mixed effects” refers to the simultaneous presence of “fixed” and “random” effects in a single model. We try to avoid these terms
as there are many contradictory usages and definitions [18]. When we do use these terms, we use the definitions from Kreft and De Leeuw [29].
 3
To Appear, CHI 2022, USA Eunice Jun, Audrey Seo, Jeffrey Heer, and René Just

 Both GLMs and GLMMs assume that (i) the variables involved are linearly related, (ii) there are no extreme outliers,
and (iii) the family and link functions are correctly specified. In addition, GLMs also assume that (iv) the observations
are independent. Tisane’s interactive compilation process guides users through specifying model effects structures,
family and link functions to satisfy assumption (iii), and random effects only when necessary to pick between GLMs
and GLMMs and satisfy assumption (iv).

2.3 Causal Analysis
There are multiple frameworks for reasoning about causality [44, 50]. One widespread approach is to use directed
acyclic graphs (DAGs) to encode conditional dependencies between variables [20, 45, 56, 57]. If analysts can specify a
formal causal graph, Pearl’s “backdoor path criterion” [44, 46] explains the set of variables that control for confounding.
However, in practice, specifying proper causal DAGs is challenging and error-prone for domain experts who are not
also experts in causal analysis [60] due to uncertainty of empirical findings [61] and lack of guidance on which variables
and relationships to include [67]. Accordingly, Tisane does not expect analysts to specify a formal causal graph. Instead,
analysts can express causal relationships as well as “looser” association (not causal) relationships between variables in
the study design specification language.
 Prior work in the causal reasoning literature shows how linear models can be derived from causal graphs to make
statistical inferences and test the motivating causal graph [56, 57]. Recently, VanderWeele proposed the “modified
disjunctive cause criterion” [66] as a new heuristic for researchers without a clearly accepted formal causal model to
identify confounders to include in a linear model, for example. The criterion identifies confounders in a graph based
on expressed causal relationships. Tisane applies the modified disjunctive cause criterion when suggesting variables
to include in a GLM or GLMM. Tisane does not automatically include variables to the statistical models because
substantive domain knowledge is necessary to resolve issues of temporal dependence between variables, among other
considerations [66]. To guide analysts through the suggestions, Tisane provides analysts with explanations to aid their
decision making during disambiguation.
 Finally, GLMs are not formal causal analyses. Tisane does not calculate average causal effect or other causal estimands.
Rather, Tisane only utilizes insights about the connection between causal DAGs and linear models to guide analysts
towards including potentially relevant confounders in their GLMs grounded in domain knowledge.

2.4 Tools for Conceptual Reasoning and Study Design
Tools such as Daggity [64] support authoring, editing, and formally analyzing causal graphs through code and a visual
editor. Daggity requires users to specify a formal causal graph, which may not always be possible [60, 61, 67]. Although
a knowledgeable analyst could use Daggity to identify a set of variables that control for confounding to include in a
linear model, Daggity does not provide this support directly. In contrast, Tisane aims to (i) help analysts may not be
able to formally specify causal graphs and (ii) scaffold the derivation of GLMs and GLMMs from causal graphs.
 Several domain-specific languages [1, 55] and tools specialize in experiment design [4, 15, 62]. A primary focus is
to provide researchers low-level control over trial-level and randomization details. For example, JsPsych [13] gives
researchers fine-grained control over the design and presentation of stimuli for online experiments. At a mid-level of
abstraction, Touchstone [36] is a tool for designing and launching online experiments. It also refers users to R and JMP
for data analysis but does not help users author an appropriate statistical model. Touchstone2 [15] helps researchers
design experiments based on statistical power. At a high-level of abstraction, edibble [62] helps researchers plan their
data collection schema. Edibble aims to provide a “grammar of study design” that focuses users on their experimental
 4
Tisane: Authoring Statistical Models via Formal Reasoning from Conceptual and Data Relationships To Appear, CHI 2022, USA

manipulations in relation to specific units (e.g., participants, students, schools), the frequency and distribution of
conditions (e.g., within-subjects vs. between-subjects), and measures to collect (e.g., age, grade, location) in order to
output a table to fill in during data collection. While Tisane’s study design specification language uses an abstraction
level comparable to edibble, Tisane is focused on using the expressed data measurement relationships to infer a statistical
model. Additionally, Tisane’s SDSL provides conceptual relationships that are out of the scope of edibble but important
for specifying conceptually valid statistical models.

2.5 Tools for Automated Statistical Analysis
Researchers have introduced tools that automate statistical analyses. Given a dataset, the Automatic Statistician [34]
generates a report listing all “interesting” relationships (e.g., correlations, statistical models, etc.). Although apparently
complete, the Automatic Statistician may overlook analyses that are conceptually interesting and difficult, if not
impossible, to deduce from data alone. In contrast, Tisane prioritizes analyst-specified conceptual and data measurement
relationships and uses them to bootstrap the modeling process. As a result, Tisane aims to ensure that statistical analyses
are not only technically correct but also conceptually correct.
 AutoML tools automate machine learning for non-experts. Tools such as Auto-WEKA [65], auto-sklearn [16], and
H2O AutoML [30] aim to make statistical methods more widely usable. Tisane differs from AutoML efforts in its focus
on analysts who prioritize explanation, not just prediction, such as researchers developing scientific theories. As a result,
Tisane provides support for specifying GLMMs, which some prominent AutoML tools, such as auto-sklearn [16], omit.
Tisane ensures that inferred statistical models respect expressed conceptual relationships. Thus, Tisane programs can
serve a secondary purpose of recording and communicating conceptual and data measurement assumptions. In addition,
Tisane explains its suggestions to users and guides them in answering disambiguation questions whereas AutoML
tools do not by default. Tisane’s explanations are grounded in the variable relationships analysts specify. Although
H2O AutoML offers a model explainability module [14], these “explanations” take the form of plots without conceptual
exposition.
 Tea [27] elicits end-user expertise through explicit hypotheses and study designs to automatically infer a set of
valid Null Hypothesis Significance Tests. Tisane differs from Tea in three key ways. First, Tisane enables analysts to
express more complex study designs, such as nested hierarchies that necessitate mixed effects modeling, which are not
available in Tea. Second, because statistical modeling requires more conceptual expertise and oversight, Tisane is a
mixed-initiative system while Tea is not. Third, Tisane outputs a single statistical model, whereas Tea outputs a set of
statistical tests.
 Recent work in the database community helps researchers answer causal questions about multilevel, or hierarchical,
data [28, 51]. CaRL [51] provides a domain-specific language to express causal relationships between variables and a
GUI to show researchers results. Like CaRL, Tisane leverages the insight that researchers have domain knowledge that
a system can use to infer statistical methods. Whereas CaRL is focused on answering specific queries about average
causal effect, Tisane supports authoring GLMs and GLMMs, which can address a range of non-causal questions.
 In summary, whereas prior systems have supported reasoning about either concepts, study designs, or statistical
models, Tisane integrates all three. Existing theories of data analysis [26, 38] illustrate how all three concerns are
necessary and interconnected. Thus, a tool for integrating these concerns seems a promising way to reduce errors and
the cognitive burden involved in model specification.

 5
To Appear, CHI 2022, USA Eunice Jun, Audrey Seo, Jeffrey Heer, and René Just

 3 USAGE SCENARIO
 To illustrate how a researcher might use Tisane, we compare two hypothetical researchers analyzing the same dataset.
 This scenario (simplified from [9]) illustrates workflow differences between Tisane and current tools (statsmodels in
 Python and lmer in R). Michael and Bridget are health experts studying the effects of a new exercise regimen they
 have developed on weight loss. Their research question is “How much does the exercise regimen affect weight loss?”
 They recruited 386 adults to be part of 40 exercise groups focused on diet and weight management. The researchers
 randomly assigned 16 groups a control regimen and the other 24 groups an experimental regimen. The researchers
 measured the adults’ motivation scores for weight loss at the beginning of the experiment and their total weight loss at
 the end of the experiment. Michael uses statsmodels [47] to analyze the data3 . Bridget uses Tisane. While both are
 experienced researchers, familiar with their shared field of study, Michael and Bridget are not statistics experts. They
 have both used GLMs in the past but neither has heard of GLMMs.

 3.1 Workflow in Python using statsmodels
 Michael takes a first attempt at creating a model. He loads the data and casts regimen_condition and group as
 categorical variables. The first model (Listing 1) that Michael tries has the dependent variable pounds_lost and the
 independent variables regimen_condition (control vs. treatment) and motivation.

1 import statsmodels . formula . api as sm
2 import pandas as pd
3

4 data = pd . read_csv ( " data . csv " )
5 data [ ' regimen_condition '] = data [ ' regimen_condition ']. astype ( ' str ') . astype ( " category " )
6 data [ ' group '] = data [ ' group ']. astype ( ' str ') . astype ( " category " )
7

8 m1 = sm . glm ( " pounds_lost ~ regimen_condition + motivation " , data = data )

 Listing 1. Michael’s first model attempt, from the usage scenario (Section 3). Michael specifies pounds_lost as his dependent variable,
 and regimen_condition and motivation as his independent variables.

 Although this model includes the primary variable of research interest (regimen_condition) and a likely confounder
 (motivation), Michael realizes that this model overlooks the fact that the adults exercised in groups. The groups likely
 had group support and accountability, among other benefits of group cohesion that are difficult to measure and not
 included in the data.
 In his second model (Listing 2), Michael adds group as an additional independent variable. Considering that this
 model accounts for variables pertaining to individual adults (i.e., pounds_lost, motivation) and to groups (i.e.,
 regimen_condition), Michael supposes this model is good enough and accepts it as his final model.

9 m2 = sm . glm ( " pounds_lost ~ regimen_condition + motivation + group " , data = data )

 Listing 2. Michael’s second model attempt. Building on his first model (Listing 1), Michael adds an additional independent variable,
 group.

 3 The workflow in R is almost identical to the workflow in Python using statsmodels.
 6
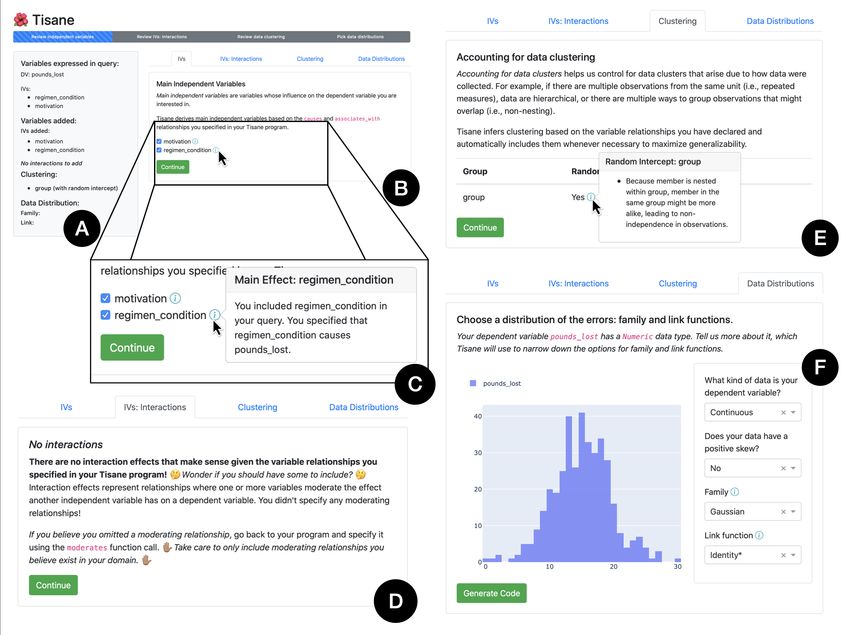
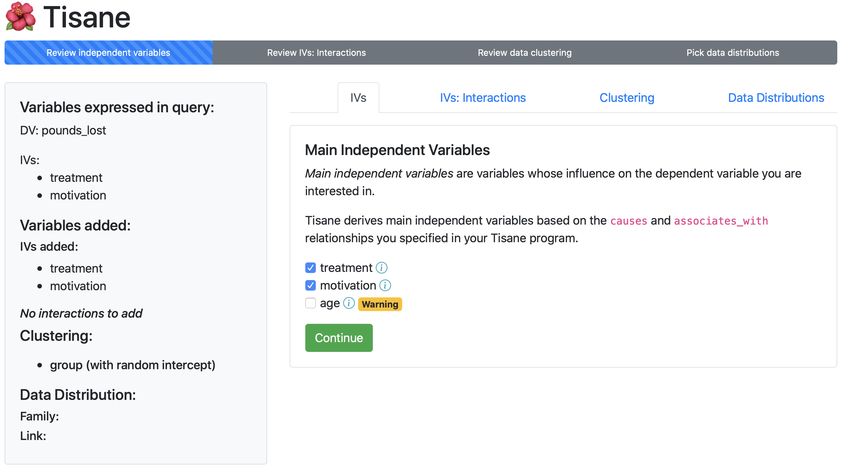
Tisane: Authoring Statistical Models via Formal Reasoning from Conceptual and Data Relationships To Appear, CHI 2022, USA

 3.2 Workflow with Tisane
 Bridget starts by listing the variables of interest. Lines 3-8 in Listing 3 show how variables are declared with a data
 type, the name of the column in the data that corresponds to the variable. The observational units are adult and group.
 The measures motivation and pounds_lost pertain to individual adults while exercise regimen_condition was
 administered to exercise groups. The Tisane program makes these details explicit. Because Bridget has data, she does
 not need to specify the cardinality of variables.
1 import tisane as ts
2

3 # Variable declarations
4 adult = ts . Unit ( " member " )
5 motivation = adult . numeric ( " motivation " )
6 pounds_lost = adult . numeric ( " pounds_lost " )
7 group = ts . Unit ( " group " )
8 regimen_condition = group . nominal ( " regimen_condition " ) # control vs . treatment

 Listing 3. The first snippet of the example Tisane program, written in the study design specification language, from the usage scenario
 (Section 3). After importing tisane, Bridget specifies her observed variables.

 By expressing how the variables relate to one another, Bridget becomes more consciously aware of the assumptions
 the research team has made about their domain. In line 10 of Listing 4, Bridget specifies that regimen_condition directly
 causes pounds_lost while in line 11 motivation is associated with, but not necessarily a cause of, pounds_lost. She
 also expresses that adults were nested in groups in line 12.
10 regimen_condition . causes ( pounds_lost )
11 motivation . associates_with ( pounds_lost )
12 adult . nests_within ( group )

 Listing 4. A continuation of the snippet in Listing 3. Bridget specifies the relationships between her observed variables using the
 methods causes, associates_with, and nests_within.

 Next, in line 14 of Listing 5, Bridget specifies a study design with pounds_lost as the dependent variable and
 regimen_condition and motivation as the independent variables of interest and assigns data to the design. Bridget
 uses this design to query Tisane for a statistical model in line 15.
13 # Query Tisane for a statistical model
14 design = ts . Design ( dv = pounds_lost , ivs =[ regimen_condition , motivation ]) . assign_data ( " data . csv " )
15 ts . infer_model ( design = design )

 Listing 5. The final snippet of the example Tisane program, continuing from Listing 4. Bridget queries Tisane for a statistical model by
 specifying her study design’s most important variables and assigning data. Based on the complete program, consisting of this listing
 as well as Listing 3 and Listing 4, Bridget engages in a disambiguation process (see Figure 2) to generate a final output statistical
 modeling script.

 Tisane launches a GUI in the browser after executing the program.4 In the GUI, Tisane asks Bridget to look over
 her choice of variables (Figure 2). As seen in panel B, there are no additional variables to consider. Bridget continues
 to the next tab, interaction effects (panel D). Tisane explains that interaction effects do not make sense for her model
 given that she did not express any moderating relationships. In this way, Tisane prevents her from adding arbitrary
 interaction effects without conceptual foundation. In the next tab (E), Bridget sees that Tisane has automatically included
 4 As explained in subsection 6.3, if Bridget had executed the script in a Jupyter notebook, the GUI would open in the notebook.
 7
To Appear, CHI 2022, USA Eunice Jun, Audrey Seo, Jeffrey Heer, and René Just

 Fig. 2. Example Tisane GUI for disambiguation from usage scenario. Tisane asks analysts disambiguating questions about variables
 that are conceptually relevant and that analysts may have overlooked in their query. (A) The left hand panel gives an overview of
 the model the analyst is constructing. (B) Based on the variable relationships analysts specify (Listing 4), Tisane infers candidate
 main effects that may be potential confounders. Tisane asks analysts if they would like to include these variables, explaining in a
 tooltip (C) why the variable may be important to include. (D) Tisane only suggests interaction effects if analysts specify moderating
 relationships in their specification. This way, Tisane ensures that model structures are conceptually justifiable. (E) From the data
 measurement relationships analysts provide (line 15 in Listing 4), Tisane automatically infers and includes random effects to increase
 generalizability and external validity of statistical findings. (F) Tisane assists analysts in choosing an initial family and link function
 by asking them a series of questions about their dependent (e.g., Is the variable continuous or about count data?). To help analysts
 answer these questions and verify their assumptions about the data, Tisane shows a histogram of the dependent variable.

 exercise group as a random intercept. (Tisane does not include a random slope for group because there is only one
 observation per adult in a group, see subsubsection 6.2.3.) Bridget has not heard of a random intercept before, but she
 reads the explanation, which explains that accounting for exercise groups is necessary since adults were in groups
 and groups received the regimen_conditions. In the last tab, Bridget answers questions about the the dependent
 variable pounds_lost to identify family and link functions. She specifies that the dependent variable is continuous.
 She chooses the Gaussian family with the default link function. Finally, Bridget clicks on the button to generate code.
 Tisane’s output script contains code to fit the statistical model and plot model residuals to inspect it. Tisane helped
 Bridget author the following GLMM:
1 model = Lmer (
 8
Tisane: Authoring Statistical Models via Formal Reasoning from Conceptual and Data Relationships To Appear, CHI 2022, USA

2 formula = " pounds_lost ~ regimen_condition + motivation + (1| group ) " ,
3 family = " gaussian " ,
4 data = df ,
5 )

 Listing 6. Bridget’s output statistical model from using Tisane. Tisane suggests a GLMM with group as a random intercept. The
 output script contains code for fitting this model and inspecting it using a residuals plot.

 3.3 Key differences in workflows and statistical results
 Even with experience modeling in Python, Michael makes two common mistakes in authoring linear models [9, 29]:
 disaggregating observations and artificially inflating statistical power (model 1) and using a “fixed effects approach to
 clustering” that compromises the generalizability of findings [3] (model 2). Despite knowing all the pertinent information
 about the domain and data collection for constructing a valid statistical model, Michael is not able to leverage it without
 additional statistical expertise, and, as a result, arrives at different statistical results than Bridget.
 In contrast, Bridget and other analysts using Tisane express their knowledge using the study design specification
 language, answer a few disambiguating questions with guidance, and receive as output a script for executing a statistical
 model. Tisane helps researchers like Bridget leverage their conceptual and data collection knowledge to author statistical
 models that optimize for statistical conclusion and external validity, avoiding errors and reducing the cognitive burden
 along the way.
 Once fit, Michael’s and Bridget’s final models (see Table 1) disagree on the precise effect sizes of regimen_condition
 and motivation, which are pertinent to their motivating research question. Michael concludes that regimen_condition
 and motivation are less important than they really are. Additionally, the coefficients and standard errors for each
 group suggest that Michael’s model overlooks important group differences. Therefore, using a GLM instead of the
 appropriate model, a GLMM, leads Michael to answer the research question differently than Bridget, artificially inflates
 statistical power [9], and compromises the generalizability of his findings [3].5

 regimen_condition motivation group
 Michael 1.628 .046 3.119 .000 Various Various
 Bridget 1.659 .005 3.193 .000 N/A N/A
 Table 1. The coefficients for each of the independent variables in Michael’s and Bridget’s models. The complete output tables for
 Michael’s and Bridget’s models are included in supplemental material.

 4 DESIGN GOALS
 We articulated four design goals based on prior research and our formative work. The supplemental material details our
 design process.
 DG1 - Prioritize conceptual knowledge. Current tools require analysts to transition back and forth between their
 conceptual concerns and their statistical model specifications using math and/or code [26]. Analysts’ conceptual
 knowledge remains implicit and hidden [38]. As a result, analysts may resort to familiar but sub-optimal statistical
 methods [26] or accidentally overlook details that lead to conceptually inaccurate statistical models. One solution is to
 5 Another common mistake, not shown here, is to aggregate observations and use group means of the independent variables in the model, artificially
 deflating statistical power (“ecological fallacy” [49]). Kreft and De Leeuw [29] share an example where disaggregating vs. aggregating data lead to different
 signs for a fitted parameter. Unfortunately, we could not access the data to illustrate this here.
 9
To Appear, CHI 2022, USA Eunice Jun, Audrey Seo, Jeffrey Heer, and René Just

provide tools at a higher level of abstraction that allow analysts to express their conceptual knowledge directly. However,
a higher level of abstraction alone is not enough. Tools must then leverage the expressed conceptual knowledge to
guide analysis authoring.
 Tisane provides a high-level study design specification language that captures the motivation behind a study
(Section 5). Tisane represents the specification in an internal graph representation to derive only conceptually accurate
statistical model candidates. To arrive at an output statistical model, Tisane asks analysts disambiguating questions and
provides them with suggestions and explanations based on their expressed variable relationships (Section 6). Importantly,
Tisane does not fit or show modeling results during disambiguation to discourage statistical fishing. Although Tisane
does not prevent researchers from re-starting and iterating on their Tisane program to attain specific statistical model
findings, Tisane programs act as documentation for conceptual relationships that others could audit.
 DG2 - Prioritize the validity of models. At present, the burden of valid statistics lies entirely on analysts. Tisane divides
some of this burden by (i) ensuring correct application of methods (i.e., GLM vs. GLMM) and (ii) inferring models
that increase the generalizability of results for GLMMs [2, 3]. Tisane helps analysts author GLMs and GLMMs that
satisfy two assumptions: (i) observational dependencies and (ii) correct family and link functions. First, Tisane infers
and constructs maximal random effects that account for dependencies due to repeated measures, hierarchical data,
and non-nesting compositions. Maximal effects structures account for within-sample variability and thereby mitigate
threats to external validity due to sampling biases from the choice of observational units and settings [54]. Second,
Tisane narrows the set of viable family and link functions to match the dependent variable’s data type (e.g., numeric).
Tisane’s GUI asks follow-up questions to determine the semantic type of variables (e.g., counts), further narrowing
analysts’ family and link function choices. The output script also plots model residuals against fitted values and provides
tips (as comments) for interpreting the plot. The family and link functions Tisane suggests are intended to bootstrap an
initial statistical model that analysts can examine and, if necessary, revise. This is how Tisane helps analysts avoid four
common threats to statistical conclusion and external validity [11]: (i) violation of statistical method assumptions, (ii)
fishing for statistical results, (iii) not accounting for the influence of specific units, and (iv) overlooking the influence of
data collection procedures on outcomes.
 DG3 - Give analysts guidance and control. Analysts may have insight into their research questions and domain that
a system cannot capture. At the same time, analysts, especially those with less statistical experience, may lack the
knowledge to select among many possible statistical models, which may inadvertently encourage cherry-picking based
on observed results. Thus, Tisane adopts an interaction model that asks analysts specific questions to resolve modeling
ambiguity rather than show multiple statistical models at the same time. Tisane also does not automatically select a a
“best” model (e.g., highest R2 , easiest to interpret) but rather gives analysts suggestions and explanations to help them
come to a statistical model that is valid and appropriate for their goals.
 DG4 - Facilitate statistical planning without data. Experimental design best practices, such as pre-registration,
encourage researchers to plan their statistical analyses prior to data collection. In accordance, Tisane does not require
analysts to provide data. If analysts do not have data, analysts must specify the cardinality of variables at declaration.
Without data, Tisane cannot validate variable declarations but otherwise guide analysts through the same interactive
compilation process. The output Tisane script will include an empty file path and a comment directing analysts to
specify a data path prior to execution. Analysts could attach this output Tisane script to their pre-registrations. Once
analysts collect data, they can re-run their previously specified Tisane program to validate and inspect their data. If
Tisane does not issue any validation errors, analysts can proceed to generate an identical script or provide a file path in
the pre-registered script and execute it.
 10
Tisane: Authoring Statistical Models via Formal Reasoning from Conceptual and Data Relationships To Appear, CHI 2022, USA

5 STUDY DESIGN SPECIFICATION LANGUAGE AND GRAPH REPRESENTATION
Tisane provides a study design specification language (SDSL) for expressing relationships between variables. There
are two key challenges in designing a specification from which to infer statistical models: (1) determining the set
of relationships that are essential for statistical modeling and (2) determining the level of granularity to express
relationships.
 In Tisane’s SDSL, analysts can express conceptual and data measurement relationships between variables. Both are
necessary to specify the domain knowledge and study designs from which Tisane infers statistical models.

5.1 Variables
There are three types of data variables in Tisane’s SDSL: (i) units, (ii) measures, and (iii) study environment settings.
The Unit type represents entities that are observed and/or receive experimental treatments. In the experimental
design literature, these entities are referred to as “observational units” and “experimental units,” respectively. Entities
can be both observational and experimental units simultaneously, so the SDSL does not provide more granular unit
sub-types. The Measure type represents attributes of units and must be constructed through their units, e.g., age
= adult.numeric('age'). Measures are proxies (e.g., minutes ran on a treadmill) of underlying constructs (e.g.,
endurance). Measures can have one of the following data types: numeric, nominal, or ordinal. Numeric measures have
values that lie on an interval or ratio scale (e.g., age, minutes ran on a treadmill). Nominal measures are categorical
variables without an ordering (e.g., race). Ordinal measures are ordered categorical variables (e.g., grade level in school).
We included these data types because they are commonly taught and used in data analysis. The SetUp type represents
study environment settings that are neither units nor measures. For example, time is often an environmental variable
that differentiates repeated measures but is neither a unit nor a measure of a specific unit.

5.2 Relationships between Variables
In Tisane’s SDSL, variables have relationships that fall into two broad categories: (1) conceptual relationships that
describe how variables relate theoretically and (2) data measurement relationships that describe how the data was, or will
be, collected. Below, we define each of the relationships in Tisane’ SDSL and describe how Tisane internally represents
these relationships as a graph (as illustrated in Figure 3). Figure 4 shows the graph representation constructed from the
usage scenario.
 Tisane’s graph IR is a directed multigraph. Nodes represent variables, and directed edges represent relationships
between variables. Tisane internally uses a graph intermediate representation (IR) because graphs are widely used for
both conceptual modeling and statistical analysis, two sets of considerations that Tisane unifies.
 Tisane’s graph IR differs from two types of graphs used in data analysis: causal DAGs and path analysis diagrams.
Unlike causal DAGs, Tisane’s graph IR allows for non-causal relationships, moderating relationships (i.e., interaction
effects), and data measurement relationships that are necessary for inferring random effects. Unlike path analysis
diagrams that allow edges to point to other edges to represent interaction effects, Tisane represents interactions as
separate nodes and only allows nodes as endpoints for edges. These design decisions simplify our statistical model
inference algorithms and their implementation.

5.2.1 Conceptual relationships. Tisane’s SDSL supports three conceptual relationships: causes, associates with, and
moderates. Analysts can express that a variable causes or is associated with (but not directly causally related to)
another variable. Variables associated with the dependent variable, for example, may help explain the dependent variable
 11
To Appear, CHI 2022, USA Eunice Jun, Audrey Seo, Jeffrey Heer, and René Just even if the causal mechanism is unknown. If analysts are aware of or suspect a causal relationship, they should use causes. We chose to support both causal and associative relationships because formal causal DAGs are difficult for domain experts to specify [60, 61, 67], prior work has observed that researchers already use informal graphs that contain associative relationships when reasoning about their hypotheses and analyses [26], and GLMs/GLMMs can represent non-causal relationships. Finally, analysts can also express interactions where one (or more) variable (the moderating variables) moderates the effect of a moderated variable on another variable (the target variable). Mediation relationships (where one variable influences another through a middle variable) are another common conceptual relationship. Tisane does not provide a separate language construct for mediation because mediations are expressible using two or more causal relationships. Furthermore, mediation analyses require specific analyses, such as structural equation modeling [23], that are out of Tisane’s scope. In the graph IR, a causes relationship introduces a causal edge from one node, the cause, to another node, the effect (Figure 3(a)). Because a variable cannot be both the cause and effect of the same variable, any pair of nodes can only have one causal edge between them. Furthermore, from a formal causal analysis perspective, associations may indicate the presence of a hidden, unobserved variable that mediates the causal effect of a variable on another or that influences two or more variables simultaneously. Thus, rather than inferring or requiring analysts to specify hidden variables, which may be unknown and/or unmeasurable, the associates_with relationship introduces two directed edges in opposing directions, representing the bidirectionality of association (Figure 3(b)). A moderates relationship creates a new node that is eventually transformed into an interaction term in the model, introduces associative edges between the new interaction node and the target (variable) node, creates associative edges between the moderated variable’s node and the target node, and adds associative edges between the moderating variables’ nodes and the target node if there is not a causal or associative edge already (Figure 3(c)). Furthermore, each interaction node inherits the attribution edges from the nodes of the moderating variables that comprise it. This means that every interaction node is also the attribute of at least one unit.6 m1 (a) v1 v2 assoc. u causes u2 assoc. assoc. v1.causes(v2) (c) m1*m2 m3 (d) nests (e) has assoc. assoc. assoc. u1 m (b) v1 v2 assoc. assoc. m2 u1.nests_within(u2) u.has(m) v1.associates_with(v2) m1.moderates(m2, on=m3) Fig. 3. Code snippets of conceptual and data measurement relationships written in Tisane’s study design specification language and their representation in Tisane’s graph IR. Variables are named with u for units, m for measures, and v for data variables that can be either units or measures. All edges depicted are those that are added due to the relationship. In the moderates example, we assume that m1 and m2 both belong to the same unit, and for simplicity, the attribution edge (labeled as “has”) from m1 and m2’s unit is not shown. For more complex examples, see the supplemental materials. 6 In statistical terms, this means that within-level interactions have one unit while cross-level interactions may have two or more units. 12
Tisane: Authoring Statistical Models via Formal Reasoning from Conceptual and Data Relationships To Appear, CHI 2022, USA

5.2.2 Data measurement relationships. Study designs may have clusters of observations that need to be modeled
explicitly for external validity. For example, in a within-subjects experiment, participants provide multiple observations
for different conditions. An individual’s observations may cluster together due to a hidden latent variable. Such clustering
may be imperceptible during exploratory data visualization of a sample but can threaten external validity. GLMMs can
mitigate three common sources of clustering that arise during data collection [8, 19, 29]:
 • Hierarchies arise when one observational/experimental unit (e.g., adult) nests within another observational/-
 experimental unit (e.g., group). This means that each instance of the nested unit belongs to one and only one
 nesting unit (many-to-one).
 • Repeated measures introduce clustering of observations from the same unit instance (e.g., participant).
 • Non-nesting composition arises when overlapping attributes (e.g., stimuli, condition) describe the same
 observational/experimental unit (e.g., participant) [19].
 The above sources of clustering pose three problems for analysts. First, analysts must have significant statistical
expertise to identify when data observations cluster. Second, they must know how to mitigate these clusters in their
models. Third, with this knowledge, analysts must figure out how to express these types of clustering in their analytical
tools. Even if analysts are not able to identify clustered observations, they are knowledgeable about how data were
collected.
 Thus, Tisane addresses the three problems by (i) eliciting data measurement relationships from analysts to infer
clusters and (ii) formulating the maximal random effects structure, optimizing for external validity (Section 6). Below,
we describe language features for expressing data measurement relationships.

 Nesting relationships: Hierarchies. Hierarchies arise when a unit (e.g., an adult) is nested within another unit (e.g.,
an exercise group). Researchers may collect data with hierarchies to study individual and group dynamics together
or as a side effect of recruitment strategies. To express such designs, Tisane provides the nests_within construct.
Conceptually, nesting is strictly between observational/experimental units, so Tisane type checks that the variables that
nest are both Units. In the graph IR, a nesting relationship is encoded as an edge between two unit nodes (Figure 3(d)).
There is one edge from the nested unit (e.g., adult) to the nesting unit (e.g., group) 7 .

 Frequency of measures: Repeated measures, Non-nesting composition. When a measure is declared through a unit,
Tisane adds an attribution edge (“has’) from a unit node to a measure node (Figure 3(e)). A unit’s measure can be
taken one or more times in a study. The frequency of measurement is useful for detecting repeated measures and
non-nesting composition. In repeated measures study designs, each unit provides multiple values of a measure, which
are distinguished by another variable, usually time. Non-nesting [19] composition arises when measures describing
the same unit overlap. For example, HCI researchers studying input devices might design them to utilize different
senses (e.g., touch, sight, sound). Participants in the study may be exposed to multiple different devices, which act as
experimental conditions of senses. The conditions are intrinsically tied to the devices, and participants can be described
as having both conditions and devices, which overlap with one another. Such study designs introduce dependencies
between observations [7] and hence violate the assumption of independence that GLMs make.
 When analysts declare Measures, they specify the frequency of the observation through the number_of_instances
parameter. This parameter accepts an integer, variable, a Tisane Exactly operator, or a Tisane AtMost operator. By
default, the parameter is set to one. The Exactly operator represents the exact number of times a unit has a measure.
7 The code base contains examples with nesting relationships.
 13
To Appear, CHI 2022, USA Eunice Jun, Audrey Seo, Jeffrey Heer, and René Just

The AtMost operator represents the maximum number of times a unit has a measure. Both operators are useful for
specifying that a measure’s frequency depends on another variable, which is expressible through the per function. For
example, participants may use two devices per condition assigned: device = subject.nominal('Input device',
number_of_instances=ts.Exactly(2).per(condition)). The per function uses the Tisane variable’s cardinality
by default but can instead use a data variable’s number_of_instances by specifying use_cardinality=False as a
parameter to per. Moreover, specifying a measure’s number_of_instances to be an integer is syntactic sugar for using
the Exactly operator. Specifying a variable is syntactic sugar for expressing ts.Exactly(1).per(variable).
 To determine the presence of repeated measures or non-nesting composition, Tisane computes the number_of_instances
of measures and their relationship to other measures. Measures that are declared with number_of_instances equal to
one are considered to vary between-unit. Measures that are declared with number_of_instances greater than one
or a variable with cardinality greater than one are considered to vary within-unit as repeated measures. If there are
instances of a measure per another measure sharing the same unit, the measures are non-nesting.

 group member

 pounds_lost ass
 o c.

 ses
 cau ass
 oc
 condition . motivation

Fig. 4. The graph representation of the variables and relationships from the usage scenario. causes edges are labeled with “causes”.
associates_with edges are labeled with “assoc.” Dashed edges indicate nests_within relationships, and dotted edges indicate has
relationships.

6 STATISTICAL MODEL INFERENCE: INTERACTIVELY QUERYING THE GRAPH IR
After specifying variable relationships, analysts can query Tisane for a statistical model. Queries are constructed by
specifying a study design with a dependent variable (the value to be predicted) and a set of independent variables
(predictors). Tisane processes the query and generates a statistical model in four phases: (1) preliminary conceptual
checks that validate the study design, (2) inference of possible effects structures and family and link functions, (3) input
elicitation to disambiguate possible models, and (4) generation of a record of decisions during disambiguation and the
final executable script. Given that the interactive process begins with an input program using Tisane and outputs a
script for fitting a GLM or GLMM, we call this process interactive compilation.

6.1 Preliminary checks
At the beginning of processing a query, Tisane checks that every input study design is well-formed. This involves
two conceptual correctness checks. First, every independent variable (IV) in the study design must either cause or be
 14
Tisane: Authoring Statistical Models via Formal Reasoning from Conceptual and Data Relationships To Appear, CHI 2022, USA associated with the dependent variable (DV) directly or transitively. Second, the DV must not cause any of the IVs, since it would be conceptually invalid to explain a cause from any of its effects. If any of the above checks fail, Tisane issues a warning and halts execution. By using these two checks, the Tisane compiler avoids technically correct statistical models that have little to no conceptual grounding (DG1 - Conceptual knowledge). If the checks pass, Tisane proceeds to the next phase. 6.2 Candidate statistical model generation A GLM/GLMM is comprised of a model effects structure, family function, and link function. The model effects structure may consist of main, interaction, and random effects. Tisane utilizes variables’ conceptual relationships to infer candidate main and interaction effects and data measurement relationships to infer random effects. Tisane infers family and link functions based on the data type of the DV in the query. The candidate statistical models that Tisane generates based on the graph and query seeds an interactive disambiguation process. The purpose of identifying candidate main effects beyond the ones analysts may have specified is to provoke consideration of erroneously omitted variables that are conceptually relevant and pre-empt potential confounding and multicollinearity issues that may arise. 6.2.1 Deriving Candidate Main Effects. In a query to infer a statistical model, analysts specify a single dependent variable and a set of one or more IVs. After passing the checks described in subsection 6.1, the query’s independent variables are considered candidates. In addition, Tisane derives three additional sets of candidate main effects intended to control for confounding variables in the output statistical model8 . The first two sets below are from the “modified disjunctive cause criterion” [66]: • Causal parents. For each IV in the query, Tisane finds its causal parents (see Figure 5(a)). • Possible causal omissions. Tisane looks to see if any other variables not included as IVs cause the DV (see in Figure 5(b)). They are relevant to the DV but may have been erroneously omitted. • Possible confounding associations. For each IV, Tisane looks for variables that are associated with both the IV and the DV (see in Figure 5(c)). Because associations between variables can have multiple underlying causal structures, Tisane recommends variables with associative relationships with caution. Tisane issues a warning describing when not to include such a variable in the GUI (see Figure 3 in supplemental material). CP CP CP CME CME CME CME DV assoc. assoc. CME assoc. assoc. assoc. assoc. IV IV IV DV IV (a) causal parents (b) possible causal omissions (c) possible confounding associations Fig. 5. Graphs demonstrating causal parents, possible causal omissions, and possible confounding associations. In graphs (a) and (b) (left and middle), all edges are causal. Independent variables are marked “IV”, discovered candidate main effects “CME”, dependent variables “DV”, and causal parents “CP”. 8 Tisane currently treats each input IV as a separate “exposure” variable for which to identify confounders. Tisane then combines all confounders into one statistical model. 15
To Appear, CHI 2022, USA Eunice Jun, Audrey Seo, Jeffrey Heer, and René Just

 Using the above rules, Tisane suggests a set of variables that are likely confounders of the variables of interest
expressed in the query. There may be additional confounders due to unmeasured or unexpressed variables that are
either not known or excluded from the graph. Tisane never automatically includes the candidate main effects in the
output statistical model. Analysts must always specify a variable as an IV in the query or accept a suggestion (DG3 -
Guidance and control).
 If a graph only contains associates edges then the candidate main effects Tisane suggests are those that are directly
associated with both the DV and an IV. If a graph has only causal edges, Tisane would suggest variables that directly
cause the DV but were omitted from the query and the causal parents of IVs in case the parents exert causal influence
on the DV through the IV or another variable that is not specified.
 The total set of main effects, including variables the analyst has specified as IVs in their query and candidate main
effects, are used to derive candidate interaction effects and random effects, which we discuss next.

6.2.2 Deriving Candidate Interaction Effects. An interaction between variables means that the effect of one variable
(the moderated variable) on a target variable is moderated by another (non-empty) set of variables (the moderating
variables). Tisane’s SDSL already provides a primitive, moderates, to express interactions. As such, Tisane’s goal in
suggesting candidate interaction effects is to help analysts avoid omissions of conceptual relationships that are pertinent
to an analyst’s research questions or hypotheses (DG1 - Conceptual knowledge). Candidate interaction effects are the
interaction nodes whose (i) moderated and moderating variables include two or more candidate main effects and (ii)
target variable is the query’s DV.

6.2.3 Deriving Candidate Random Effects. Random effects occur when there are clusters in the data, which occur
when we have repeated measures, nested hierarchies, or non-nesting composition (as defined in Section 5.2.2). Tisane
implements Barr et al.’s recommendations for specifying the maximal random effects structure of linear mixed effects
models for increasing the generalizability of statistical results [2, 3].
 To derive random effects, Tisane focuses on the data measurement edges in the graph IR. Using the graph IR, Tisane
identifies unit nodes, looks for any nesting edges among them, and determines within- or between-subjects measures
based on the frequency of observations for units. From these, Tisane generates random intercepts of units for the unit’s
measures that are between-subjects as well as the unit’s measures that are within-subjects where each instance of the
unit has only one observation per value of another variable. Tisane generates random slopes of a unit and its measure
for all measures that are within-subjects where each instance of the unit has multiple observations per value of another
variable. For interaction effects, random slopes are included for the largest subset of within-subjects variables (see [2]).
Tisane handles correlation of random slopes and intercepts during disambiguation (section 6.3). Maximal random effects
may lead to model convergence issues that analysts address by later removing or adding independent variables and
random effects. Nevertheless, starting with a maximal, valid model is important for ensuring that future revisions are
also valid (DG2 - Validity).

6.2.4 Deriving Candidate Family and Link Functions. The DV’s data type determines the set of candidate family and
link functions. For example, numeric variables cannot have binomial or multinomial distributions. Similarly, nominal
variables are not allowed to have Gaussian distributions. Furthermore, each family has a set of possible link functions.
For example, a Gaussian family distribution may have an Identity, Log, or Square Root link function. The statistics
literature documents possible combinations of family and link functions for specific data types [41].
 16
You can also read