The Traffic Light Approach: Indicators and Algorithms to Identify Covid-19 Epidemic Risk Across Italian Regions
←
→
Page content transcription
If your browser does not render page correctly, please read the page content below
POLICY BRIEF
                                                                                                                                                   published: 16 March 2021
                                                                                                                                            doi: 10.3389/fpubh.2021.650243

                                              The Traffic Light Approach:
                                              Indicators and Algorithms to Identify
                                              Covid-19 Epidemic Risk Across
                                              Italian Regions
                                              Luca Paroni 1,2 , Clelia D’Apice 1,3 , Silvia Ussai 4*, Benedetta Armocida 1 ,
                                              Beatrice Formenti 1,5 , Lorenzo De Min 1 and Eduardo Missoni 1,6
                                              1
                                                Saluteglobale.It Associazione di Promozione Sociale, Brescia, Italy, 2 Istituto di Ricerche Farmacologiche Mario Negri Istituti
                                              di Ricovero e Cura a Carattere Scientifico, Milan, Italy, 3 Department of Medicine and Surgery, University of Parma, Parma,
                                              Italy, 4 Directorate General for Food and Health, European Commission, Brussels, Belgium, 5 Division of Infectious Diseases,
                                              Aziende Socio Sanitarie Territoriali Spedali Civili of Brescia, Brescia, Italy, 6 Center for Research on Health and Social Care
                                              Management (CERGAS), Bocconi University, Milan, Italy

                                              With the beginning of the autumn-winter season, Italy experienced an increase of
                                              SARS-CoV-2 cases, requiring the Government to adopt new restrictive measures.
                                              The national surveillance system in place defines 21 key process and performance
                                              indicators addressing for each Region/Autonomous Province: (i) the monitoring capacity,
                          Edited by:
                        Lara Lengel,
                                              (ii) the degree of diagnostic capability, investigation and contact tracing, and (iii) the
       Bowling Green State University,        characteristics of the transmission dynamics as well as the resilience of health services.
                       United States
                                              Overall, the traffic light approach shows a collective effort by the Italian Government to
                      Reviewed by:
                                              define strategies to both contain the spread of COVID-19 and to minimize the economic
                   Penrose Jackson,
       Vermont Public Health Institute,       and social impact of the epidemic. Nonetheless, on what principles color-labeled risk
                       United States          levels are assigned on a regional level, it remains rather unclear or difficult to track.
                 Alessandro Rovetta,
                  Mensana srls, Italy         Keywords: COVID-19, Italy, guideline, indicators, traffic light algorithms
                  *Correspondence:
                             Silvia Ussai
                ussai.silvia@gmail.com        With the beginning of the autumn-winter season, Italy experienced an increase of SARS-CoV-2
                                              cases, requiring the Government to adopt new restrictive measures (1). The national surveillance
                    Specialty section:        system has been implemented according to the Prime Ministerial Decree (DPCM) of November
          This article was submitted to       3, 2020 (2), the previous strategic documents for monitoring for the second wave (3, 4) and
                    Public Health Policy,     the DPCM of April 26, 2020 (5). The latter document defines 21 key process and performance
                a section of the journal      indicators addressing for each Region/Autonomous Province: (i) the monitoring capacity, (ii) the
              Frontiers in Public Health      degree of diagnostic capability, investigation and contact tracing, and (iii) the characteristics of the
          Received: 06 January 2021           transmission dynamics as well as the resilience of health services (Table 1) (5). Based on a weekly
         Accepted: 18 February 2021           assessment, each region is assigned to different levels of risk (high, medium, and low), which are
          Published: 16 March 2021            mapped using a “traffic light” color code (red, orange, and yellow). The criteria are compliant with
                              Citation:       the European Commission’s decision to adopt a common color code to provide strategy to restrict
         Paroni L, D’Apice C, Ussai S,        free movement across the European Union (6) and with the WHO frameworks (7).
 Armocida B, Formenti B, Min LD and
                                                  The complete algorithm is presented in Figure 1. The overall risk assessment is based on 21
    Missoni E (2021) The Traffic Light
 Approach: Indicators and Algorithms
                                              key process and performance indicators (Table 1). Either thresholds or comparative evaluation
   to Identify Covid-19 Epidemic Risk         are defined and monitored on a weekly basis by each region as part of the national integrated
                Across Italian Regions.       surveillance system.
       Front. Public Health 9:650243.             Indicators 1.1–1.6 are used for an initial assessment of the quality of the information collected.
    doi: 10.3389/fpubh.2021.650243            If a region has those indicators above threshold, it is automatically labeled as a high-risk region.

Frontiers in Public Health | www.frontiersin.org                                       1                                              March 2021 | Volume 9 | Article 650243
Paroni et al. Covid-19 Surveillance: Traffic Light Approach
TABLE 1 | List of the 21 Indicators as described in the DPCM of April 26.
Section N Indicator Threshold Alert Data source
Monitoring capacity 1.1 Number of symptomatic cases notified ≥60% with a growing trend; a 3 days ISS; COVID-19
(optional) of isolation Integrated
Surveillance
System with the
integration of
this variable
Ability to guarantee 2.4 Number, types of professional figures and Number and types of dedicated Number and types of Periodic report
adequate resources for time per person dedicated in each professionals dedicated to each dedicated professionals at (monthly)
contact-tracing, isolation territory to contact-tracing activity at local level local level reported as
and quarantine progressively aligned to inadequate on the basis of
recommended European recommending standards
standards at European level
(Continued)
Frontiers in Public Health | www.frontiersin.org 2 March 2021 | Volume 9 | Article 650243Paroni et al. Covid-19 Surveillance: Traffic Light Approach
TABLE 1 | Continued
Section N Indicator Threshold Alert Data source
2.5 Number, types of professional figures and
time per person dedicated in each
territorial service to the activities of
sampling/sending to the reference
laboratories and monitoring of close
contacts and cases placed, respectively
in quarantine and isolation
2.6 Number of confirmed cases in the Region Improving trend with final target
for which an appropriate epidemiological to 100%
investigation has been carried out with
investigation of close contacts/total of
new confirmed cases of infection
Transmission stability 3.1 Number of cases notified to civil Number of cases with Cases increasing in the last Ministry of
protection system in the last 14 days decreasing or stable weekly 5 days (% of weekly Health
trend increase with standard
thresholds to be used as
an “information
dashboard”). An increase in
the number of cases is
expected in the first 15–20
days after reopening. In
this phase, the warnings
from this indicator will be
evaluated together with
indicators 3.1 and 3.5 at
the regional level
3.2 Rt calculated on the basis of integrated Rt calculated on regional level Rt > 1 or not measurable ISS database/Rt
ISS surveillance (two indicators will be and ≤1 in all measured by
used. One based on date of onset of Regions/Autonomous Province Foundation
symptoms and the other based in phase 2A Bruno Kessler
hospitalization date)
3.3 Number of weekly cases notified to Number of cases with Cases increasing in the last ISS; Sentinel
(optional) sentinel COVID-net surveillance decreasing or stable trend 5 days (% of weekly COVID-net
increase with standard surveillance
thresholds to be used as
an “information
dashboard”). An increase in
the number of cases is
expected in the first 15–20
days after reopening. In
this phase, the warnings
from this indicator will be
evaluated together with
indicators 3.1 and 3.5 at
the regional level
3.4 Number of cases by diagnosis date and Decreasing or stable weekly Cases increased in the last ISS-COVID-19
symptom onset date reported to trend week. An increase in the integrated
COVID-19 integrated surveillance per day number of cases is surveillance
expected in the first 15–20 system
days after reopening. In
this alert, this indicator will
be evaluated jointly with
indicators 3.1 and 3.5 at
the regional level (% of
weekly increase with
standard thresholds to be
used as “information
dashboard”
(Continued)
Frontiers in Public Health | www.frontiersin.org 3 March 2021 | Volume 9 | Article 650243Paroni et al. Covid-19 Surveillance: Traffic Light Approach
TABLE 1 | Continued
Section N Indicator Threshold Alert Data source
3.5 Number of new transmission outbreaks Non-increase the number of Evidence of new outbreaks ISS-Monitoring
(2 or more epidemiologically linked cases active transmission outbreaks in in the last 7 days, of outbreaks and
or an unexpected increase in the number the Region; Absence of particularly in nursing red zones with
of cases in a defined time and place) transmission outbreaks on the homes, retirement homes, survey cards OR
regional territory for which a risk hospitals or other places ISS-Integrated
assessment was not quickly hosting vulnerable Surveillance
carried out and the opportunity populations. (using as a
to establish a sub-regional “red Presence of new local variable the point
zone” evaluated outbreaks in the region of exposure and
requires an ad-hoc risk defying a local
evaluation in order to outbreak ID)
evaluate if in the regional
area there is a substantial
and spread transmission
which would require to
return on phase 1
≥90% of responding facilities 30% Ministry of
care services occupancy rate of COVID-19 patients Health—
Platform for daily
detection of
beds/Civil
Protection
system
admissions data
3.9 Total medical area beds occupancy rate ≤40% >40%
of COVID-19 patients
Frontiers in Public Health | www.frontiersin.org 4 March 2021 | Volume 9 | Article 650243Paroni et al. Covid-19 Surveillance: Traffic Light Approach
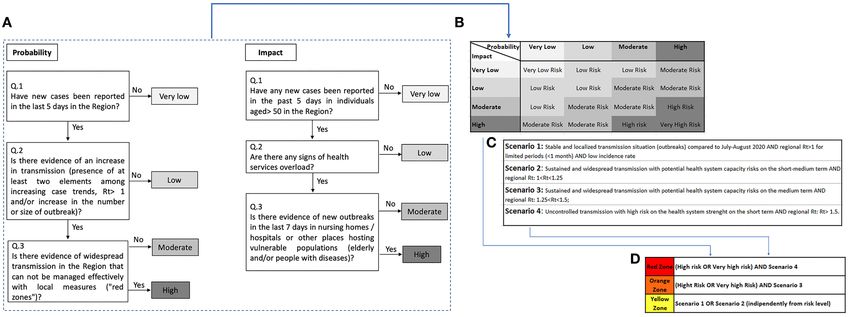
FIGURE 1 | Complete algorithm. (A) Probability and Impact risk evaluation of COVID-19 pandemic from phase 1 to phase 2A in Italy based on the 21 indicators
described in the DPCM from April 26. (B) Risk assessment matrix combination of probability and impact evaluation as described in the decree of the Ministry of
Health. (C) Description of the four scenarios based on the strategic document developed by the Ministry of Health and ISS on the evolution of strategy and planning in
the COVID-19 transition phase for the autumn-winter season (4). (D) Definition of the red, orange, and yellow areas based on the decree of the Ministry of health from
November 3.
If a region complies with the threshold, two algorithms outlined either in their meaning or in the proposed threshold
are used in order to evaluate the epidemic probability risk (indicators 2.1, 2.4, 2.5, 2.6, 3.1–3.6); (2) the two algorithms
and epidemic impact risk (Figure 1A). Indicators used to of probability and impact risk assessment do not report
evaluate the probability risk range from 3.1 to 3.7, while which specific indicators are used to assess the four questions
indicators used to evaluate the impact risk range from 3.1 (Figure 1A); (3) overall, the information needed to define the
to 3.9 (5). A risk assessment matrix (RAM) based on the entire algorithm is fragmented in different documents (2–5); (4)
probability and impact risk defines the risk level as: very although the 21 indicators have been defined in the DPCM of
low, low, moderate, high, and very high (Figure 1B). An April 26 (5), the related weekly reports started being described
additional classification of the level of risk has been defined on a regional basis only from October 26 (8); (5) potential
assuming four possible scenarios based on the reproductive enforcement of the risk assessment algorithm by local regional
number (Rt) (Table 1—indicator 3.2) as described in regulation. As an example, the administration of the Abruzzo
Figure 1C (3). Region, which was on a Red risk level until December 5, decided
For each region, the combination of RAM and the four to unilaterally self-declare on an orange risk level despite
possible scenarios defines the overall high, medium and low risk, the Italian central Government did not allow the shift until
which is color coded as red, orange, and yellow (2) (Figure 1D). December 12 (9).
A region is considered red when the RAM is equal to very high The traffic light approach shows a collective effort
risk or high risk and complies with Scenario 4; orange when by the Italian Government to define strategies to both
the RAM is equal to very high risk or high risk and complies contain the spread of COVID-19 and to minimize the
with Scenario 3; and yellow when it is in Scenario 1 or Scenario economic and social impact of the epidemic. Nonetheless,
2, independently from the RAM results. From December 6 on what principles color-labeled risk levels are assigned
until December 12, the overall distribution of the Regions on a regional level, it remains rather unclear or difficult
and Autonomous Provinces was as follows: 12 color-coded as to track.
yellow areas, eight color-coded as orange areas, and one as
red area.
The risk assessment method outlined by the Italian AUTHOR CONTRIBUTIONS
Government is in line with the WHO and European Commission
frameworks (6, 7). Although detailed indicators and the risk All authors listed have made a substantial, direct and
assessment process were defined, we draw attention to the intellectual contribution to the work, and approved it
following critical issues: (1) some indicators are not clearly for publication.
Frontiers in Public Health | www.frontiersin.org 5 March 2021 | Volume 9 | Article 650243Paroni et al. Covid-19 Surveillance: Traffic Light Approach
REFERENCES 6. European Commission Statement on the Coordination of Measures Restricting
Free Movement in the European Union Related to the Coronavirus Pandemic.
1. Decreto del Presidente del Consiglio dei ministri. Ulteriori disposizioni Available online at: https://ec.europa.eu/commission/presscorner/detail/en/
attuative del decreto-legge 25 marzo 2020, n. 19, convertito, con modificazioni, statement_20_1871 (accessed December 11, 2020).
dalla legge 25 maggio 2020, n. 35, recante ≪Misure urgenti per fronteggiare 7. World Health Organization. COVID-19 Strategic Preparedness and Response
l’emergenza epidemiologica da COVID-19≫, e del decreto-legge 16 maggio Plan. Country Preparedness and Response Status for COVID-19. (2020).
2020, n. 33, convertito, con modificazioni, dalla legge 14 luglio 2020, n. 74, Available online at: https://www.who.int/publications/i/item/strategic-
recante ≪Ulteriori misure urgenti per fronteggiare l’emergenza epidemiologica preparedness-and-response-plan-for-the-new-coronavirus (accessed
da COVID-19≫. (2020). Available online at: https://www.gazzettaufficiale.it/ December 8, 2020).
eli/gu/2020/10/25/265/sg/pdf (accessed December 8, 2020). 8. Ministry of Health of Italy. Nuovo Coronavirus. Notizie–Report
2. Decreto del Presidente del Consiglio dei ministri. Ulteriori disposizioni settimanale Covid-19. Available online at: http://www.salute.gov.it/portale/
attuative del decreto-legge 25 marzo 2020, n. 19, convertito, con modificazioni, nuovocoronavirus/archivioNotizieNuovoCoronavirus.jsp?lingua=italiano&
dalla legge 25 maggio 2020, n. 35, recante ≪Misure urgenti per fronteggiare tipo=Report$\pm$settimanale$\pm$Covid-19&btnCerca=cerca (accessed
l’emergenza epidemiologica da COVID-19≫, e del decreto-legge 16 maggio December 8, 2020).
2020, n. 33, convertito, con modificazioni, dalla legge 14 luglio 2020, n. 74, 9. Regione Abruzzo. Ordinanza del presidente della giunta regionale N.106
recante ≪Ulteriori misure urgenti per fronteggiare l’emergenza epidemiologica del 6 Dicembre 2020. Ulteriori misure urgenti per la prevenzione e gestione
da COVID-19≫. (2020). Available online at: https://www.gazzettaufficiale.it/ dell’emergenza epidemiologica da COVID-2019. Available online at: https://
eli/gu/2020/11/04/275/so/41/sg/pdf (accessed December 8, 2020). www.regione.abruzzo.it/system/files/atti-presidenziali/ordinanze/2020/opgr-
3. Prevenzione e risposta a COVID-19: evoluzione della strategia e pianificazione 106-2020.pdf (accessed December 8, 2020).
nella fase di transizione per il periodo autunno-invernale. Roma: Ministero della
Salute, Istituto Superiore di Sanità (2020). Available online at: https://www. Conflict of Interest: The authors declare that the research was conducted in the
trovanorme.salute.gov.it/norme/renderNormsanPdf?anno=2020&codLeg= absence of any commercial or financial relationships that could be construed as a
76597&parte=1%20&serie=null (accessed December 8, 2020). potential conflict of interest.
4. Principi di monitoraggio del rischio sanitario. Available online at: https://www.
lavoripubblici.it/documenti2020/lvpb2/Allegato_10_dpcm_26_04_2020.pdf Copyright © 2021 Paroni, D’Apice, Ussai, Armocida, Formenti, Min and Missoni.
(accessed December 8, 2020). This is an open-access article distributed under the terms of the Creative Commons
5. Emergenza COVID-19: attività di monitoraggio del rischio sanitario connesse Attribution License (CC BY). The use, distribution or reproduction in other forums
al passaggio dalla fase 1 alla fase 2A di cui all’allegato 10 del DPCM. is permitted, provided the original author(s) and the copyright owner(s) are credited
(2020). Available online at: https://www.trovanorme.salute.gov.it/norme/ and that the original publication in this journal is cited, in accordance with accepted
renderNormsanPdf?anno=2020&codLeg=77099&parte=1%20&serie=null academic practice. No use, distribution or reproduction is permitted which does not
(accessed December 8, 2020). comply with these terms.
Frontiers in Public Health | www.frontiersin.org 6 March 2021 | Volume 9 | Article 650243You can also read


