The role of Interferometric Synthetic Aperture Radar in Detecting, Mapping, Monitoring, and Modelling the Volcanic Activity of Piton de la ...
←
→
Page content transcription
If your browser does not render page correctly, please read the page content below
remote sensing
Review
The role of Interferometric Synthetic Aperture Radar
in Detecting, Mapping, Monitoring, and Modelling
the Volcanic Activity of Piton de la Fournaise,
La Réunion: A Review
Nicole Richter 1,2, * and Jean-Luc Froger 3
 1    Institut de Physique du Globe de Paris, Université de Paris, CNRS, 75005 Paris, France
 2    Observatoire Volcanologique du Piton de la Fournaise, Institut de physique du globe de Paris,
      97418 La Plaine des Cafres, France
 3    IRD, OPGC, Université Clermont Auvergne, CNRS, 63000 Clermont-Ferrand, France;
      J.L.Froger@opgc.univ-bpclermont.fr
 *    Correspondence: richter@ipgp.fr

 Received: 31 December 2019; Accepted: 10 March 2020; Published: 22 March 2020

 Abstract: Synthetic Aperture Radar (SAR) remote sensing plays a significant role in volcano monitoring
 despite the measurements’ non real-time nature. The technique’s capability of imaging the spatial
 extent of ground motion has especially helped to shed light on the location, shape, and dynamics
 of subsurface magmatic storage and transport as well as the overall state of activity of volcanoes
 worldwide. A variety of different deformation phenomena are observed at exceptionally active
 and frequently erupting volcanoes, like Piton de la Fournaise on La Réunion Island. Those offer a
 powerful means of investigating related geophysical source processes and offer new insights into
 an active volcano’s edifice architecture, stability, and eruptive behavior. Since 1998, Interferometric
 Synthetic Aperture Radar (InSAR) has been playing an increasingly important role in developing
 our present understanding of the Piton de la Fournaise volcanic system. We here collect the most
 significant scientific results, identify limitations, and summarize the lessons learned from exploring
 the rich Piton de la Fournaise SAR data archive over the past ~20 years. For instance, the technique
 has delivered first evidence of the previously long suspected mobility of the volcano’s unsupported
 eastern flank, and it is especially useful for detecting displacements related to eruptions that occur far
 away from the central cone, where Global Navigation Satellite System (GNSS) stations are sparse.
 However, superimposed deformation processes, dense vegetation along the volcano’s lower eastern
 flank, and turbulent atmospheric phase contributions make Piton de la Fournaise a challenging
 target for applying InSAR. Multitemporal InSAR approaches that have the potential to overcome
 some of these limitations suffer from frequent eruptions that cause the replacement of scatterers.
 With increasing data acquisition rates, multisensor complementarity, and advanced processing
 techniques that resourcefully handle large data repositories, InSAR is progressively evolving into
 a near-real-time, complementary, operational volcano monitoring tool. We therefore emphasize
 the importance of InSAR at highly active and well-monitored volcanoes such as Mount Etna, Italy,
 Kı̄lauea Volcano, Hawai’i, and Piton de la Fournaise, La Réunion.

 Keywords: Piton de la Fournaise; volcano deformation; Synthetic Aperture Radar; InSAR;
 multitemporal InSAR

1. Introduction
     Magma movement through volcanic edifices is usually accompanied by measurable indicators
of volcanic unrest, the most reliable of which are seismicity, gas emissions, and surface deformation.

Remote Sens. 2020, 12, 1019; doi:10.3390/rs12061019                         www.mdpi.com/journal/remotesensing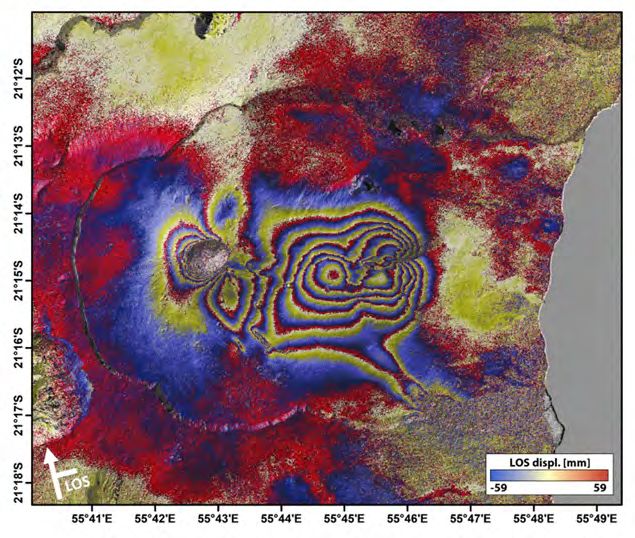
Remote Sens. 2020, 12, 1019                                                                        2 of 29

Characterizing and better understanding the subsurface processes in terms of their spatio-temporal
dynamics therefore requires natural study sites that are (a) highly active and (b) well-monitored over
long time periods by a dense network of instrumentation. Frequently erupting and closely monitored
volcanic systems serve as natural laboratories for studying subsurface magmatic transport and
storage systems, identifying and better understanding long-term and short-term eruption precursors,
and constraining related volcanic hazards.
      With one eruption every eight months on average over a ~50 year period [1,2], and operational
monitoring employed since late 1979, Piton de la Fournaise, La Réunion, is undoubtedly one of the
most active and best-studied basaltic hot-spot ocean island volcanoes on Earth [3]. Compared to
other volcanic settings, Piton de la Fournaise seems a fairly intelligible volcanic system. The volcano
formed on the eastern flank of its larger neighbor Piton des Neiges (3069 m), a piggyback set-up
that gives direction of gravitational spreading of the Piton de la Fournaise volcanic edifice towards
the unsupported eastern flank [4]. Measurable surface deformation and/or (sometimes catastrophic)
topographic changes in the volcano’s past provide evidence of internal structural adjustments that
occur as a result of the edifice’s growth.
      The most characteristic topographic feature of Piton de la Fournaise volcano is a prominent
east-facing, u-shaped, and steep Enclos Grand Brûlé collapse structure (extending ~8 km N–S and
~13 km W–E, cf. Figure 1), the upper part of which is referred to as the Enclos Fouqué caldera, while the
steep upper slopes are known as the Grandes Pentes, and the lower slopes as the Grand Brûlé (Figure 1).
While the true origin of the collapsed structure remains controversial, the Enclos Fouqué seems to at
least partially result from vertical collapse(s), while the Grandes Pentes and the Grand Brûlé have been
affected by lateral flank failure that occurred about 4500 years ago [5–15]. The Enclos Fouqué caldera
hosts the currently active volcanic center, a 400-m-high central cone with its two deep summit craters,
Bory and Dolomieu. The volcano’s interior has been imaged down to a depth of about 10 km by means
of geophysical data (Figure 1), and it can be roughly described as a pile of poorly consolidated eruption
deposits that host a shallow plumbing system consisting of several intermittently connected magma
reservoirs, the shallowest of which is located at ~2–2.5 km depth below the summit craters [1,16].
This is the central magmatic storage from which most of the laterally propagating dikes feeding recent
eruptions are initiating or passing through. Three major rift zones are radiating North–East (NE),
South–East (SE), and in 120◦ from the central cone, and function as preferred zones of magmatic
intrusions (Figures 1 and 2) [3]. Seismicity related to volcanic activity at Piton de la Fournaise is
generally small in magnitude (below magnitude 3, cf. Figure 1) [17]. Underneath the eastern flank
of the volcano, seismic events are sparse compared to the number of volcano tectonic (VT) events
recorded below the central cone, and they occur in a few seismic clusters (Figure 1). Several tectonic
structures have been identified from seismicity and deformation [13,18,19], but not much structural
evidence of compression exists along the volcano’s spreading flank [3].
      The volcano has erupted frequently throughout the past 20 years. Following a rest period of
more than five years, the eruptive activity of Piton de la Fournaise resumed on 9 March 1998 [20].
From then until 2007 continuous refilling of the plumbing system had been observed, and short-term
eruptive cycles pre-dominated the volcano’s eruptive pattern and culminated in more important distal
eruptions. During the major 30 March to 1 May 2007 distal eruption that excelled common Piton de la
Fournaise eruptions by an order of magnitude in terms of lava flow volume, the Dolomieu summit
crater collapsed. This event destroyed the upper reservoir and distribution system and changed the
eruptive behavior of the volcano. Between 2008 and 2010 only low-volume summit or near-summit
eruptions and many intrusions occurred. This was followed by a rest period of 41 months between
2011 and June 2014 before another phase of nearly continuous refilling and high activity began [21],
which is ongoing as of 31 December 2019.
Remote Sens. 2020, 12, 1019 3 of 29
Remote Sens. 2019, 11, x FOR PEER REVIEW 3 of 29
.
Figure 1. The location and timing of all located seismic events of a minimum magnitude of −0.6 that
were recorded
Figure 1. The on the Piton
location andde la Fournaise
timing Volcanological
of all located Observatory
seismic events (OVPF) network
of a minimum magnitudebetween
of -0.6early
that
March 1996 and early
were recorded on theSeptember
Piton de 2019 (marked Volcanological
la Fournaise by colored dots)Observatory
plotted onto(OVPF)
the shaded relief of
network Piton
between
de la Fournaise
early March 1996 volcano withSeptember
and early the approximate location
2019 (marked byof the three
colored main
dots) rift zones
plotted (shaded
onto the shaded areas).
relief
The profiles A-B and A’-B’ illustrate the depths of the seismic events and show clusters
of Piton de la Fournaise volcano with the approximate location of the three main rift zones (shaded of increased
seismic
areas). activity within
The profiles theand
A-B volcano’s interior. Inset
A’-B’ illustrate shows of
the depths thethe
location
seismicof events
Piton de la Fournaise
and show clusters(PdF) of
and Piton des Neiges (PdN) on La Réunion Island (OVPF-IPGP).
increased seismic activity within the volcano’s interior. Inset shows the location of Piton de la
Fournaise (PdF) and Piton des Neiges (PdN) on La Réunion Island (OVPF-IPGP).
Deformation monitoring at Piton de la Fournaise started in 1980 with the installation of (initially
only aThefew) permanent
volcano tiltmeters
has erupted and extensometers,
frequently throughout the as well
past as
20 ayears.
frequently
Following measured
a rest levelling
period of
network, all of which were employed and are operated by the Institut
more than five years, the eruptive activity of Piton de la Fournaise resumed on March de Physique du Globe de Paris
9, 1998 [20].
(IPGP) through the Piton de la Fournaise Volcanological Observatory (OVPF). The
From then until 2007 continuous refilling of the plumbing system had been observed, and short-term monitoring network
had been cycles
eruptive progressively improved
pre-dominated theinvolcano’s
order to eruptive
sample the volcano’s
pattern deformationinfield
and culminated morethoroughly
important
in
distal eruptions. During the major 30 March to 1 May 2007 distal eruption that excelled network
time and space. In 2004 a first telemetered Global Navigation Satellite System (GNSS) common
was employed, and in 2007 the deformation monitoring network at Piton
Piton de la Fournaise eruptions by an order of magnitude in terms of lava flow volume, the de la Fournaise included
8Dolomieu
continuoussummit
tiltmeters, 4 continuous
crater collapsed. extensometers, and 12 continuous
This event destroyed the upperGPS stations
reservoir [22].
and As of the
distribution
time of writing, ground deformation is measured by 21 permanent GNSS stations
system and changed the eruptive behavior of the volcano. Between 2008 and 2010 only low-volume (in fact, 24 including
three
summitstations that are noteruptions
or near-summit shown onand the many
map: intrusions
“REUN”, which is located
occurred. about
This was 15.5 km
followed bynorthwest of
a rest period
the central volcanic cone, “TRCG”, and “FEUG” that are also located outside
of 41 months between 2011 and June 2014 before another phase of nearly continuous refilling andof the caldera) in addition
to 9 tiltmeters
high (plus one
activity began [21],additional tiltmeter as
which is ongoing “RER”
of 31that is located
December about 8 km northeast of the summit
2019.
cone and is not shown
Deformation on the map),
monitoring 3 extensometers,
at Piton and a started
de la Fournaise networkinof 1980
75 stainless
with the steelinstallation
benchmarks of
that are surveyed by GNSS campaigns immediately after eruptions (Figure
(initially only a few) permanent tiltmeters and extensometers, as well as a frequently measured 2). While permanently
installed
levellingground-based
network, all instrumentation
of which were employed delivers point-wise, highly precise,
and are operated by theand continuous
Institut records du
de Physique of
surface displacements in real-time and 3D, Interferometric Synthetic Aperture
Globe de Paris (IPGP) through the Piton de la Fournaise Volcanological Observatory (OVPF). The Radar (InSAR) sheds
monitoring network had been progressively improved in order to sample the volcano’s deformation
field thoroughly in time and space. In 2004 a first telemetered Global Navigation Satellite System
(GNSS) network was employed, and in 2007 the deformation monitoring network at Piton de la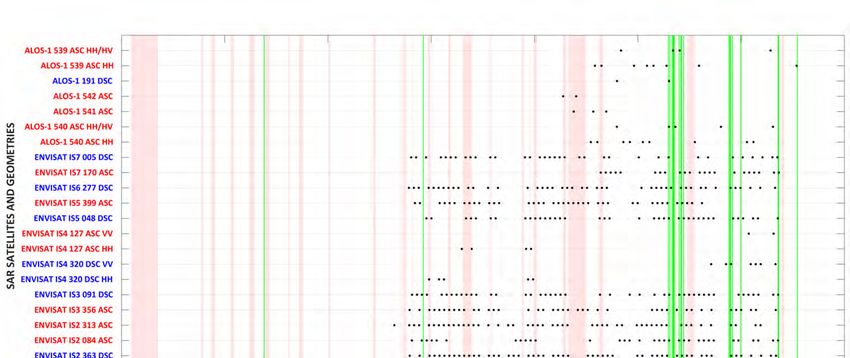
located about 15.5 km northwest of the central volcanic cone, “TRCG”, and “FEUG” that are also
located outside of the caldera) in addition to 9 tiltmeters (plus one additional tiltmeter “RER” that is
located about 8 km northeast of the summit cone and is not shown on the map), 3 extensometers,
and a network of 75 stainless steel benchmarks that are surveyed by GNSS campaigns immediately
afterSens.
Remote eruptions (Figure 2). While permanently installed ground-based instrumentation delivers
2020, 12, 1019 4 of 29
point-wise, highly precise, and continuous records of surface displacements in real-time and 3D,
Interferometric Synthetic Aperture Radar (InSAR) sheds light on the spatial extent of ground
light on the spatial extent of ground movements over large areas and at a high measurement point
movements over large areas and at a high measurement point density throughout a volcano’s
density throughout a volcano’s eruption cycle.
eruption cycle.
Figure 2. The ground deformation monitoring network of OVPF plotted onto the shaded relief of Piton
deFigure 2. The ground
la Fournaise volcanodeformation monitoringlocation
with the approximate network of of
theOVPF
three plotted
main rift onto the (shaded
zones shaded relief
areas).of
Piton de la
Permanent Fournaise
GNSS stationsvolcano with as
are marked theblack
approximate
triangles,location
tiltmetersof as
the three
blue main extensometers
squares, rift zones (shadedas
areas).stars,
yellow Permanent GNSS stations
and stainless-steel benchmarksare marked
as red dots.as Station
black triangles,
names ending tiltmeters
with “G” as are
blue squares,
indicative
ofextensometers
GNSS stations, asstation
yellow names
stars, and stainless-steel
ending with “I” arebenchmarks
indicativeasofred dots. Station
tiltmeters, names
station namesending with
ending
“G”“X”
with areare
indicative
indicative ofofGNSS stations, station
extensometers; the firstnames endingofwith
three letters “I” name
a station are indicative
representofthe tiltmeters,
station
station names
location. Two GNSS ending with were
stations “X” are indicative
offline of extensometers;
at the time of writing andthe firstitalicized
have three letters
labelsof(OVPF-IPGP).
a station name
represent
All Syntheticthe station Radar
Aperture location. Two
(SAR) dataGNSS stations
described were
in this offline at cover
publication the time of writing
the entire Enclosand have
Grand
italicized
Brûlé labels
collapse (OVPF-IPGP).
structure, except All
for Synthetic
COSMO-SkyMed Aperture(CSK) Radarand(SAR) data described
TerraSAR-X (TSX) in this publication
SpotLight (SPT)
cover
data, thethe entire
spatial Enclos of
coverages Grand
whichBrûlé collapse by
are indicated structure, except for
solid (ascending, ASC) COSMO-SkyMed (CSK) and
and dashed (descending,
DSC) orange and
TerraSAR-X (TSX)light green frames,
SpotLight (SPT)respectively. Throughout
data, the spatial coveragesthis publication,
of which are allindicated
maps feature the
by solid
exact same map
(ascending, ASC)extent
and(wherein
dashedNorth is up), except
(descending, DSC)for Figureand
orange 8, which
lightcovers
greenthe area indicated
frames, by
respectively.
the white solidthis
Throughout frame.publication, all maps feature the exact same map extent (wherein North is up),
except for Figure 8, which covers the area indicated by the white solid frame.
The first SAR image acquired of Piton de la Fournaise volcano dates back to 1996 [23], and since
the beginning
The firstof
SARsystematic ASAR acquisitions
image acquired inFournaise
of Piton de la 2003, SARvolcano
satellitedates
data back
are routinely collected
to 1996 [23], in
and since
the
theframework
beginning ofof the Indian Ocean
systematic ASAR InSAR Observatory
acquisitions in 2003,(OI2), an Observation
SAR satellite data areService of the
routinely Frenchin
collected
National Service of Volcanological Observation (INSU/CNRS), and processed at the
the framework the Indian Ocean InSAR Observatory (OI2), an Observation Service of the French Observatoire de
Physique du Globe at Clermont-Ferrand (OPGC). In addition, since late-2017, OVPF
National Service of Volcanological Observation (INSU/CNRS), and processed at the Observatoire has operational
InSAR and multitemporal
de Physique du Globe InSAR (MT-InSAR) processing
at Clermont-Ferrand (OPGC). capacities on site,
In addition, andlate-2017,
since processing is done
OVPF has
with a focus on the long-term assessment of the volcano’s eastern flank stability.
operational InSAR and multitemporal InSAR (MT-InSAR) processing capacities on site, and All SAR data cover
the entire Enclos Grand Brûlé collapse structure, except for COSMO-SkyMed (CSK) and TerraSAR-X
(TSX) SpotLight (SPT) data (the spatial coverages of which are indicated by orange and light green
frames in Figure 2, respectively). Details on available SAR data and archives are provided in the
following Section 2. The combination of both InSAR and the permanent ground monitoring network
with additional extensive geodetic benchmark campaigns has been essential to constrain models and
improve our understanding of the inner architecture and long-term eruptive behavior of Piton de la
Fournaise volcano (Section 3).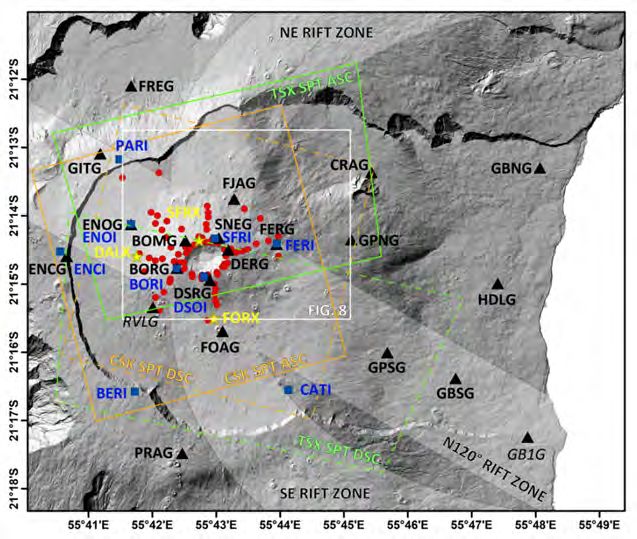
Remote Sens. 2020, 12, 1019                                                                        5 of 29

2. SAR Data and SAR Data Archives
     The most important SAR data archive for Piton de la Fournaise volcano is the OI2 scientific
database that has been developed in order to support both the semi-operational InSAR monitoring of
Piton de la Fournaise volcano and the scientific exploitation of long InSAR time series. The OI2 SAR
data archive holds 1835 SAR scenes acquired since September 2000 by 8 different SAR satellite systems
or constellations (and a total of 13 different satellites) as of 31 December 2019 (Figure 3 and Table 1).
In addition, InSAR products such as interferograms and coherence maps dating back to May 2003 are
also kept within the OI2 database. All data stored within OI2 are available through a dedicated web
interface named CASOAR [24]. The data have been immensely valuable to image and study 52 of
the 58 eruptions that occurred since 9 March 1998 (Figure 3). While access to most of the raw data
has to be restricted due to the data policies of the responsible space agencies, derived data products
are downloadable in geotiff format by registered users. A mirror archive of OI2 has been developed
locally at OVPF, ensuring on-site processing and analysis as well as OI2 data and product backup.
Even though SAR scenes cannot be distributed through CASOAR, the online platform provides an
almost complete listing of all SAR data acquired at Piton de la Fournaise volcano since 2003 (Figure 3
and Table 1). A number of SAR images that were acquired before the development of OI2 are not
centrally stored and are, therefore, harder to access for the community. While comprehensiveness is
anticipated, not all SAR data acquired since 2003 at Piton de la Fournaise volcano are yet included
within the OI2 database. For example, CNES routinely acquired ENVISAT ASAR swath 4 data on
both ascending and descending tracks that are not stored within OI2. Also, several Radarsat-1 images
may exist that are not maintained within the central archive OI2, and certainly more CSK and ALOS2
images exist than the ones OI2 is holding. Moreover, the German Aerospace Center (DLR) is operating
the TanDEM-X satellite (TDX) as a TSX add-on for the collection of digital elevation measurements
and the generation of a global digital elevation model (DEM). For this purpose, bistatic SAR data are
being acquired in a way that one satellite is transmitting the electromagnetic signal while both TSX
and TDX satellites are receiving the echoes simultaneously. Over Piton de la Fournaise volcano, a total
of 211 such Co-SSC scenes were acquired before the end of the year 2019, which are listed in Table 1
(but not included in Figure 3). However, not all of them are stored in OI2. Most of the data maintained
within the OI2 archive were obtained through data proposals in response to the Space Agencies’
announcements of opportunity (AOs). Because data contingents offered through these AOs are usually
limited to a certain number of images or to a specific time window, the temporal density of acquisitions
often remains below the capacities of the satellite systems. Another source of SAR data are the open
archives of the space agencies. For example, archive data acquired by “old generation” (i.e., out of
order) satellites, such as ESA’s ENVISAT, and JAXA’s ALOS-1 SAR systems, are now freely available
through these space agencies. For the restricted archives, like RADARSAT, CSK, and TSX, data can be
purchased, even if no AOs are open for proposal submissions. For example, the COFUR prices for
TSX data for scientific use vary between 200 €/scene (for 1–30 scenes) and 160 €/scene (for >100 scenes)
(according to prices listed under https://sss.terrasar-x.dlr.de). Likewise, a CSK StripMap (SM) HIMAGE
interferometric datastack of at least 5 scenes over the same area in a twelve-month’ time period can be
purchased for 1000 €/scene from e-GEOS. From a scientific point of view, data policies represent strong
constraints that explain why data archives, at Piton de la Fournaise and other volcanoes worldwide,
may not be complete. The fact that La Réunion is an isolated island located in the Indian Ocean is
both an advantage and a drawback: On the one hand, there are generally few acquisition requests
before or after the satellite flyover of La Réunion, which makes scheduling conflicts unlikely and
rare. On the other hand, the SAR instruments on board the satellites are likely to stay on standby
mode during the entire Indian Ocean flyover when no acquisitions are explicitly requested. Therefore,
not many background acquisitions are being acquired over La Réunion Island. As for many other
isolated volcanic ocean islands, no ERS1 or ERS2 data have been acquired as the satellites were not
equipped with large onboard storage capacities and because any real time data downlink station was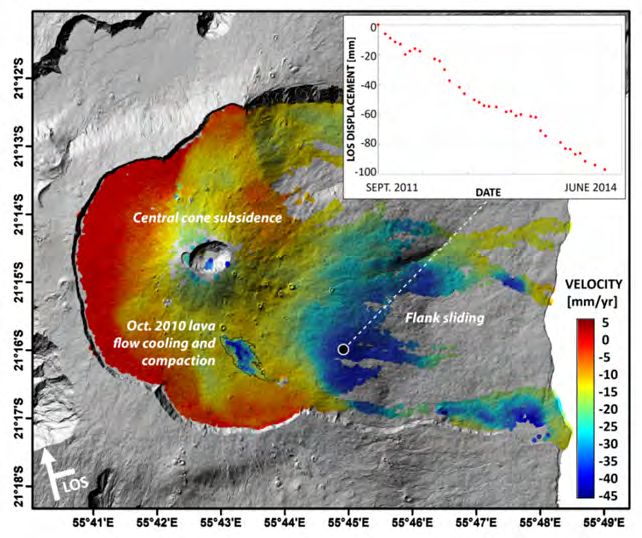
Remote Sens. 2020, 12, 1019                                                                            6 of 29

too far from the island at the time. Likewise, no ENVISAT ASAR swath 1 data have ever been acquired
at Piton de la Fournaise since those had unfavorable viewing geometries.
      Especially the new generation SAR satellite systems (Figure 3b) deliver high-resolution and
high-quality data with acquisition designs that are optimized for InSAR applications. For instance,
the separation of SAR scenes in space (represented by the normal baseline “Bn”) is usually kept below
critical distances that would cause coherence loss (Figure 4). This is oftentimes achieved by flying the
satellites within orbital tubes and/or by operating satellite constellations of the same kind of SAR systems.
Resolutions, both temporal and spatial, are continuously improving, and dedicated SAR satellite
modes for one and/or the other preference are available. Some space agencies allow target-specific
tasking of future acquisitions (oftentimes following a successful data proposal), ensuring data takes
with the most suitable acquisition modes, geometries, and timings.
      Since 2007, the most commonly used SAR sensors at Piton de la Fournaise are the ones aboard the
TSX and CSK (X-band), Sentinel-1 (S1) (C-Band), and ALOS-2 (ALOS2) (L-Band) satellites (Figure 3b).
Combining these data allows taking advantage of the individual strength of the satellite systems.
The two S1 (S1A and S1B) satellites, for example, are reliably collecting data every 6 days (in different
sensor modes), which are available to registered data users right upon acquisition and distributed free of
charge. This makes the system closest to near-real time data availability today. However, in particular S1
TOPS/IW data have comparably coarse pixel spacing (Table 1), which may cause surface displacement
patterns to be less clearly defined. TSX and CSK provide better spatial resolutions, but the X-band
becomes saturated faster with respect to displacement gradients, and the data underlie more difficult
distribution policies and restrictions. ALOS2 SPT data combine both high spatial and potentially high
temporal sampling, and they feature a better overall coherence over vegetated areas (L-band) (Figure 4)
as well as a lower sensitivity that allows for near-field displacement detection. Those data, though, are
often delivered with longer delays.
      InSAR-derived deformation measurements at Piton de la Fournaise are in overall agreement with
GNSS data, as closely investigated and proven by Peltier et al. [25]. The average annual coherences in
X-band, C-band, and L-band at Piton de la Fournaise volcano are sufficient for InSAR applications
(Figure 4). Except for vegetated areas along the volcano’s eastern flank, the steep walls of the caldera,
the two summit craters, and newly emplaced lava flows, coherence in all three bands remains high
within the Enclos Grand Brûlé collapse structure and throughout the year. Depending on the frequency
and timing of eruptions and SAR acquisitions throughout the period of investigation, information on
the age of lava flows, i.e., the timing of their emplacement earlier or later during the year, is reflected in
mean coherence maps. For instance, the ALOS2 coherence was lower in areas affected by the July and
September 2018 lava flows compared to the areas covered by the early and late April 2018 eruptive
products (Figure 4e).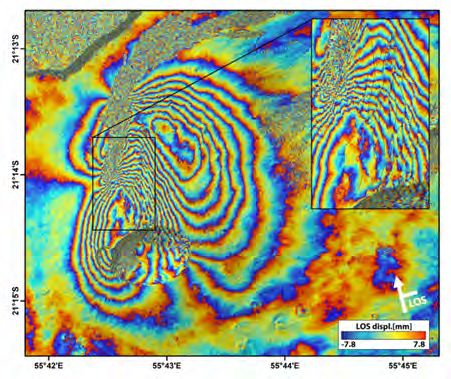
Remote Sens. 2019, 11, x FOR PEER REVIEW                     1 of 29

Remote Sens. 2020, 12, 1019                                                7 of 29

                                                    (a)

                                               Figure 3. Cont.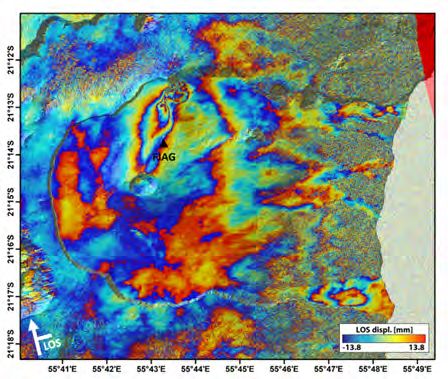
Remote Sens. 2019, 11, x FOR PEER REVIEW                                                                      2 of 29

Remote Sens. 2020, 12, 1019                                                                                                                                                             8 of 29

                                                                                             (b)

      Figure   3. Overview
          Figure  3. Overviewof of
                                thethe
                                     complete
                                       completeSAR
                                                 SARdata
                                                      dataarchive
                                                           archive holding
                                                                    holding aa total
                                                                                totalof
                                                                                      of1835
                                                                                         1835SAR
                                                                                              SARscenes
                                                                                                    scenes  (represented
                                                                                                         (represented      as black
                                                                                                                        as black    dots)
                                                                                                                                 dots)    acquired
                                                                                                                                       acquired overover
                                                                                                                                                      PitonPiton
                                                                                                                                                            de la de la Fournaise
                                                                                                                                                                  Fournaise       between
                                                                                                                                                                            between  5
      5 September
          September 1998 and 31 December 2019: (a) data collected by “old generation” SAR satellites that are no longer operating; (b) data collected by “new generation” SAR
                     1998 and  31  December   2019: (a) data collected by “old   generation”  SAR  satellites that are no longer  operating; (b) data collected  by “new  generation”
      satellites. A total of
          SAR satellites.    58 eruptions
                          A total           are marked
                                   of 58 eruptions       by redby
                                                   are marked   bars,
                                                                   red while 24 intrusions
                                                                       bars, while           are shown
                                                                                    24 intrusions        as green
                                                                                                  are shown        lines.
                                                                                                              as green lines.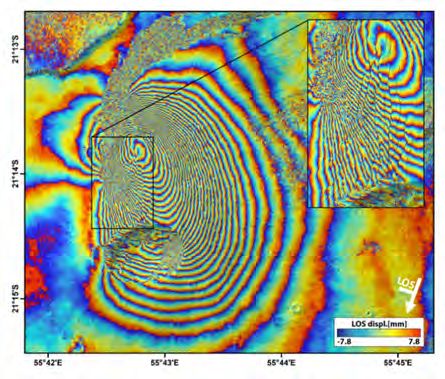
Remote Sens. 2020, 12, 1019                                                                                                                                                9 of 29

     Table 1. Piton de la Fournaise SAR data specifications. The order of SAR satellites, modes, and acquisition geometries follows the structure of Figure 3a,b;
     “old generation” and “new generation” satellites are separated by a blank line. In addition to the data shown in Figure 3, also TanDEM-X Co-SSCs are listed.

                           Acq.            Resolution   Image Size     Scene Center   Swath /Track                 Look         First Image Date   Last Image Date    No.
  Satellite a   Band                Pol.                                                             Pass LD e
                          Mode b            R/A c (m)   R × A c (km)    Coordinate      /Beam d                  Angle (◦ ) f     yyyy/mm/dd        yyyy/mm/dd       Scenes
                                                                         21.36◦ S
   ALOS1          L           SM   HH/HV    9.37/3.20    43.5 × 59.0                      539           AR          37.3           2007/09/04        2010/07/28        4
                                                                         55.98◦ E
                                                                         21.37◦ S
   ALOS1          L           SM    HH      4.68/3.20    43.7 × 59.0                      539           AR          37.3           2007/03/04        2011/01/28        8
                                                                         55.96◦ E
                                                                         21.29◦ S
   ALOS1          L           SM    HH      4.68/3.19    43.7 × 59.0                      191           DR          39.8           2007/08/07        2008/08/09        2
                                                                         55.93◦ E
                                                                         21.00◦ S
   ALOS1          L           SM    HH      4.68/3.60    51.4 × 66.4                      542           AR          46.4           2006/07/22        2006/10/22        2
                                                                         55.83◦ E
                                                                         21.36◦ S
   ALOS1          L           SM   HH/HV    9.37/4.08    52.5 × 75.4                      541           AR          43.6           2006/10/05        2007/05/23        3
                                                                         55.81◦ E
                                                                         21.36◦ S
   ALOS1          L           SM   HH/HV    9.37/3.20    43.5 × 59.0                      540           AR          40.5           2007/08/06        2010/08/14        5
                                                                         55.72◦ E
                                                                         21.36◦ S
   ALOS1          L           SM    HH      4.68/3.20    43.7 × 59.0                      540           AR          40.5           2007/02/03        2010/03/29        9
                                                                         55.42◦ E
                                                                         21.19◦ S
  ENVISAT         C           SM    VV      7.80/3.25   40.1 × 107.2                    IS7 005         DR          43.8           2003/08/12        2010/09/14        35
                                                                         55.78◦ E
                                                                         21.18◦ S
  ENVISAT         C           SM    VV      7.80/3.24   40.1 × 107.3                    IS7 170         AR          42.7           2007/04/14        2010/09/25        22
                                                                         55.94◦ E
                                                                         20.98◦ S
  ENVISAT         C           SM    VV      7.80/3.98   47.2 × 108.5                    IS6 277         DR          40.1           2003/07/27        2010/08/29        45
                                                                         55.65◦ E
                                                                         21.24◦ S
  ENVISAT         C           SM    VV      7.80/3.23   40.1 × 100.2                    IS5 399         AR          38.8           2003/09/08        2009/03/30        39
                                                                         55.46◦ E
                                                                         20.99◦ S
  ENVISAT         C           SM    VV      7.80/3.23   40.1 × 107.5                    IS5 048         DR          36.2           2003/11/28        2010/09/17        38
                                                                         55.56◦ E
                                                                         21.14◦ S
  ENVISAT         C           SM    VV      7.80/3.96   49.1 × 102.1                    IS4 127         AR          34.8           2010/02/24        2010/08/18        2
                                                                         55.48◦ E
                                                                         21.14◦ S
  ENVISAT         C           SM    HH      7.80/3.96   49.1 × 102.1                    IS4 127         AR          34.8           2004/08/04        2015/12/07        4
                                                                         55.48◦ E
                                                                         21.09◦ S
  ENVISAT         C           SM    VV      7.80/4.02   48.7 × 110.9                    IS4 320         DR          31.8           2009/06/03        2010/09/01        7
                                                                         55.48◦ E
                                                                         21.09◦ S
  ENVISAT         C           SM    HH      7.80/4.02   48.7 × 110.9                    IS4 320         DR          31.8           2003/12/17        2005/12/21        5
                                                                         55.48◦ E
Remote Sens. 2020, 12, 1019                                                                                                                                            10 of 29

                                                                              Table 1. Cont.

                           Acq.            Resolution   Image Size     Scene Center   Swath /Track                 Look         First Image Date   Last Image Date    No.
  Satellite a   Band                Pol.                                                             Pass LD e
                          Mode b            R/A c (m)   R × A c (km)    Coordinate      /Beam d                  Angle (◦ ) f     yyyy/mm/dd        yyyy/mm/dd       Scenes
                                                                         21.12◦ S
  ENVISAT         C           SM    VV      7.80/3.18   39.9 × 109.9                    IS3 091         DR          27.1           2003/08/18        2010/09/20        44
                                                                         55.54◦ E
                                                                         21.15◦ S
  ENVISAT         C           SM    VV      7.80/3.18   40.0 × 108.1                    IS3 356         AR          30.3           2003/08/01        2010/09/03        42
                                                                         55.39◦ E
                                                                         21.05◦ S
  ENVISAT         C           SM    VV      7.80/4.06   40.5 × 109.2                    IS2 313         AR          20.2           2003/04/15        2010/05/18        49
                                                                         55.97◦ E
                                                                         21.23◦ S
  ENVISAT         C           SM    VV      7.80/4.06    40.5 × 98.3                    IS2 084         AR          25.4           2003/08/17        2010/09/19        33
                                                                         55.28◦ E
                                                                         21.10◦ S
  ENVISAT         C           SM    VV      7.80/4.06   40.5 × 109.6                    IS2 363         DR          21.9           2003/08/02        2010/09/04        53
                                                                         55.69◦ E
                                                                         21.18◦ S
   RSAT1          C           SM    HH      4.63/5.17    27.7 × 58.3                      F5            DR          47.5           2000/09/05        2002/03/11        4
                                                                         55.75◦ E
                                                                         21.19◦ S
   RSAT1          C           SM    HH      4.63/5.05    26.3 × 59.4                      F4            AR          46.1           2000/09/27        2002/04/26        8
                                                                         55.66◦ E
                                                                         21.19◦ S
   RSAT1          C           SM    HH      4.63/5.36    27.8 × 60.9                      F2            AR          40.9           2001/11/16        2002/04/09        2
                                                                         55.67◦ E
                                                                         21.25◦ S
   ALOS2          L           SPT   HH      1.43/0.97    23.4 × 26.2                      55            DR          69.2           2015/01/04        2019/10/20        11
                                                                         55.71◦ E
                                                                         21.25◦ S
   ALOS2          L           SPT   HH      1.43/0.97    22.6 × 26.2                      56            DR          64.8           2014/12/12        2019/10/11        9
                                                                         55.71◦ E
                                                                         21.25◦ S
   ALOS2          L           SPT   HH      1.43/0.97    21.5 × 26.2                      57            DR          59.3           2017/07/12        2019/10/16        16
                                                                         55.71◦ E
                                                                         21.25◦ S
   ALOS2          L           SPT   HH      1.43/0.97    19.8 × 26.2                      58            DR          52.4           2014/10/27        2019/12/31        13
                                                                         55.71◦ E
                                                                         21.25◦ S
   ALOS2          L           SPT   HH      1.43/0.97    17.2 × 26.3                      59            DR          43.5           2014/12/13        2019/10/12        8
                                                                         55.71◦ E
                                                                         21.25◦ S
   ALOS2          L           SPT   HH      1.43/0.97    13.2 × 26.3                      60            DR          31.8           2015/01/01        2019/10/17        8
                                                                         55.71◦ E
                                                                         21.25◦ S
   ALOS2          L           SPT   HH      1.43/0.97    13.1 × 26.2                      64            DL          31.7           2014/08/20        2019/07/31        11
                                                                         55.71◦ E
                                                                         21.25◦ S
   ALOS2          L           SPT   HH      1.43/0.97    17.2 × 26.2                      65            DL          43.3           2019/07/08        2019/08/05        2
                                                                         55.71◦ E
Remote Sens. 2020, 12, 1019 11 of 29
Table 1. Cont.
Acq. Resolution Image Size Scene Center Swath /Track Look First Image Date Last Image Date No.
Satellite a Band Pol. Pass LD e
Mode b R/A c (m) R × A c (km) Coordinate /Beam d Angle (◦ ) f yyyy/mm/dd yyyy/mm/dd Scenes
21.25◦ S
ALOS2 L SPT HH 1.43/0.97 19.8 × 26.1 66 DL 52.5 2015/01/31 2015/10/24 5
55.71◦ E
21.25◦ S
ALOS2 L SPT HH 1.43/0.97 21.5 × 26.0 67 DL 59.6 2014/08/21 2019/07/04 12
55.71◦ E
21.25◦ S
ALOS2 L SPT HH 1.43/0.98 22.7 × 26.0 68 DL 65.1 2014/12/16 2019/10/15 11
55.71◦ E
21.25◦ S
ALOS2 L SPT HH 1.43/0.98 23.2 × 26.0 157 AL 68.4 2014/10/04 2019/12/07 27
55.71◦ E
21.25◦ S
ALOS2 L SPT HH 1.43/0.98 22.4 × 26.0 158 AL 63.6 2014/08/28 2019/11/28 24
55.71◦ E
21.25◦ S
ALOS2 L SPT HH 1.43/0.98 21.1 × 26.0 159 AL 57.7 2014/08/19 2019/12/03 35
55.71◦ E
21.25◦ S
ALOS2 L SPT HH 1.43/0.98 19.2 × 26.1 160 AL 50.2 2014/08/24 2019/12/08 29
55.71◦ E
21.25◦ S
ALOS2 L SPT HH 1.43/0.97 16.2 × 26.2 161 AL 40.4 2014/09/26 2019/12/13 25
55.74◦ E
21.25◦ S
ALOS2 L SPT HH 1.43/0.97 11.6 × 26.2 162 AL 27.7 2014/09/03 2019/12/14 20
55.71◦ E
21.25◦ S
ALOS2 L SPT HH 1.43/0.97 15.4 × 26.3 166 AR 30.9 2014/11/18 2017/01/10 2
55.71◦ E
21.25◦ S
ALOS2 L SPT HH 1.43/0.97 18.0 × 26.3 167 AR 46.1 2019/02/10 2019/12/15 4
55.71◦ E
21.25◦ S
ALOS2 L SPT HH 1.43/0.98 20.4 × 26.3 168 AR 54.6 2015/01/23 2019/12/06 11
55.71◦ E
21.25◦ S
ALOS2 L SPT HH 1.43/0.97 21.9 × 26.2 169 AR 61.0 2015/01/14 2019/11/27 19
55.71◦ E
21.25◦ S
ALOS2 L SPT HH 1.43/0.97 22.9 × 26.2 170 AR 66.2 2014/04/27 2019/12/02 15
55.71◦ E
21.35◦ S
ALOS2 L SM1 HH 1.43/1.95 39.3 × 72.7 59 DR 43.5 2015/01/24 2019/02/16 13
55.76◦ E
21.19◦ S
ALOS2 L SM1 HH 1.43/1.92 30.8 × 72.7 60 DR 31.5 2015/01/29 2018/02/22 6
55.64◦ ERemote Sens. 2020, 12, 1019 12 of 29
Table 1. Cont.
Acq. Resolution Image Size Scene Center Swath /Track Look First Image Date Last Image Date No.
Satellite a Band Pol. Pass LD e
Mode b R/A c (m) R × A c (km) Coordinate /Beam d Angle (◦ ) f yyyy/mm/dd yyyy/mm/dd Scenes
21.09◦ S
ALOS2 L SM1 HH 1.43/2.23 34.0 × 72.7 166 AR 35.2 2017/08/22 2018/04/17 2
55.78◦ E
21.25◦ S
RS2 C SM Quad 4.73/4.90 9.7 × 29,8 Q2 AR 20.7 2014/06/14 2014/07/08 2
55.73◦ E
21.23◦ S
RS2 C SM Quad 4.73/4.83 13.1 × 38,4 Q8 AR 28.0 2009/08/20 2015/06/02 20
55.71◦ E
21.26◦ S
RS2 C SM Quad 4.73/4.80 19.9 × 29,7 Q28 DR 46.9 2010/10/31 2015/02/07 23
55.75◦ E
21.24◦ S
RS2 C SM Quad 4.73/4.95 19.7 × 29,8 Q27 AR 45.6 2010/10/29 2015/02/05 17
55.80◦ E
21.21◦ S
S1 C IW VH/VV 2.32/14.06 159.2 × 94.8 151 DR 36.8 2014/10/16 2019/12/25 128
55.46◦ E
21.38◦ S
S1 C IW HH/HV 2.33/14.06 159.3 × 211.2 144 AR 37.9 2017/10/23 2018/04/21 13
55.41◦ E
21.38◦ S
S1 C IW VH/VV 2.33/14.06 159.3 × 211.2 144 AR 37.9 2014/10/15 2019/12/24 116
55.41◦ E
20.31◦ S
S1 C SM VH/VV 2.66/4.14 48.7 × 165.7 151 DR 36.8 2015/05/08 2019/12/19 124
55.70◦ E
20.86◦ S
S1 C SM VH/VV 3.19/4.11 56.3 × 162.4 144 AR 37.9 2015/05/07 2019/12/30 135
55.82◦ E
21.24◦ S
CSK X SPT VV 0.40/0.70 5.5 × 7.0 S2-25 DR 52.4 2016/07/06 2017/07/25 7
55.72◦ E
21.24◦ S
CSK X SPT VV 0.39/0.70 5.2 × 7.0 S2-21 AR 48.8 2016/07/06 2017/07/25 8
55.71◦ E
21.27◦ S
CSK X SM HH 1.17/2.09 23.0 × 47.2 H4-05 DR 34.4 2015/01/15 2015/01/23 2
55.81◦ E
21.27◦ S
CSK X SM VV 1.17/2.09 23.0 × 47.1 H4-05 DR 34.4 2015/02/08 2015/02/09 2
55.81◦ E
21.23◦ S
CSK X SM VV 1.33/2.25 29.8 × 48.6 H4-09 AR 39.7 2011/04/09 2012/03/10 20
55.62◦ E
21.22◦ S
CSK X SM VV 1.73/2.09 24.9 × 45.6 H4-18 DR 52.2 2011/02/15 2019/03/01 107
55.66◦ ERemote Sens. 2020, 12, 1019 13 of 29
Table 1. Cont.
Acq. Resolution Image Size Scene Center Swath /Track Look First Image Date Last Image Date No.
Satellite a Band Pol. Pass LD e
Mode b R/A c (m) R × A c (km) Coordinate /Beam d Angle (◦ ) f yyyy/mm/dd yyyy/mm/dd Scenes
21.28◦ S
CSK X SM VV 1.63/2.25 31.2 × 48.0 H4-15 AR 48.5 2011/02/15 2018/11/25 106
55.62◦ E
21.26◦ S
TSX/TDX X SPT VV 0.45/0.84 4.9 × 5.0 044 DR 37.0 2018/11/21 2019/09/03 11
55.72◦ E
21.23◦ S
TSX/TDX X SPT VV 0.45/0.85 5.0 × 5.3 036 AR 33.4 2018/10/04 2019/11/26 20
55.73◦ E
21.25◦ S
TSX/TDX X SM/Mono VV 0.90/2.07 19.7 × 42.7 121 DR 37.0 2008/12/13 2019/12/11 63
55.64◦ E
21.25◦ S
TSX/TDX X SM/Mono VV 1.36/1.86 19.8 × 42.7 68 AR 33.4 2009/03/07 2019/12/07 108
55.72◦ E
21.23◦ S
TSX/TDX X SM/Bi VV 0.90/2.07 20.7 × 56.9 121 DR 37.0 2011/06/03 2019/12/22 2 × 188
55.64◦ E
21.27◦ S
TSX/TDX X SM/Bi VV 1.36/1.86 21.2 × 54.8 68 AR 33.4 2011/09/06 2014/08/30 2 × 17
55.71◦ E
TSX/TDX X SM/Bi/DEM HH 0.90/2.07 20.7 × 56.9 differ slightly 121 DR 37.0 2011/08/30 2012/12/26 2×3
TSX/TDX X SM/Bi/DEM HH 1.36/1.86 21.2 × 54.8 differ slightly 68 AR 33.4 2013/01/24 2014/11/04 2×4
a ENVISAT = ENVISAT ASAR; RSAT1 = RADARSAT-1; ALOS1 = ALOS-1 PALSAR-1; TSX/TDX = TerraSAR-X/TanDEM-X; CSK = COSMO-SkyMed; RSAT2 = RADARSAT-2; S1 = Sentinel-1;
ALOS2 = ALOS-2 PALSAR-2; b Acquisition Mode: SM = StripMap; SM/Mono = StripMap monostatic; SM/Bi = StripMap bistatic; SPT = SpotLight; IW = Interferometric Wide Swath;
SM1 = StripMap 1 for ALOS2; c R = Range; A = Azimuth; d In case of ENVISAT ASAR, ISx yyy means swath ISx, track yyy; e LD = Look Direction; A = Ascending; D = Descending;
R = Right; L = Left; f Look angle at Dolomieu Crater location, in decimal degrees.Remote Sens. 2020, 12, 1019 14 of 29
Remote Sens. 2019, 11, x FOR PEER REVIEW 2 of 29
(a) (b)
(c) (d)
(e) (f)
Figure4.4. The
Figure Thefull
fullgraph
graphaverage
averagecoherence over over
coherence the course of about
the course ofone yearone
about (endyear
of January
(end of2018 to
January
end of February 2019): (a) X-band from ascending TSX SM data, 18 SAR scenes,
2018 to end of February 2019): (a) X-band from ascending TSX SM data, 18 SAR scenes, 153 interferograms,
incidence
153 angle = 33.4°;
interferograms, (b) interferogram
incidence connection
angle = 33.4 graph corresponding
◦ ; (b) interferogram to (a);
connection (c) C-band
graph from
corresponding
todescending S1 SM data, 32 images, 496 interferograms, incidence angle = 36.95°; (d) interferogram ◦
(a); (c) C-band from descending S1 SM data, 32 images, 496 interferograms, incidence angle = 36.95 ;
connection graph corresponding to (c); (e) L-band from descending ALOS2 SPT, 7 images, 21
(d) interferogram connection graph corresponding to (c); (e) L-band from descending ALOS2 SPT,
interferograms, incidence angle = 59.2°; dates indicate the timing of four eruptions that occurred
7 images, 21 interferograms, incidence angle = 59.2◦ ; dates indicate the timing of four eruptions that
during the period of investigation; (f) interferogram connection graph corresponding to (e).
occurred during the period of investigation; (f) interferogram connection graph corresponding to (e).
3.3.Characteristic
CharacteristicDeformation
Deformation and
and Associated
AssociatedPhysical
PhysicalProcesses
Processesatat
Piton dede
Piton la la
Fournaise volcano
Fournaise volcano
Themost
The mostcommon
common processes
processes to
to cause
cause measurable
measurablesurface
surfacedeformation
deformation at at
Piton de de
Piton la Fournaise
la Fournaise
volcano are (a) (long-term) pressure changes within the magma reservoir or changes
volcano are (a) (long-term) pressure changes within the magma reservoir or changes of theof the volcano’s
volcano’s
hydrothermal system (Section 3.1); (b) rapid subsurface magma ascent associated with intrusions
hydrothermal system (Section 3.1); (b) rapid subsurface magma ascent associated with intrusions and
and eruptions (Section 3.2); (c) local instability along the rim of the volcano’s summit craters andRemote Sens. 2020, 12, 1019 15 of 29
eruptions (Section 3.2); (c) local instability along the rim of the volcano’s summit craters and eruptive
vents, or caldera/pit crater collapse (Section 3.3); (d) cooling and compaction of lava flows, as well
as surface flexure in their close proximity upon emplacement (Section 3.4); and (e) movement of the
unsupported eastern flank of the volcano that can occur as both steady flank sliding or abrupt flank
slip (Section 3.5). Due to the volcano’s high level of activity and frequent eruptions, these processes
often occur simultaneously or in rapid succession, so that related surface deformation phenomena
can be difficult to discriminate. For example, the same location on the flank of the volcano might
be affected by both seaward flank sliding, which is characteristically observed as subsidence and
motion towards the unsupported flank [26,27], and lava flow compaction, a process that adds another
subsidence component to the total surface deformation observed at this location [19]. In order to
study deformation source processes, to quantify involved physics, and to understand associated
volcanic hazards, however, it is important to be able to unequivocally attribute surface deformation
components to their corresponding sources. Isolating superimposed signal components of surface
deformation measurements has, therefore, become a key objective of volcano geodesy at Piton de
la Fournaise volcano (cf. Sections 3.4 and 3.5 on lava flow monitoring and flank instability and
references therein). Additional knowledge on the timing and temporal evolution of events, the location
and extent of the affected area, and the expected long-term deformation behavior can assist the
deformation signal decomposition. For instance, the timing of lava flow emplacement depends on
the onset of the corresponding eruption and its effusion rate, the area covered by the lava flow can
(under certain circumstances) be retrieved from co-eruptive interferometric coherence or other sources
(e.g., aerial photography or infrared observations), and the expected long-term displacement behavior
could be described as exponentially decaying subsidence where the magnitude positively correlates
with the thickness of the lava flow [19,28–30].
3.1. Displacements of the Central Volcanic Cone
Long- to intermediate-term deformation occurs over the course of days to months and affects the
entire central volcanic cone. This type of deformation signal is thought to reflect pressure changes
within the shallow magma reservoir, or changes of the hydrothermal system of the volcano [1,15,22,31].
Long-term inflation is thought to reflect a pressurization of the shallow reservoir, indicating feeding
from depth and accumulation of magma in the reservoir. This type of inflation, therefore, serves as an
early eruption precursor alongside the occurrence of seismicity [21]. As the central volcanic cone of
Piton de la Fournaise is equipped with a dense network of permanent GNSS stations in addition to
more than 75 campaign GNSS benchmarks that are re-measured by the observatory staff upon each
eruption (Figure 2), these longer-term pressure changes within the shallow reservoir are well observed
and modelled by means of and based on ground instrumentation and measurements [1,22,31–33].
Long-term surface deformation signals in InSAR data were observed, described, and modelled by
Tinard [34] over a period between 2003 and 2007, who suggested that displacements of the volcano’s
central cone might be related to magma accumulation and withdrawal from the shallow reservoir.
Long-term subsidence affecting the central cone was detected over a long period following the major
2007 eruption from SAR interferometry (Figure 5). This time the signals were interpreted as related
to changes within the volcano’s hydrothermal system [18]. However, surface subsidence patterns
that affect the central cone and that are thought to reflect compression of the shallow reservoir or
hydrothermal system are difficult to discriminate from topography-correlated atmospheric phase
delays, especially in single time step interferograms [35–37]. MT-InSAR approaches potentially
overcome these limitations and can help to better estimate and discriminate the atmospheric phase
component, allowing for the retrieval of long-term deformation trends (Figure 5). However, compared
to the dense ground-based deformation network operated by OVPF, SAR interferometry does not add
much crucial information on the long- to intermediate-term displacements that only affect Piton de la
Fournaise’s well-equipped central volcanic cone.Remote
RemoteSens. 2019,12,
Sens.2020, 11,1019
x FOR PEER REVIEW 16 4ofof2929
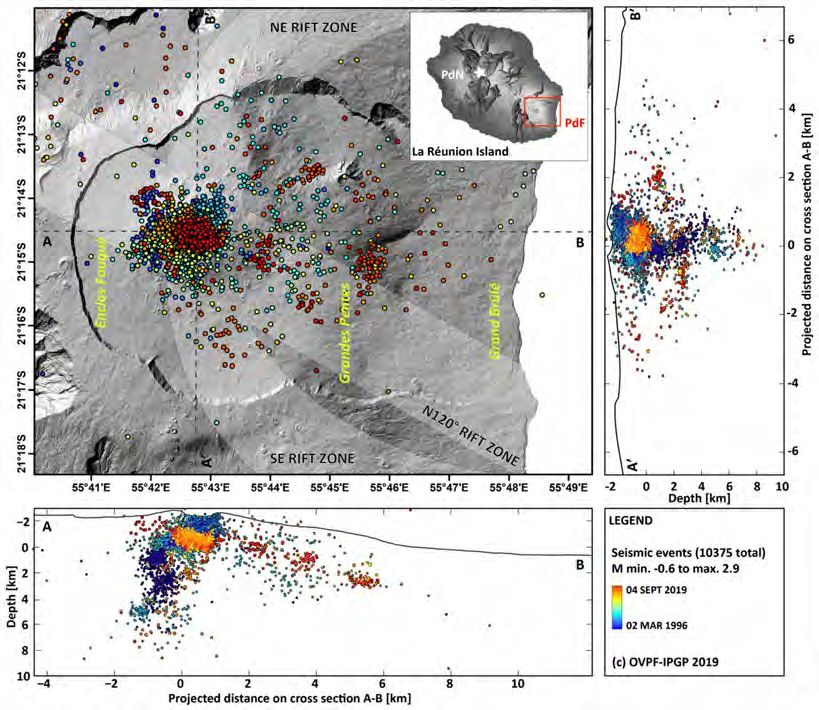
Figure 5. Line-of-sight (LOS) displacement velocities between 7 September 2011 and 14 June 2014 from
Figure 5. Line-of-sight (LOS) displacement velocities between 7 September 2011 and 14 June 2014
ascending TSX SM data. Characteristic deformation processes observed during this quiescent period of
from ascending TSX SM data. Characteristic deformation processes observed during this quiescent
the volcano are lava flow subsidence, flank sliding of about ~3 cm of LOS subsidence per year, and the
period of the volcano are lava flow subsidence, flank sliding of about ~3 cm of LOS subsidence per
continuation of subsidence of the central volcanic cone upon the major 2007 eruption. Inset shows the
year, and the continuation of subsidence of the central volcanic cone upon the major 2007 eruption.
time series for one selected point along the volcano’s mobile eastern flank.
Inset shows the time series for one selected point along the volcano’s mobile eastern flank.
InSAR signals of small spatial extent, either of magmatic or hydrothermal origin, are linked to
a shallowInSAR signals
source of small spatial
underneath extent,
the central either of
volcanic magmatic
cone. At Piton or hydrothermal
de la Fournaise, origin, are linked to a
large-wavelength
shallow source underneath the central volcanic cone. At Piton de la
signals that extent beyond the Enclos Fouqué caldera and that could be related to the changes within Fournaise, large-wavelength
asignals
deeperthat extent beyond
magmatic reservoir theorEnclos
storage Fouqué caldera
zone have and been
never that could
observedbe related
using toSARtheinterferometry.
changes within
a deeper magmatic reservoir or storage zone have never been observed
This does not mean that such large-wavelength displacements do not exist, but as most InSAR data are using SAR interferometry.
This does outside
incoherent not mean thethat suchFouqué
Enclos large-wavelength
caldera (Figuredisplacements do not is
4), this technique exist, but as most
not sufficient InSAR
to pick updata
on
are large
any incoherent
signalsoutside the Enclos
that extent beyondFouqué caldera
the caldera, (Figure
should they4), this technique is not sufficient to pick
exist.
up on any large signals that extent beyond the caldera, should they exist.
3.2. Short-Term Rapid Variations and Typical Deformation Patterns Associated with Eruptions
3.2. Short-term Rapid Variations and Typical Deformation Patterns Associated with Eruptions
Volcanic eruptions at Piton de la Fournaise volcano are typically preceded by seismic crises
Volcanic
indicating eruptions
the escape at Piton
of magma de the
from la Fournaise volcano and
shallow reservoir are its
typically preceded
propagation towardsby seismic crises
the surface.
Aindicating
seismic crisisthe escape
usuallyoflasts
magma from athe
between fewshallow
hours reservoir
to days [38] andandits is
propagation
accompanied towards the surface.
by sudden high
A seismic crisis usually lasts between a few hours to days [38] and is
rates of surface inflation that are associated with the magma ascent [22,39,40]. Amongst the main accompanied by sudden high
rates of surface
deformation inflation
phenomena that areatassociated
observed Piton de lawith the magma
Fournaise volcanoascent [22,39,40].
(as discussed AmongstSection
throughout the main3),
deformation phenomena observed at Piton de la Fournaise volcano (as
this type of deformation is the most straightforward to capture, discriminate, and quantify by means discussed throughout Section
of3),SAR
thisinterferometry.
type of deformation is thetomost
In contrast straightforward
deformation that affectsto capture,
the central discriminate,
volcanic cone and(Section
quantify by
3.1),
means ofand
intrusions SAR interferometry.
eruptions oftentimes Intake
contrast to locations
place at deformation alongthat affects the
the volcano’s riftcentral volcanic
zones, which are cone
not
(Section 3.1), intrusions and eruptions oftentimes take place at locations
as densely equipped with ground instrumentation. Therefore, InSAR is the essential technique allowing along the volcano’s rift
zones, which are not as densely equipped with ground instrumentation.
for imaging, quantifying, and analyzing intrusion- and eruption-related deformation patterns at Piton Therefore, InSAR is the
essential
de la Fournaise technique
volcano.allowing for imaging,
This is especially quantifying,
true for distal eruptions and as the analyzing
GNSS ground intrusion-
deformation and
eruption-related deformation patterns at Piton de la Fournaise volcano. This
network is sparser further away from the central cone (cf. Sections 3.2.1 and 3.2.2, and references therein; is especially true for
distal eruptions
Figures 2, 6 and 7).asBecause
the GNSS ground
of their highdeformation network
frequency, their is sparser
occurrence in veryfurther awayareas,
confined from their
the central
short
cone (cf. Sections 3.2.1 and 3.2.2, and references therein; Figures 2, 6,
(and known) duration, and their characteristically large amplitudes, eruption- and intrusion-related and 7). Because of their high
frequency, their occurrence in very confined areas, their short (and
deformation signals are also the most commonly observed, described, modelled, and analyzed in the known) duration, and their
characteristically
Piton de la Fournaise large amplitudes,
volcano InSAR eruption-
literature.and intrusion-related deformation signals are also the
most commonly observed, described, modelled, and analyzed in the Piton de la Fournaise volcano
InSAR literature.Remote Sens. 2020, 12, 1019 17 of 29
3.2.1. Co-Eruptive Displacements
The first dedicated InSAR study at Piton de la Fournaise was published in 1999 by
Sigmundsson et al. [23], who detected ground displacements associated with the 9 March
1998–21 September 1998 eruption of Piton de la Fournaise using satellite data collected by the Canadian
RADARSAT-1 satellite (RSAT1). The authors could explain the co-eruptive displacements by means
of a 1.5 km-long, dipping dislocation with 60 cm of opening in the north that they extended another
1 km towards the south, allowing for only 40 cm of opening there. Edifice inflation prior to this 1998
event was not observed. According to Sigmundsson et al. [23], the eruption was accompanied by
seaward displacement of the eastern flank. The authors concluded that over time the accumulation
of displacements caused by similar eruptions contributed to the destabilization of the volcano’s
eastern flank. Fukushima et al. [39] used a combination of a boundary element model (including the
topography) and a neighborhood algorithm inversion in order to invert for the source geometry that fed
the February 2000 eruption based on RSAT1 InSAR data from two ascending and two descending orbits.
The authors explained the deformation associated with this eruption by a seaward dipping (61.0◦ –67.3◦ )
trapezoid, oriented parallel to the rift zone that initiated at 800–1000 m beneath the Dolomieu summit
crater. The authors emphasized the importance of taking into account the topography in order to
realistically infer for the geometry and overpressure at depth. Froger et al. [41] used ENVISAT ASAR
data to describe the deformation field associated with the August 2003 Piton de la Fournaise eruption,
and inverted for the associated deformation source. This eruption, too, caused the unsupported eastern
flank of the volcano to move seaward (or vice versa). The authors stressed the previous findings of
Sigmundsson et al. [23], who stated that successive dike intrusions contribute to the destabilization
of the volcanic edifice. Fukushima et al. [40] then analyzed the first five eruptions that occurred
since early 1998 using 10 interferograms computed from RSAT1 satellite images. According to these
authors, all eruptions apart from the March 1998 event were fed by shallow dikes initiating at depths
of less than 1000 m. By taking into account tilt data and seismicity in addition to the InSAR data,
Fukushima et al. [40] concluded that vertical magma propagation preceded lateral material ascent prior
to eruptions. Augier [42] studied both co- and post-eruptive displacements associated with the 2007
eruption. Smittarello et al. [43] used four propagation phase-spanning interferograms in combination
with continuous GNSS data to invert for the intrusion geometry (by means of InSAR data) and the
magma propagation dynamics (by means of GNSS data) during the eight hours before the 26 May 2016
eruption. According to these authors, the observed deformation was best explained by a 2700-m-long
sill that located 800 m above sea level and that connected to the eruptive fissure by a subvertical
dike [43]. In contrast to the above-described numerical and geodetic inversion models that explained
co-intrusion and/or co-eruption surface deformation at Piton de la Fournaise volcano as elastic-walled,
inclined, or (sub-) horizontal dislocations, Got et al. [44] argued that linear elasticity, which is often
assumed in numerical models, might be too general and not representative for the rheology of the
highly unconsolidated uppermost part of the volcano’s edifice.
As mentioned in Section 2, a total of 52 of the 58 eruptions that occurred between 9 March 1998
and 31 December 2019 are covered by interferometric SAR data (Figure 3). Co-eruptive interferograms
from both ascending and descending viewing geometries are routinely calculated directly upon
data availability for all recent Piton de la Fournaise eruptions, and they are converted into near-3D
displacements using the method suggested by Wright et al. [45]. While this is an often applied method
by volcano geodesists worldwide in order to resolve the near-3D surface deformation components,
one has to take into account the fact that time delays of at least ~12 hours between ascending and
descending data takes may add uncertainties to the near-3D displacement field obtained by InSAR.
Therefore, the timing of data takes with respect to the onset and evolution of surface deformation
processes needs to be taken into account carefully, especially when inverting for intrusion geometries
and dynamics.
An example is given in Figures 6 and 7, illustrating the surface displacements associated with the
3–4 April 2018 eruption, which occurred far away from the central volcanic cone at a location that is onlyRemote Sens. 2020, 12, 1019 18 of 29
Remote Sens. 2019, 11, x FOR PEER REVIEW 6 of 29
monitored by a single permanent GNSS station (FJAG). While the surface motion recorded on the FJAG
recorded
GNSS stationonsheds
the FJAG GNSS
light on station sheds
the temporal lightofonthe
evolution the temporal
eruption andevolution
suggests of the
that eruption
(almost) theand
entire
surface movement occurred during the very short period of magma ascent immediately beforeofthe
suggests that (almost) the entire surface movement occurred during the very short period
magma
onset of theascent immediately
eruption before
(Figure 6e,f, data the onset of
are shown at the eruption (Figure
a down-sampled daily6e,f, data are shown
measurement at afull
rate), the
down-sampled
spatial extent of thedaily measurement
surface rate), associated
displacements the full spatial extent
with this of thewas
eruption surface displacements
only detectable using
associated with this eruption was only detectable using SAR interferometry
SAR interferometry (Figure 6a–d). Noteworthy, the subsequent eruption that occurred in late April(Figure 6a–d).
Noteworthy, the subsequent eruption that occurred in late April (the start of which is indicated by
(the start of which is indicated by the red bar on the very right of the graphs shown in Figure 6e,f) was
the red bar on the very right of the graphs shown in Figure 6e,f) was located on the southern flank
located on the southern flank of the central volcanic cone and therefore did not cause any significant
of the central volcanic cone and therefore did not cause any significant movement of the FJAG
movement of the FJAG GNSS station. The 3–4 April event also highlights the importance of the timing
GNSS station. The 3–4 April event also highlights the importance of the timing of SAR data takes
of SAR data takes with respect to the intrusion and eruption dynamics (Section 3.2.2).
with respect to the intrusion and eruption dynamics (Section 3.2.2).
(a) (b)
(c) (d)
Figure 6. Cont.Remote Sens.
Remote 2020,
Sens. 12,11,
2019, 1019
x FOR PEER REVIEW 7 19 of 29
of 29
(e) (f)
Figure 6. Deformation associated with the 03–04 April 2018 eruption as imaged by TSX SM
Figure 6. Deformation associated with the 03–04 April 2018 eruption as imaged by TSX SM
interferometry: (a) unwrapped interferogram spanning 24 January to 22 April 2018 (ascending); (b)
interferometry: (a) unwrapped interferogram spanning 24 January to 22 April 2018 (ascending);
unwrapped interferogram spanning 28 January to 26 April 2018 (descending); (c) near-vertical
(b) unwrapped interferogram spanning 28 January to 26 April 2018 (descending); (c) near-vertical
displacements as derived from the combination of both ascending and descending interferograms,
displacements as derived from the combination of both ascending and descending interferograms,
black triangle marks the location of the closest GNSS station (FJAG); (d) near E–W displacements as
black triangle marks the location of the closest GNSS station (FJAG); (d) near E–W displacements as
derived from the combination of both ascending and descending interferograms, black triangle
derived from the combination of both ascending and descending interferograms, black triangle marks
marks the location of the closest GNSS station (FJAG); (e) vertical displacement component and (f)
theeastward
location displacement
of the closest component
GNSS station (FJAG); (e) vertical displacement component and (f) eastward
of GNSS station FJAG (mm; at a daily sampling), where red bars
displacement component of GNSS
mark the two April 2018 eruptions andstation FJAG (mm;lines
dashed at a mark
daily sampling), where red
the time periods bars mark
spanned by
theinterferograms:
two April 2018red—time
eruptionsspanned
and dashed lines mark the time periods spanned by interferograms:
by Figure 6a, blue—time spanned by Figure 6b, green—time
red—time
spannedspanned
by Figureby7a,
Figure 6a, blue—time
black—time spannedspanned
by Figureby7b.
Figure 6b, green—time spanned by Figure 7a,
black—time spanned by Figure 7b.
3.2.2. Post-eruptive Displacements
3.2.2. Post-Eruptive Displacements
At Piton de la Fournaise volcano, short revisit times (i.e., higher repeat cycles) of ESA’s S1A
At Piton de la Fournaise volcano, short revisit times (i.e., higher repeat cycles) of ESA’s S1A and
and S1B satellites (one ascending and one descending IW acquisition every 12 days, and one
S1Bascending
satellitesand(oneone
ascending
descendingandSM one descending
acquisition everyIW12acquisition
days, 6 days every
apart12fromdays, theand
IW one ascending
acquisitions)
and one descending
allow SM acquisition
for the recognition of subtle every 12 days,signals
displacement 6 daysthatapart fromnot
might thebeIW acquisitions)
detectable allow for
with coarser
thetemporal
recognition of subtle displacement signals that might not be detectable
sampling due to superposition of pre-, co-, and post-eruptive surface deformation. For with coarser temporal
sampling
instance,due highto data
superposition
sampling ofofS1 pre-,
SM co-,
dataand
has post-eruptive surface deformation.
facilitated the detection For instance,
of inverse displacements
high
upondatathe
sampling
first Aprilof2018
S1 SM data has
eruption, facilitated
when the detection
post-eruptive of inverse
line-of-sight (LOS)displacements
subsidence of upon thecm
up to ~7 first
April
was2018 eruption,
observed when post-eruptive
approximately line-of-sight
at the northeastern tip of(LOS) subsidence
the preceding of upscale
larger to ~7 cm was observed
co-eruptive uplift
approximately
(Figures 6 andat7).the northeastern
This eruption started tip ofonthe preceding
03 April 2018 atlarger
7H00 scale
UTC, co-eruptive
and the timing uplift (Figures 6
of ascending
andS17).SMThisSAR acquisitions
eruption startedspanning
on 03 April this2018
eruption
at 7H00 is particularly
UTC, and the interesting:
timing of co-eruptive
ascending S1 uplift
SM SARis
observed from
acquisitions an interferogram
spanning this eruptionspanning 22 March
is particularly 2018 (14H52
interesting: UTC) to
co-eruptive 03 April
uplift 2018 (14H52
is observed from an
UTC) (not spanning
interferogram shown in22Figure
March7), 2018 while
(14H52post-eruptive
UTC) to 03subsidence is already
April 2018 (14H52 UTC) detected from in
(not shown
interferograms starting on 03 April 2018 (14H52 UTC) (Figure 7a), i.e., less
Figure 7), while post-eruptive subsidence is already detected from interferograms starting on 03 April than 8 hours after the
onset
2018 of the
(14H52 eruption.
UTC) (FigureWhile
7a), the
i.e.,process
less than behind
8 hoursthisafter
subsidence remains
the onset of the to be investigated,
eruption. While the weprocess
note
that interferograms spanning longer time periods, or being less fortunate
behind this subsidence remains to be investigated, we note that interferograms spanning longer time regarding their timing,
might not allow for the distinction of such subtle or short-lived (elastic) deformation processes. For
periods, or being less fortunate regarding their timing, might not allow for the distinction of such
example, the TSX interferograms as provided in Figure 6a,b span both the co-eruptive uplift and the
subtle or short-lived (elastic) deformation processes. For example, the TSX interferograms as provided
post-eruptive subsidence. Moreover, the X-Band sensitivity causes coherence loss in the close
in Figure 6a,b span both the co-eruptive uplift and the post-eruptive subsidence. Moreover, the X-Band
proximity of the eruption site (i.e., at the northeastern tip of the uplift pattern that is related to the
sensitivity causes coherence loss in the close proximity of the eruption site (i.e., at the northeastern tip
magma propagation towards the eruption site, cf. Figure 6a–d). At the same time, the closest GNSS
of the uplift pattern that is related to the magma propagation towards the eruption site, cf. Figure 6a–d).
station FJAG was not located at the center of this post-eruptive subsidence pattern and, therefore,
At did
the not
same time,
pick up onthethe
closest
signalGNSS
(Figure station
6e,f andFJAG was7).not located at the center of this post-eruptive
Figure
subsidence pattern and, therefore, did not pick up on the signal (Figure 6e,f and Figure 7).You can also read