The rigidity dependence of galactic cosmic-ray fluxes and its connection with the diffusion coefficient - arXiv
←
→
Page content transcription
If your browser does not render page correctly, please read the page content below
arXiv:2203.06479v1 [astro-ph.HE] 12 Mar 2022

                                               The rigidity dependence of galactic
                                               cosmic-ray fluxes and its connection with the
                                               diffusion coefficient
                                               M. Vecchi 1,∗ , P.-I. Batista 2 , E. F. Bueno 1 , L. Derome3 , Y. Génolini4 , and
                                               D. Maurin 3
                                               1 Kapteyn Astronomical Institute, University of Groningen, Landleven 12, 9747 AD
                                               Groningen, The Netherlands
                                               2 Deutsches Elektronen-Synchrotron, Platanenallee 6, 15738 Zeuthen, Germany
                                               3 LPSC, Université Grenoble Alpes, CNRS/IN2P3, 53 avenue des Martyrs, 38026

                                               Grenoble, France
                                               4 Univ. Grenoble Alpes, USMB, CNRS, LAPTh, F-74940 Annecy, France

                                               Correspondence*:
                                               M. Vecchi
                                               m.vecchi@rug.nl

                                               ABSTRACT

                                                 Thanks to tremendous experimental efforts, galactic cosmic-ray fluxes are being measured up
                                               to the unprecedented percent precision level. The logarithmic slope of these fluxes is a crucial
                                               quantity that promises us information on the diffusion properties and the primary or secondary
                                               nature of the different species. However, these measured slopes are sometimes interpreted
                                               in the pure diffusive regime, guiding to misleading conclusions. In this paper, we have studied
                                               the propagation of galactic cosmic rays by computing the fluxes of species between H and Fe
                                               using the USINE code and considering all the relevant physical processes and an updated set
                                               of cross-section data. We show that the slope of the well-studied secondary-to-primary B/C
                                               ratio is distinctly different from the diffusion coefficient slope, by an offset of ∼ 0.2 in the rigidity
                                               range in which the AMS-02 data reach their best precision (several tens of GV). Furthermore,
                                               we have demonstrated that none of the species from H to Fe follows the expectations of the
                                               pure-diffusive regime. We argue that these differences arise from propagation processes such
                                               as fragmentation, convection, and reacceleration, which cannot be neglected. On this basis, we

                                                                                                                                                      1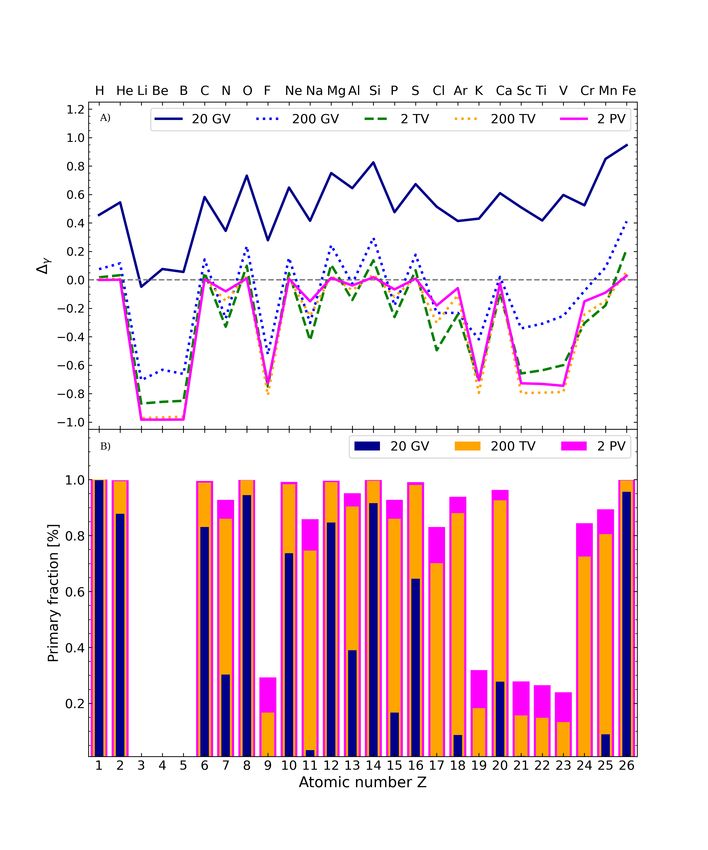
Vecchi et al.                                                Rigidity dependence of galactic cosmic-ray fluxes

also provide predictions for the spectral slope of elemental fluxes not yet analysed by the AMS
collaboration.

Keywords: astroparticle and fundamental physics, cosmic rays-diffusion-methods, high-energy astrophysical phenomena, cosmic-ray
nuclei, galactic cosmic particles, Phenomenology

1    INTRODUCTION
The Alpha Magnetic Spectrometer (AMS-02), taking data onboard the ISS for more than ten years, has
been providing for the first time measurements of galactic cosmic-ray (CR) fluxes in the GV to TV range
with percent level precision [1]. These new results have revealed unexpected spectral features that challenge
the theoretical framework used to describe the CR origin and propagation.
  Cosmic rays can be divided into two broad classes: primary species, such as carbon and oxygen, are
those accelerated at the sources, while secondary species, such as boron and lithium, are produced as a
consequence of nuclear interactions of primary species during their propagation through the interstellar
medium (ISM). The most promising observable to study the propagation of CRs in the Galaxy is studying
secondary species or the flux ratio of a secondary species to a primary one. The measurement of the
Boron-to-Carbon flux ratio, B/C in the following, has been widely used to test propagation scenarios. The
first evidence for a break in the B/C was found by AMS-02 [2, 3]. This break most probably originates
from a transition of diffusion regime rather than from source effects [4].
  We develop on our preliminary study [5] and use the USINE code [6] to show that the measured B/C slope
does not directly represent the diffusion coefficient value in the AMS-02 range, and that the measured slopes
for all species from H to Fe have non-trivial dependence with rigidity, especially for heavier elements.

2    METHOD
The transport in the Galaxy for a CR species of index i can be described by means of the following equation,
assuming steady-state [7]:


            n
         ~ x K(E) ∇
                                 o
                  ~ x Φi − V~c Φi +  ∂                 2      ∂Φ i
        −∇                              btot (E) Φi − β Kpp          + σi vi nism Φi + Γi Φi
                                    ∂E                        ∂E
                                    X
                             = qi +    {σj→i vj nism + Γj→i } Φj .                                                         (1)
                                                   j

  This equation provides the spatial and energy evolution of the differential interstellar CR density per unit
energy Φi ≡ dni /dE, assuming a net primary injection rate of qi , and an injection rate for secondary species
arising from inelastic processes converting heavier species of index j into i species (with a production rate
σj→i vj nism on the ISM density nism , or a decay rate Γj→i ). The form of the spatial diffusion coefficient
K(E) will be described in detail in the following. The other processes are mainly relevant at low rigidity.
However, they also affect the determination of the higher-energy parameters. The convection is described
by a velocity V~c , the diffusive reacceleration is parameterized by the energy-dependent coefficient Kpp , the

This is a provisional file, not the final typeset article                                                                    2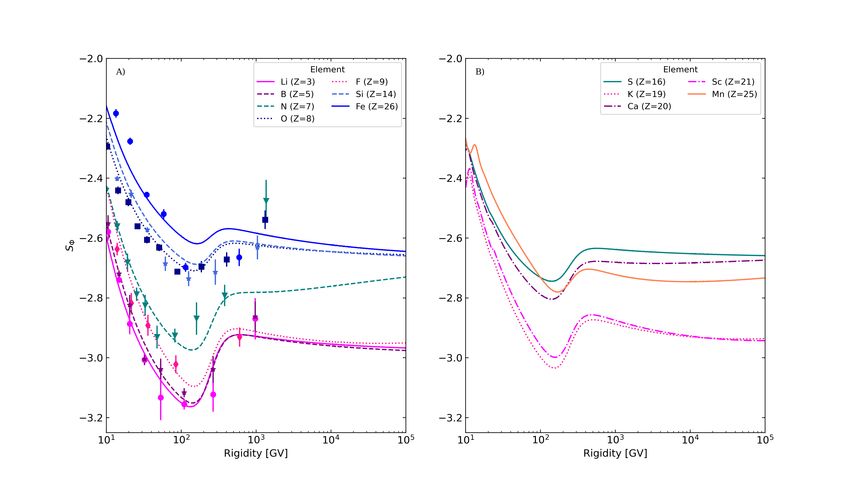
Vecchi et al. Rigidity dependence of galactic cosmic-ray fluxes
particle velocity is indicated as β, and the inelastic destruction rate is given by σi vi nism with the σ’s being
energy-dependent nuclear cross-sections; the rate characterizes energy losses btot ≡ dE/dt, which includes
ionization and Coulomb processes as well as adiabatic losses induced by convection, and a first-order term
from reacceleration.
Following the work presented in [8], our study is done in the frame of a 1D propagation model. In this
model, CRs are confined in the magnetic halo described as an infinite slab in the radial direction and
of half-height L. The value of L is fixed to 5 kpc, and it was found to have a negligible impact on the
results. The vertical coordinate z is the only relevant spatial coordinate in this frame. The sources of CRs
and the interstellar medium gas lie in the galactic disk, which has an effective half-height h = 100 pc.
Finally, the observer is located at z = 0. The diffusion coefficient is a crucial physical ingredient to describe
CR transport as it represents the scattering of CRs off magnetic turbulence. We assume that it is a scalar
function of rigidity, and that it is homogeneous and isotropic all over the magnetic slab. We follow the
approach presented in [8], where the diffusion coefficient includes a break in both the low- and high-rigidity
range:
−sh
δls−δ sl
δ δ−δh
R l R R sh
K(R) = βη K10 1+ 1+ .
|{z} Rl (R10 ≡ 10 GV) Rh
non-relativistic regime | {z }
| {z } intermediate regime | {z }
low-rigidity regime high-rigidity regime
(2)
We make use of the three propagation models, dubbed BIG, SLIM, and QUAINT, which were proposed
in [8]. These models were found to provide an accurate description of the B/C data from AMS-02 and
individual fluxes of Li, Be, B, and the helium isotopes [9].
For the nuclear production and spallation cross-sections, we use as reference the set of tables from the
Galprop package, following the approach described in [10] and recently updated as in [11]. We generate the
fluxes of CR nuclei using the source spectrum parameters discussed in [12] and the propagation parameters
described in [8] and [13]. The calculated fluxes are Top-of-Atmosphere quantities modulated with the
force field approximation. We obtain the modulation potential φ = 670 MV from the neutron monitor data
using the dedicated feature, available on the Cosmic Ray Data Base [14, 15], based on [16].
The slope of the diffusion coefficient is given by:
SK = d [log K(R)] /d [log R] = −S1/K , (3)
The slope of the measured CR flux SΦ is given by:
SΦ = d [log φ] /d [log R] , (4)
We use the following quantity to investigate the difference between the slope of the measured B/C and the
slope of the diffusion coefficient:
∆S = SB/C − S1/K , (5)
Frontiers 3Vecchi et al. Rigidity dependence of galactic cosmic-ray fluxes
As mentioned in the introduction, we also want to investigate the slope of the primary and secondary
species. To do so, we define, for all CR species from hydrogen to iron, the following slope ratio:
SΦ − (α(Z) + S1/K )
∆γ = . (6)
S1/K
where α(Z) describes the source spectral indices. In the purely diffusive regime, we recall that the slopes
of pure primary species are SΦ = S prim = −α(Z) − SK (R) implying ∆γ = 0, while for pure secondaries
SΦ = S sec = −α(Z) − 2SK (R), implying ∆γ = −1. In reality, all primary species have some fraction of
secondaries. To quantify it, it is useful to introduce the fraction fprim of primary origin in the total flux,
Φprim
given by: fprim = Φsec +Φprim
, with the elemental flux split as Φ = Φprim + Φsec , into a pure primary and a
pure secondary component. In this work we assumed Li, Be and B to be pure secondary species.
3 RESULTS
We discuss in this section our results, based on fluxes (or ratios) calculated as described above. For all
our calculated slopes, we choose not to show the associated uncertainties (deriving from the transport
parameter uncertainties and correlations) and mainly focus on the SLIM propagation configuration. Indeed,
these uncertainties are expected to be at the percent level, but they could reach up to tens of percent at TV
rigidities. They neither impact the features we wish to put forth nor the conclusions we reach here, and
they would only complicate the readability of the figures.
3.1 B/C vs diffusion slope: has the diffusive regime been reached in AMS-02 data?
At high rigidity enough, secondary-to-primary ratios are inversely proportional to the diffusion coefficient
K(R). Indeed, this rigidity-dependence is exact when diffusion becomes the dominant process in the
propagation of cosmic-rays: inelastic interactions, energy losses, convection, and reacceleration processes
compete with diffusion at low and intermediate energies (see, e.g. App. D in Derome et al. 10) and break
down this exact scaling. Solar modulation also impacts the slope up to hundreds of GV.
The diffusive regime is particularly appealing since it allows to directly read the diffusion slope from the
B/C data, without any modelling. The diffusion coefficient, in turn, gives us indications on the underlying
magnetic turbulence from which diffusion arises [17]. One common misconception in literature is about
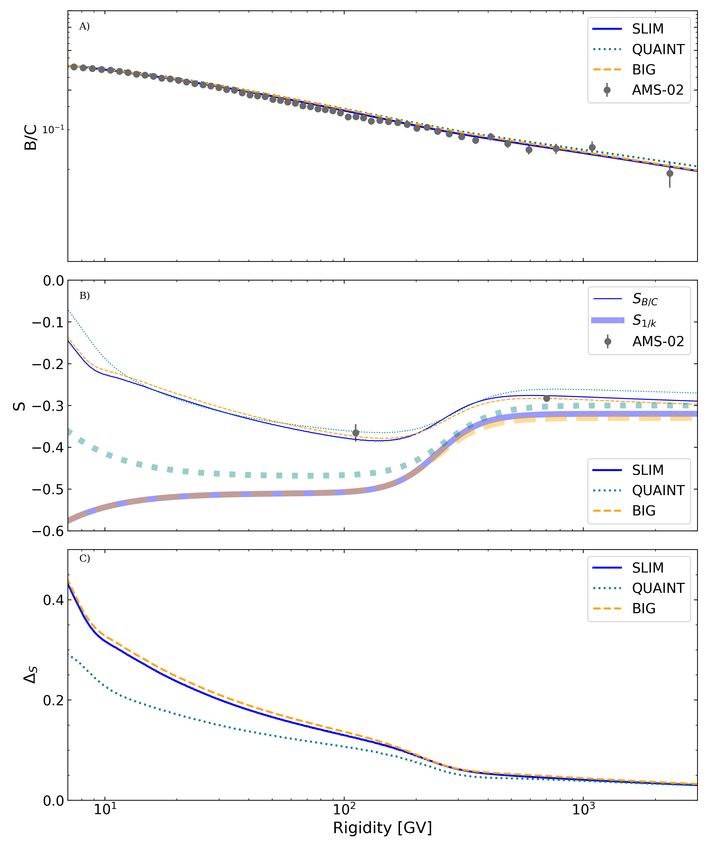
when the purely diffusive regime is reached. Figure 1 shows, for the propagation configurations BIG, SLIM,
and QUAINT discussed in the previous section (Sect. 2), three different panels highlighting the salient
differences between the B/C and 1/K(R) slopes, as a function of rigidity. The top panel (A) illustrates
that all these three configurations fit well the AMS-02 B/C data [8, 13]. The middle panel (B) shows the
corresponding slopes of these B/C calculations (thin lines)—the slopes in all model configurations are
similar since all calculations need to match the same B/C data. The modelled B/C slopes steadily decrease
up to the high-rigidity break around 300 GV; beyond, a constant slope is slowly reached (above hundreds
of TV). We immediately see that our best-fit diffusion coefficient slopes (thick lines) never matches the
B/C slopes, except at the highest rigidities, although the same overall behaviour is observed (low- and high-
rigidity change of slope). We stress that the behaviour is slightly different in QUAINT (cyan thick dotted
line) owing to the presence of reacceleration (absent in SLIM and BIG best-fit configurations). At any rate,
the diffusion coefficient at intermediate and high-rigidity regimes are constant with δ10−100 GV = 0.5±0.02
[13] and δ>300 GV = 0.3±0.15 [8]. These results favour a Kraichnan turbulence regime [18] at intermediate
rigidity and are also compatible with a Kolmogorov turbulence [19] spectrum after the rigidity break.
This is a provisional file, not the final typeset article 4Vecchi et al. Rigidity dependence of galactic cosmic-ray fluxes Figure 1. Shown as a function of rigidity and for the three configurations SLIM (blue solid lines), BIG (orange dashed lines), and QUAINT (cyan dotted lines) are (from top to bottom): (A) our B/C calculations (lines) and AMS-02 data [3]; (B) logarithmic slopes SB/C for the above B/C calculations (thin lines) and for AMS-02 data at two rigidities [3], along with the logarithmic slope S1/K for the inverse of the associated diffusion coefficient (thick lines); (C) ∆s = SB/C − S1/K , the difference between the B/C and 1/K(R) logarithmic slopes. These values are also consistent with the fact that the B/C slope for the AMS-02 data, shown in filled circles (in agreement with our B/C slope calculations in thin lines), is SB/C ∈ [60.3−192] GV ∼ 0.36 ± 0.02 and SB/C ∈ [192−3300] GV ∼ 0.28 ± 0.04 (see Fig. 3 of [3]). In passing, we stress that the difference of B/C slopes between these two rigidities does not happen in the purely diffusive regime. This difference cannot be directly translated as the difference between the slopes of the underlying magnetic turbulence Frontiers 5
Vecchi et al.                                          Rigidity dependence of galactic cosmic-ray fluxes

regimes. Finally, the bottom panel (C) shows the difference between the B/C data and 1/K(R) slopes,
i.e. the difference between the two families of curves (thick and thin) shown in the middle panel. In the
intermediate rigidity range, we see the slow convergence to the purely diffusive regime (∆S = 0). We
directly quantify how to recover the diffusion slope from the B/C data slope from these curves. Indeed, with
SK(R) = |SB/C | + ∆S , we see that we need to add to the slope measured in the data the value ∆S ≈ 0.15
at ∼ 100 GV and still ∆S ≈ 0.05 at a few TV. Our results show that a propagation model is needed to
extract the spectral index of the magnetic turbulence from the slope of secondary-to-primary ratios. Indeed,
the diffusive propagation regime is asymptotically reached at several hundreds of TV only. Assuming the
B/C slope directly provides the slope of the diffusion coefficient strongly biases the conclusions drawn on
the turbulence type; this bias grows with decreasing rigidities (at which the B/C slope is evaluated).

3.2   Understanding the behaviour of logarithmic slopes (Z = 1 − 26) vs rigidity

  Considering now the fluxes, it is interesting to see which propagation processes shape them. Their
logarithmic slope is usually a good indicator of their primary (acceleration from material at source only)
or secondary (produced via nuclear interactions of primary species during the transport only) origin.
However, as for the B/C ratio, the diffusive regime is only asymptotically reached for very high rigidities.
Furthermore, inelastic interactions, which play an important part at intermediate rigidities, roughly scale as
A2/3 (where A is the atomic number), so that a growing impact on the fluxes (hence the slopes) is expected
for growing atomic numbers.
  The logarithmic slopes, or rather the quantity ∆γ (see Eq. 6) is displayed in the top panel (A) of Fig. 2
as a function of Z = 1 − 26 (i.e., for H up to Fe) and for various rigidities (shown as different line styles
and colours). As discussed in Sec. 2, the definition of ∆γ allows to factor out the presence of the diffusion
break (similar for all species) and the different source spectral indices α(Z) [e.g., 12]. In the purely
diffusive regime, we recall that the slopes of primary and secondary species are S prim = −α(Z) − SK (R)
and S sec = −α(Z) − 2SK (R), which translates into ∆prim   γ    = 0 and ∆sec  γ = −1. If we first look at the
slopes at 20 GV (solid dark blue line), i.e. in a regime where other propagation processes are significant,
we have ∆γ > 0 for all species. This means that the slopes of the measured fluxes, Sdata , are always
                                                                  prim, sec       prim, sec
softer than those expected in the purely diffusive regime, i.e. |Sdata      | < |Spure diff. |. This behaviour is
expected since energy losses, inelastic interactions and Solar modulation effects (but also convection and
reacceleration if present) are known to transfer particles from high to low rigidity in the two first decades
measured by AMS-02. However, on the 20 GV curve, we can only unambiguously identify Li, Be, and B
as secondary species, owing to the ∼ 0.5 drop in their ∆γ values (compared to the neighbour species He
and C). Indeed, for growing Z, the impact of inelastic cross-sections is also rising, translating into growing
values of ∆γ and causing an increasing difficulty to identify which species are of primary or secondary
origin.
  The quantity ∆γ reaches the expected purely diffusive values at higher rigidities: at 200 GV, we already
see primary species closing on ∆γ = 0 and secondary species on ∆γ = −1 (except for Z & 20 where
inelastic interactions still have a significant impact). In principle, for the highest rigidity shown, i.e. 2 PV
(where the asymptotic diffusive regime holds), the heavy species should also converge to 0 or -1. However,
there is no such thing as a pure primary or pure secondary species. We recall that secondary species
have softer spectra (extra diffusion slope) than primary species. As a result, the fraction fprim of primary
origin in the total flux is a growing function of rigidity (except for Li, Be, and B whose primary fraction
was explicitly set to zero in the calculation). This is illustrated in the bottom panel (B) of Fig. 2 for
three rigidities. The rigidity dependence of ∆γ thus results from the competition of inelastic interactions

This is a provisional file, not the final typeset article                                                      6
Vecchi et al. Rigidity dependence of galactic cosmic-ray fluxes Figure 2. Shown for the SLIM model as a function of the charge Z = 1−26 (from H to Fe) and for various rigidities (colour-coded with different line styles) are: (A) ∆γ (see Eq. 6), the ‘normalised’ difference between the flux and the ‘source + diffusion’ logarithmic slopes; (B) primary fraction (relative to the total flux) for the elements. and primary content of the species. For instance, most species have their values shifted downward for growing rigidities. However, species whose primary fraction significantly changes above 20 GeV, e.g. the mixed-species N (Z = 7) with fprim going from ∼ 30% at 20 GV to ∼ 80% at 200 TV, have their Frontiers 7
Vecchi et al.                                          Rigidity dependence of galactic cosmic-ray fluxes

values shifted upwards above 2 TV. For the largest Z, where the impact of inelastic interactions is the
strongest and where most fprim also significantly vary, the evolution of ∆γ becomes non-trivial: this is
illustrated, for instance, by the behaviour of species with Z = 21 − 23, called sub-Fe, whose ∆γ values first
decrease with rigidity (decreasing impact of destruction), but then increase above 200 TV (growing fraction
fprim & 20%) of primaries in the flux). We stress that two opposite effects, namely the rigidity-dependent
primary fraction and the rigidity- and Z-dependent impact of destruction on the fluxes, complicate the
interpretation of the slopes of the nuclear species, except for almost ‘pure’ primary species (H, O, Si,
Fe) and ‘pure’ secondary light species (Li, Be, B, and partly F). These effects should lead to non-trivial
patterns for the slope of Z > 14 elements (see next section); these elements should be analysed soon by
the AMS collaboration. A last impacting effect we did not discuss here is the existence of contributions
from multi-step fragmentation [20], i.e. the fact that a species N1 breaks up into N2 , which itself can break
up into N3 . This leads to tertiary contributions (extra slope SK (R)) that could further impact the slope of
some of these heavy species up to several tens of GV.

3.3   Comparison to AMS-02 data for Z ≤ 14 and expectations for Z = 15 − 25 elements

   Now that we better understand the factors that drive the rigidity dependence of ∆γ (see previous
subsection), we can return to the rigidity dependence of the measured flux slope, SΦ (R). We stress that
the presence of the ∼ 300 GV high-rigidity break is no longer factored out, but that the salient features
seen in ∆γ should remain, that is: (i) the slope of most elements should be a fast decreasing function of R
below the break, but a slowly decreasing one (towards the pure diffusive regime value) above the break;
(ii) asymptotically, ‘pure’ primary and secondary species should be shifted by SK (R → ∞) ≈ 0.3 ± 0.15
[8], see discussion in Sect. 3.1; (iii) the growing impact of inelastic interactions with A should be visible,
especially at low rigidities, as decreasing slopes with Z; (iv) the impact of a growing primary fraction
should be seen as a slope starting close to the slopes of ‘pure’ secondary species (e.g., Li, Be, B) and
moving to those of ‘pure’ primary species (e.g., O, Si, Fe).
  We show the flux slopes SΦ (R) obtained in our calculations in Fig. 3. A similar slope dependence is
shown for instance in [21]. They are compared to the slopes of a selection of elements published by the
AMS-02 collaboration [1] in the left panel (A). We also show our predictions for a selection of elements
not yet analysed (i.e. among Z = 15 − 25) in the right panel (B).
  Focusing first on the left panel (A), we find that the modelled slopes follow the behaviour we just
recalled: (i) Li (Z = 3), B (Z = 5) and F (Z = 9), which have fprim < 5% up to tens of TV, are ordered
and shifted (i.e. decreasing SΦ (R)) according to their growing destruction cross-section, before all slopes
converge to the ‘universal’ secondary flux slope; (ii) the same ordering is observed for O (Z = 8), Si
(Z = 14), and Fe (Z = 26), though these species now converge towards the ‘universal’ primary flux slope
in our model; (iii) the pattern of a mixed species, N (Z = 7) is striking, as its flux slope starts close to the
‘pure secondary’ group and ends up close to the ‘pure primary’ group. We stress that if N were to have a
negligible primary fraction at tens of GV, its slope would be between B and F. Overall these predictions are
in very good agreement with the AMS-02 data (symbols), though our model is clearly much below for the
last N rigidity point, while the shape for Fe does not match the data above 100 GV (we briefly return to
these issues below). In our model, as reflected by the data, the source slope for H and He are taken to be
different from that of all other nuclei [12]. As a result, their flux slope would be shifted (compared to other
primary elements), and for readability reasons, we chose not to show them in the figure.
  Focusing on the right panel (B), that is, species in Z = 15 − 25 not analysed by AMS-02 yet, we see a
similar trend between ‘mostly’ primary and ‘mostly’ secondary species. Indeed, looking back at the bottom

This is a provisional file, not the final typeset article                                                     8
Vecchi et al.                                        Rigidity dependence of galactic cosmic-ray fluxes

Figure 3. The two panels show logarithmic slopes of TOA fluxes: in the left panel (A), for a selection
of elements already analysed by the AMS-02 collaboration (symbols, Aguilar et al. 1); in the right panel
(B), for a selection of elements accessible to the AMS-02 detector. The various lines correspond to our
calculation in the SLIM configuration. See text for discussion.

panel of Fig. 2, we see that the elements K (Z = 19) and Sc (Z = 21) have a primary fraction very similar
to that of F (i.e negligible at low and intermediate rigidities). The same should be the case of Ti and V
(not shown for readability), belonging to the so-called sub-Fe group (Z = 21 − 23). The slope of these
elements thus follows a similar pattern as F, though with a smaller slope at low rigidity, owing to the larger
impact of inelastic interactions on this heavier element. On the other hand, Ca (Z = 20) already has a
primary fraction of 30% at 20 GV, i.e. similar to that of N. The last two other elements shown, S (Z = 16)
and Mn (Z = 25), fall between K (and Sc) and Ca in terms of their primary content—they have a ∼ 10%
primary fraction at 20 GV (see bottom panel of Fig. 2)—, so that they are elements in which the effect
of destruction and the impact of their primary content are maximally mixed to shape the slopes. Beside
the fact that these flux slopes will converge to the asymptotic value of a primary flux, the fine details are
very sensitive to the exact tiny and uncertain primary content of these elements (AMS-02 data should help
constrain or set upper limits on these source terms).

  A final view of the trends and patterns in the flux slopes are illustrated by its Z dependence shown in
Fig. 4. This plot resembles the top panel of Fig. 2, but instead of ∆γ (Z), we now show SΦ (Z) at only two
rigidities, namely 20 GV (solid line) and 200 GV (dotted line): we do not show higher rigidities (for the
sake of readability), as the associated slope values would lie between these two curves (because of the
diffusion break at ∼ 300 GV, see in Fig. 3). As in the previous plot, we find a very good agreement between
the modelled slopes and the measured ones (except for H and Fe); for the value of the experimental slopes,
we use a simple interpolation for the desired rigidities from the published AMS-02 slopes [1].

Frontiers                                                                                                   9
Vecchi et al.                                          Rigidity dependence of galactic cosmic-ray fluxes

Figure 4. Logarithmic slope at 20 GV (solid dark blue line) and 200 GV (dotted blue line) of our TOA
flux calculation for Z = 1 − 26 elements. Slopes calculated from AMS-02 data points [1] are shown as
symbols at the corresponding energies.

  We recall that our models [8, 13] do not explicitly fit the source spectrum and source abundances. Rather,
they assume a rigidity power-law dependence for all species, three different source spectral indices (one for
H, one for He, and one for all other nuclei), and merely rescales elemental abundances on existing data at a
single energy point. For this reason, it is not surprising, given the minimal number of ingredients used in the
model, that some differences exist for some species. In particular, our models fail to match well low-rigidity
protons and iron (see also [21, 22] who face similar difficulties for Fe). The origin of the high-rigidity break
(and above) is still under scrutiny, and also the regions where AMS-02 data uncertainties are the largest.
Whether the discrepancy between our models and the data at these high rigidities is due to a limitation of
our models or statistical fluctuations in AMS-02 data are still to be investigated. For example, the modelled
slopes have significant uncertainties at high rigidities because the diffusion break parameters are not well
constrained (because of larger uncertainties on the data).

4   DISCUSSION
The best route to interpret the exquisite data collected by the AMS-02 experiment is to fit fluxes and
ratios with propagation models. However, because (i) the source spectra and the diffusion coefficients are
expected to be (or close to be) power-laws in rigidity, and (ii) in the purely diffusive regime, these fluxes
and ratios are simple combinations of the two above power-laws, it is tempting to bypass the use of a
propagation model and directly deduce their power-law index from the logarithmic slope of the measured
fluxes and ratios. Moreover, it is also tempting to conclude on the primary or secondary origin of CR
elements from the rigidity dependence of their flux slope.
  We showed and stress that the purely diffusive propagation regime is only reached above hundreds of TV.
The first consequence is that AMS-02 data, going up to a few TV at most, cannot be used to conclude on the
source slope or diffusion slope without an underlying propagation model. For instance, a B/C slope of 1/3
at a few hundred GV does not mean that the diffusion coefficient and the underlying magnetic turbulence
are Kolmogorov-like. Our analysis indicates that at these rigidities, other propagation processes lead to a
slope ∼ 0.2 away from that of the pure diffusive asymptotic regime, so that AMS-02 data actually favour

This is a provisional file, not the final typeset article                                                   10
Vecchi et al.                                       Rigidity dependence of galactic cosmic-ray fluxes

a Kraichnan-like turbulence (at intermediate rigidities). These effects (inelastic interactions, convection,
reacceleration, and also Solar modulation) still impact the slope of secondary-to-primary ratios and fluxes
around the rigidity break (∼ 300 GV). For this reason, it is also difficult to directly link the slope (before
and after the break) to the two fundamental quantities that are the source and diffusion slope.
  We also discussed in this paper the rigidity dependence (and Z dependence) of the flux slopes. The
general trends for all elements are the following: (i) decreasing slopes due to the transition from ‘all
propagation effect matter’ to the diffusion-dominated regime, (ii) shallower slopes for heavier nuclei
because of their larger inelastic cross-sections, (iii) overall shift between primary and secondary species.
However, we highlighted that the competition between inelastic interactions (growing with Z) and primary
content of the elements (growing with R) leads to non-trivial dependencies of the flux slopes, especially for
the awaited AMS-02 measurements for Z = 15 − 25. Indeed, two families of slopes should be observed:
the ‘almost purely’ secondary species (K, Sc, Ti, and V) with a shallower slope, and the remaining elements
(whose primary content varies between a few percent up to 30% at 20 GV) with steeper and more dispersed
slopes.
  Measured flux slopes have non-trivial behaviours, but they remain interesting to show for the following
reasons: (i) qualitative information on rigidity breaks can be obtained without any underlying propagation
model (breaks are more easily seen in the logarithmic slopes than in the flux themselves); (ii) as underlined
above, whether CR elements are (almost purely of) primary or secondary origin can be roughly concluded
from their observed slope difference (& 0.3 above ∼ 100 GV); (iii) finally, whether the measured slopes
reach the expected asymptotic regime could be a useful validation of the model or of its limitation. For
instance, stochasticity of the sources impacts the rigidity dependence of the fluxes [23], though with
a negligible impact below several tens or TV [24, 25, 26]. At these energies (and higher), interesting
information should be brought by forthcoming data of space calorimeters such as DAMPE [27], CALET
[28] and NUCLEON [29].

CONFLICT OF INTEREST STATEMENT
The authors declare that the research was conducted in the absence of any commercial or financial
relationships that could be construed as a potential conflict of interest.

AUTHOR CONTRIBUTIONS
MV took the lead on the research work by running the simulations, performing most of the analysis and
producing all the figures. PB, EB, LD and DM contributed to the code development. MV, DM and YG
wrote substantial parts of the manuscript. All authors contributed equally to the discussions, read the
manuscript and provided critical feedback.

FUNDING
MV acknowledges the financial support of the University of Groningen.

ACKNOWLEDGMENTS
MV acknowledges the valuable discussion and encouragement from Mathieu Boudaud during the early
phases of this work.

Frontiers                                                                                                  11
Vecchi et al.                                          Rigidity dependence of galactic cosmic-ray fluxes

REFERENCES
 [1] Aguilar M, Ali Cavasonza L, Ambrosi G, Arruda L, Attig N, Barao F, et al. The Alpha Magnetic
     Spectrometer (AMS) on the international space station: Part II - Results from the first seven years.
     Phys. Rep. 894 (2021) 1–116. doi:10.1016/j.physrep.2020.09.003.
 [2] Aguilar M, Ali Cavasonza L, Ambrosi G, Arruda L, Attig N, Aupetit S, et al. Precision Measurement
     of the Boron to Carbon Flux Ratio in Cosmic Rays from 1.9 GV to 2.6 TV with the Alpha Magnetic
     Spectrometer on the International Space Station. Physical Review Letters 117 (2016) 231102. doi:10.
     1103/PhysRevLett.117.231102.
 [3] Aguilar M, Ali Cavasonza L, Ambrosi G, Arruda L, Attig N, Aupetit S, et al. Observation of
     New Properties of Secondary Cosmic Rays Lithium, Beryllium, and Boron by the Alpha Magnetic
     Spectrometer on the International Space Station. Phys. Rev. Lett. 120 (2018a) 021101. doi:10.1103/
     PhysRevLett.120.021101.
 [4] Génolini Y, Serpico PD, Boudaud M, Caroff S, Poulin V, Derome L, et al. Indications for a High-
     Rigidity Break in the Cosmic-Ray Diffusion Coefficient. Phys. Rev. Lett. 119 (2017) 241101.
     doi:10.1103/PhysRevLett.119.241101.
 [5] Vecchi M, et al. Is the B/C slope in AMS-02 data actually telling us something about the diffusion
     coefficient slope? PoS ICRC2019 (2020) 145. doi:10.22323/1.358.0145.
 [6] Maurin D. USINE: Semi-analytical models for Galactic cosmic-ray propagation. Computer Physics
     Communications 247 (2020) 106942. doi:10.1016/j.cpc.2019.106942.
 [7] Amato E, Blasi P. Cosmic ray transport in the Galaxy: A review. Adv. Space Res. 62 (2018) 2731–2749.
     doi:10.1016/j.asr.2017.04.019.
 [8] Génolini Y, Boudaud M, Batista PI, Caroff S, Derome L, Lavalle J, et al. Cosmic-ray transport from
     AMS-02 boron to carbon ratio data: Benchmark models and interpretation. Phys. Rev. D 99 (2019)
     123028. doi:10.1103/PhysRevD.99.123028.
 [9] Weinrich N, Boudaud M, Derome L, Génolini Y, Lavalle J, Maurin D, et al. Galactic halo size in the
     light of recent AMS-02 data. A&A 639 (2020) A74. doi:10.1051/0004-6361/202038064.
[10] Derome L, Maurin D, Salati P, Boudaud M, Génolini Y, Kunzé P. Fitting B/C cosmic-ray data in the
     AMS-02 era: a cookbook. Model numerical precision, data covariance matrix of errors, cross-section
     nuisance parameters, and mock data. A&A 627 (2019) A158. doi:10.1051/0004-6361/201935717.
[11] Maurin D, Bueno EF, Génolini Y, Derome L, Vecchi M. On the importance of Fe fragmentation for
     LiBeB analyses: Do we need a Li primary source to explain AMS-02 data? (2022).
[12] Boudaud M, Génolini Y, Derome L, Lavalle J, Maurin D, Salati P, et al. AMS-02 antiprotons’
     consistency with a secondary astrophysical origin. Physical Review Research 2 (2020) 023022.
     doi:10.1103/PhysRevResearch.2.023022.
[13] Weinrich N, Génolini Y, Boudaud M, Derome L, Maurin D. Combined analysis of AMS-02
     (Li,Be,B)/C, N/O, 3 He, and 4 He data. A&A 639 (2020) A131. doi:10.1051/0004-6361/202037875.
[14] Maurin D, Melot F, Taillet R. A database of charged cosmic rays. A&A 569 (2014) A32. doi:10.1051/
     0004-6361/201321344.
[15] Maurin D, Dembinski H, Gonzalez J, Maris IC, Melot F. Cosmic-Ray Database Update: Ultra-
     High Energy, Ultra-Heavy, and Antinuclei Cosmic-Ray Data (CRDB v4.0). Universe 6 (2020) 102.
     doi:10.3390/universe6080102.
[16] Ghelfi A, Maurin D, Cheminet A, Derome L, Hubert G, Melot F. Neutron monitors and muon detectors
     for solar modulation studies: 2. φ time series. Adv. Space Res. 60 (2017) 833–847. doi:10.1016/j.asr.
     2016.06.027.

This is a provisional file, not the final typeset article                                             12
Vecchi et al. Rigidity dependence of galactic cosmic-ray fluxes
[17] Mertsch P. Test particle simulations of cosmic rays. Ap&SS 365 (2020) 135. doi:10.1007/
s10509-020-03832-3.
[18] Kraichnan RH. Inertial-Range Spectrum of Hydromagnetic Turbulence. Physics of Fluids 8 (1965)
1385–1387. doi:10.1063/1.1761412.
[19] Kolmogorov A. The Local Structure of Turbulence in Incompressible Viscous Fluid for Very Large
Reynolds’ Numbers. Akademiia Nauk SSSR Doklady 30 (1941) 301–305.
[20] Génolini Y, Maurin D, Moskalenko IV, Unger M. Current status and desired precision of the isotopic
production cross sections relevant to astrophysics of cosmic rays: Li, Be, B, C, and N. Phys. Rev. C
98 (2018) 034611. doi:10.1103/PhysRevC.98.034611.
[21] Schroer B, Evoli C, Blasi P. Intermediate-mass and heavy Galactic cosmic-ray nuclei: The case of
new AMS-02 measurements. Phys. Rev. D 103 (2021) 123010. doi:10.1103/PhysRevD.103.123010.
[22] Boschini MJ, Della Torre S, Gervasi M, Grandi D, Jóhannesson G, La Vacca G, et al. The Discovery
of a Low-energy Excess in Cosmic-Ray Iron: Evidence of the Past Supernova Activity in the Local
Bubble. ApJ 913 (2021) 5. doi:10.3847/1538-4357/abf11c.
[23] Génolini Y, Salati P, Serpico PD, Taillet R. Stable laws and cosmic ray physics. A&A 600 (2017) A68.
doi:10.1051/0004-6361/201629903.
[24] Salati P, Génolini Y, Serpico P, Taillet R. The proton and helium anomalies in the light of the Myriad
model. European Physical Journal Web of Conferences (2017), European Physical Journal Web of
Conferences, vol. 136, 02006. doi:10.1051/epjconf/201713602006.
[25] Porter TA, Jóhannesson G, Moskalenko IV. Deciphering Residual Emissions: Time-dependent Models
for the Nonthermal Interstellar Radiation from the Milky Way. ApJ 887 (2019) 250. doi:10.3847/
1538-4357/ab5961.
[26] Evoli C, Amato E, Blasi P, Aloisio R. Stochastic nature of Galactic cosmic-ray sources. Phys. Rev. D
104 (2021) 123029. doi:10.1103/PhysRevD.104.123029.
[27] Chang J, et al. The DArk Matter Particle Explorer mission. Astropart. Phys. 95 (2017) 6–24.
doi:10.1016/j.astropartphys.2017.08.005.
[28] Torii S, Marrocchesi PS. The CALorimetric Electron Telescope (CALET) on the International Space
Station. Adv. Space Res. 64 (2019) 2531–2537. doi:10.1016/j.asr.2019.04.013.
[29] Atkin E, et al. First results of the cosmic ray NUCLEON experiment. JCAP 07 (2017) 020.
doi:10.1088/1475-7516/2017/07/020.
Frontiers 13You can also read