The performance of ensemble based free energy protocols in computing binding affinities to ROS1 kinase - Nature
←
→
Page content transcription
If your browser does not render page correctly, please read the page content below
www.nature.com/scientificreports
OPEN The performance
of ensemble‑based free energy
protocols in computing binding
affinities to ROS1 kinase
Shunzhou Wan1, Agastya P. Bhati1, David W. Wright1, Alexander D. Wade1, Gary Tresadern2,
Herman van Vlijmen2 & Peter V. Coveney1,3,4*
Optimization of binding affinities for compounds to their target protein is a primary objective in drug
discovery. Herein we report on a collaborative study that evaluates a set of compounds binding to
ROS1 kinase. We use ESMACS (enhanced sampling of molecular dynamics with approximation of
continuum solvent) and TIES (thermodynamic integration with enhanced sampling) protocols to rank
the binding free energies. The predicted binding free energies from ESMACS simulations show good
correlations with experimental data for subsets of the compounds. Consistent binding free energy
differences are generated for TIES and ESMACS. Although an unexplained overestimation exists,
we obtain excellent statistical rankings across the set of compounds from the TIES protocol, with a
Pearson correlation coefficient of 0.90 between calculated and experimental activities.
ROS1 is a receptor tyrosine kinase closely related to the anaplastic lymphoma kinase (ALK) and leukocyte
tyrosine kinase (LTK) based on sequence similarity of their kinase domains. The ROS1 protein is composed of
an extracellular domain containing several fibronectin-like repeats and a cytoplasmic kinase domain. Genomic
rearrangements involving ROS1 have been detected in a variety of cancers including non-small cell lung cancer
(NSCLC), glioblastoma, and colorectal cancer amongst others. Chimeric fusion proteins involving ROS1 fused
to the N-terminal domains of different unrelated proteins have been shown to be o ncogenic1. Marketed kinase
inhibitor drugs such as Crizotinib and Entrecitinib are active at various kinases including ALK and ROS1 and
are used in the treatment of NSCLC. Although the rate of oncogenic ROS1 fusions is generally low, for instance
1–2% in NSCLC, it may be higher in other cancers2, 3. Consequently, the search for ROS1-targeted therapies is
the subject of extensive investigation.
The development of a new drug is an expensive and time-consuming process that takes around 10–15 years
with an average cost of US $ 1.3–2.9 billion4, 5. Virtual screening approaches have been increasingly applied in
the drug discovery process, evidenced by their involvement in more than 70 approved drugs6. In most cases,
computational approaches have been extensively used in the initial stages including hit to lead and lead optimi-
sation. They can offset the costs associated with bringing novel drugs to market, and accelerate the preclinical
drug screening process.
Docking is the most prominently used virtual screening approach. It has been employed as a fast way to
predict whether a given compound is able to bind to a specific target, and to estimate the putative bound con-
formation of the compound. Docking approaches perform well at recapitulating binding modes and assessing
the fit of molecules into binding sites. Furthermore, this placement ability allows them to separate active and
inactive molecules and provide enriched selections with greater chance of showing bioactivity. However, the
docking scores are generally not an accurate indicator for the binding energies and cannot rank the activity of
structurally similar molecules. Consequently, more sophisticated approaches are needed that on the one hand
capture the dynamic nature of protein ligand binding, whilst also providing a more correct physical assessment
of the interaction and binding energies. Molecular dynamics simulations are well suited to study the dynamics
of the proteins, refined binding poses, and more importantly, generate more reliable predicted binding affinities.
1
Department of Chemistry, Centre for Computational Science, University College London, London,
UK. 2Computational Chemistry, Janssen Research & Development, Turnhoutseweg 30, 2340 Beerse,
Belgium. 3Advanced Research Computing Centre, University College London, London WC1H 0AJ,
UK. 4Computational Science Laboratory, Institute for Informatics, Faculty of Science, University of Amsterdam,
Amsterdam, The Netherlands. *email: p.v.coveney@ucl.ac.uk
Scientific Reports | (2022) 12:10433 | https://doi.org/10.1038/s41598-022-13319-6 1
Vol.:(0123456789)www.nature.com/scientificreports/
hinge
solvent
bridge
hydrophobic
L2 -10.49 kcal/mol L30 -7.6 kcal/mol
Figure 1. Compounds L2 and L30, with which other compounds are paired for the TIES simulations. The
cycles show where the modifications are made. The four positions, at which variations are made, are labelled as:
hinge (hg) which interacts with the hinge of the kinase, hydrophobic (hy) which binds in a hydrophobic pocket,
solvent (s) which points toward the bulk solvent, and bridge (b) which sits in the middle of the compounds.
In recent years, a lot of effort has been invested to develop workflows that simplify and automate the process
of free energy c alculations7, which includes steps to plan, set up and execute simulations, and to analyse the final
results. A few automated pipelines have been developed for free energy calculations, including commercial ones
like FEP+8 and Molecular Operating Environment (MOE)9, and non-commercial ones like Amber free energy
workflow (FEW)10, FESetup11, FEPrepare12, CHARMM-GUI FEP c alculator13, to name just a few. Our group
also developed an automatic, high throughput workflow to run free energy simulations, known as the binding
affinity calculator (BAC)23. The workflows have found promising applications in academia as well as industry.
FEP+8, for example, is the free energy calculation suite from Schrödinger Inc. that has made a significant impact
in the pharmaceutical industry. To obtain reliable and reproducible free energy estimation, we have developed
two ensemble-based protocols in the last few years, named ESMACS (enhanced sampling of molecular dynamics
with approximation of continuum solvent)7, 14 and TIES (thermodynamic integration with enhanced sampling)7,
15
. ESMACS is an end-point approach based on the molecular mechanics Poisson-Boltzmann surface area method
(MMPBSA)16, and TIES is an alchemical approach centred on thermodynamic integration (TI). Our group has
recently publicly released the comprehensive TIES toolkit (https://www.ties-service.org/) to automatically setup,
execute, and analyse such calculations. We recently undertook a systematic uncertainty quantification (UQ)
analysis of molecular simulations and binding free energy estimations, and showed that ensembles are required
to acquire robust statistical measures of uncertainty, which address both parametric and stochastic components
of MD simulations17. The names of our methods emphasise the central importance of the ensemble-based nature
of the protocols employed7, 14, 18. Ensemble approaches lead to increased reliability and reproducibility, with
tighter control of standard errors revealing the distribution of results that can be o btained7, 19–22. ESMACS and
TIES are performed using a binding affinity calculator (BAC)23, a computational pipeline designed to automate
the end-to-end execution of free energy calculations, and to handle ensemble calculations.
The purpose of the present study is to evaluate the ability of ESMACS and TIES to estimate binding affinities
of a set of 150 compounds to the ROS1 protein target. Like many protein kinases, the binding site of ROS1 is
well structured, and the binding mode for the scaffold of the congeneric series is clearly defined in the crystal
structure. Under such circumstances, it is reasonable to expect that good predictions can be achieved, although
rotatable bonds in some of the compounds may pose a challenge for conformational sampling and hence con-
vergence of the predictions.
Methods and simulations
In this section, we first describe the dataset of the compounds and the preparation of the molecular models before
explaining the two methodologies used to predict binding affinity values.
Compound set. A set of kinase inhibitor candidates for ROS1 was available from Janssen, which comprises
150 compounds from an internal ROS1 inhibition lead optimization program. The compounds are numbered
as per the order in the file provided by Janssen. They are all based on the same chemical scaffold, a tetrahydro-
pyrazolopyrazinone (Fig. 1). The ROS1 activity is provided from a biochemical substrate inhibition assay and
a cell proliferation assay. The former is preferred here for comparing with calculated binding free energies. The
pIC50 of the compounds ranged from 5.03 to 8.37, a total of 3.34 log units (no activity was detected for five of
the compounds at the highest concentration (10 μM) tested; a pIC50 of 5.00 was used hereafter). To capture the
experimental variability, we extracted all data for repeat bioactivity measurements of the same compound in the
same assay. The average standard deviation in p IC50 for compounds tested at least twice in the ROS1 biochemical
Scientific Reports | (2022) 12:10433 | https://doi.org/10.1038/s41598-022-13319-6 2
Vol:.(1234567890)www.nature.com/scientificreports/
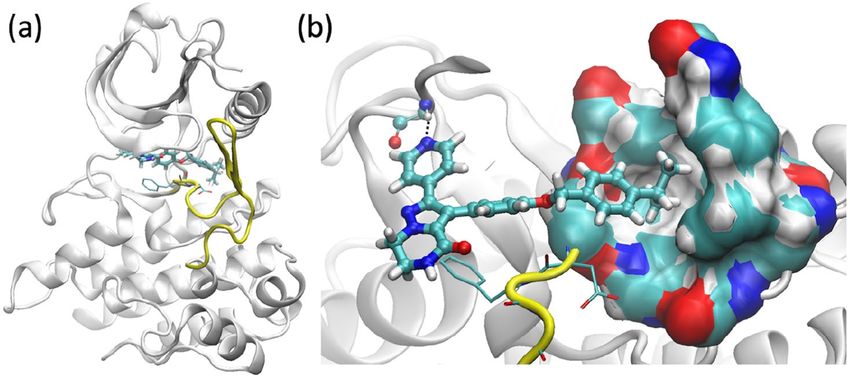
Figure 2. Structures of ROS1 complexed with compound L2: (a) overall structure and (b) the binding site,
showing the hydrophobic binding pocket and a hydrogen bond (dashed line) of the compound with one hinge
residue. The compound is shown in ball-and-stick representation. The activation loop (yellow), beginning with a
conserved DFG motif (thin sticks), adopts an inactive DFG-out conformation.
assay was 0.12 log units. This is considered an underestimate of the true experimental error which should also
include considerations of new compound samples, different assay conditions and laboratories etc.
The compounds differ with functional groups added at different positions of the scaffold (Fig. 1), which
interact with different regions of the binding p ocket24. The hinge (hg) position interacts with the adenine region
of the pocket, where one hydrogen bond forms with a hinge residue. The functional groups at the hydrophobic
(hy) position binds in a hydrophobic pocket. The solvent (s) position interacts with a solvent exposure region,
and also partial exposes to the bulk solvent. The atoms at bridge (b) position sit in the middle of the compounds,
and interact with a buried region at the bottom of the binding pocket. Modifications at these positions can
change the binding affinity and/or the selectivity of the compounds. The compounds can be grouped based on
their electrostatic properties (charged and non-charged), or the positions where functional groups are added.
The DFG kinase motif is a conserved Asp-Phe-Gly tripeptide at the proximal end of a flexible activation loop
(A-loop). Two distinct conformations, DFG-in and DFG-out, are often observed in the kinase structures, which
indicate the catalytic states of the kinases. There are two ROS1 X-ray structures in the protein data bank (PDB
IDs: 4UXL and 3ZBF), both in an active DFG-in conformation. Janssen have obtained four crystallographic
structures. All of them have an inactive DFG-out conformation and are complexed with compounds that share
the same scaffold (Fig. 1).
Model preparation and molecular simulation. Chain A of one of the Janssen structures has been used
for the current study, in which ROS1 adopts the DFG-out conformation (Fig. 2). The missing residues in the
A-loop are constructed by ModLoop25. All water molecules in the pdb file are retained. There are three phos-
phorylated tyrosine residues in the X-ray structures; they are phosphorylated as well in the simulations. The
compounds were docked with the protein using the OpenEye Posit m ethod26, drawing on information from the
bound ligands to improve pose prediction. All the compounds share the same binding pose at the ROS1 binding
site, forming one hydrogen bond with the hinge residue (Fig. 2). The docked structures for all of the compounds
have the scaffold well aligned with that in the X-ray structure. They are used as the initial structures for ESMACS
simulations. For each of the hybrid compounds in the TIES simulations, the docked position for one of the two
compounds is used while additional atoms from another compound are placed accordingly by T IES2027 (https://
ccs-ties.org) to retain their original conformation. No obvious steric clashes are detected between the hybrid
compounds and the protein in any of the initial TIES models.
Preparation and setup of the simulations were implemented using the BAC (binding affinity calculator)23,
including parametrization of the compounds, solvation of the complexes, electrostatic neutralization of the sys-
tems by adding counterions and generation of configurations files for the simulations. Protein parameters were
taken from the standard Amber force field for bioorganic systems (ff14SB)28. Ligand parameterizations were
produced using the general Amber force field 2 (GAFF2). The partial charges of the compounds were generated
using AM1-BCC method which has been suggested to be preferable compared with the RESP m ethod22.
All ligand–protein complexes were solvated in orthorhombic water boxes with a minimum extension from the
protein of 14 Å. The protonation states of the residues were assigned using the “reduce” module of A mberTools28.
Counterions were added to electrostatically neutralize the systems.
ESMACS. We use the ESMACS14 protocol for the free energy calculations. We also used T IES15 for the pre-
diction of relative free energies, described later. The protocols use ensembles of replicas to obtain reproducible
binding affinity estimates with robust uncertainty estimates. ESMACS is based on MMPBSA calculations but
incorporates a variety of sampling approaches and entropic c alculations29, 30. Here conformations of the com-
plex, receptor and compound are all extracted from simulation of the complex, a protocol termed as 1traj31. This
Scientific Reports | (2022) 12:10433 | https://doi.org/10.1038/s41598-022-13319-6 3
Vol.:(0123456789)www.nature.com/scientificreports/
is the commonly used approach for the end-point free energy methods. It achieves good convergence because
of the cancellation between the noisy terms of the internal energies of the ligand, receptor and complex. Upon
binding, however, conformational changes occur for both protein and ligands, which associate with adaptation
free energies14. They are the energy differences between the free state and the bound state. Studies have shown
that the inclusion of adaptation energies clearly improves the predictions of binding free energy ranking for
some molecular systems14, 29, 32, while the situation may be more complicated for others30, 31. The entropic contri-
butions are commonly calculated by normal mode analysis. The computational cost and numerical instability of
normal mode a pproach33, however, have motivated alternatives for the entropy calculations, including interac-
tion entropy34, weighted solvent accessible surface area35, and external entropy correction33. Although the inclu-
sion of entropic contribution can bring the estimated free energies closer to more physically realistic values, it
fails to improve correlations in most cases30, 31, 36, 37. For a rational drug development project, the correct ranking
of binding affinities is more important for the selection of compounds for further investigation. In the current
study, the entropic contribution is omitted in the ESMACS free energy calculations. The binding free energies
of multiple compounds are investigated to the same protein receptor. The adaptation energy can be calculated
in relative terms using the average energy of the protein29, which is then incorporated into 1traj, a protocol des-
ignated as 1traj-ar31.
Ensembles of N AMD38 simulations with 25 replicas were performed, with different initial velocities drawn
independently from a Maxwell–Boltzmann distribution. A series of equilibration runs, totalling 2 ns, were con-
ducted, with the restraints on heavy atoms gradually removed. Finally, 4 ns production simulations were run for
each replica for all ESMACS and TIES simulations. For the ESMACS free energy calculations, the conformations
of the protein and the ligands were extracted from the complex simulations.
TIES. We use T IES15 to predict free energy differences for two groups of compound pairs, using compounds
L30 and L2 as the reference structures. The two compounds differ by an isopropyl group which extends into a
hydrophobic binding pocket (Fig. 2b). TIES2027 is used to identify the maximum common substructure and
to generate the topology and coordinate files for the hybrid compounds. A total of 103 compound pairs have
been constructed using the two reference compounds. The compound pairs are chosen so that the atoms in the
reference compounds are largely in the common region, with no more than 5 atoms in the alchemical region
from each of the compounds. The standard TIES p rotocol15, 27 is used, in which an ensemble of 5 replicas is
used for each pair of the compounds. The TIES toolkit (https://ccs-ties.org/) has been used to automate all of
these steps for this study.
While the first group mainly focuses on the differences at the hydrophobic site, the compounds in the sec-
ond group share the same isopropyl group at the hydrophobic site but differ at other functional site(s) (Fig. 1).
Compound L2 is in both of the groups, and is one of the best binders in the first group. The grouping indeed
represents the common lead optimisation steps: optimising one functional position of the lead to find more
promising compounds, and then adding/changing functional groups at other positions.
The majority of TIES simulations—74 out of 103—are performed with NAMD. The remaining 29 pairs are
studied with OpenMM39. The two MD engines were used to take advantage of the architectures of different super-
computers. We use NAMD on CPU-based ARCHER2 (https://w ww.a rcher 2.a c.u
k/) and SuperMUC-NG (https://
doku.lrz.de/display/PUBLIC/SuperMUC-NG), and use OpenMM on the GPU partition of Summit (https://
www.olcf.ornl.gov/summit/). Our previous studies have shown that, for the same molecular systems, consistent
free energies are obtained not only from different supercomputers using the same MD engine—NAMD in this
case32, but also from different MD engines on different s upercomputers21, 40—NAMD38 running on CPUs and
OpenMM39 or pmemdGTI41 running on GPUs.
Results
ESMACS results. A moderate correlation, r = 0.33, is obtained for the entire set of the compounds (Fig. 3).
The predicted binding free energies appear to be more negative for the charged compounds. These compounds
have no obvious differences with the electrostatically neutral ones in their structural and dynamic behaviours.
The inclusion of receptor adaptation energy in the 1traj-ar approach causes the calculated binding free energies
to be scattered more widely, with a reduced correlation coefficient (r = 0.22).
The scaffold is aligned well for all the compounds in their initial structures; it has the same pose as shown
in Fig. 2. For the compounds with similar experimental binding affinities, the free energies of the charged ones
are more favourably predicted than the electrostatically neutral ones (Fig. 3). A good correlation is obtained for
the charged compounds, with a correlation coefficient of 0.84. This is largely due to the correct predictions of
the ranking for the two compounds with less favourable binding affinities (Fig. 3). The correlation coefficient
exhibits no improvements when the charged compounds are excluded, having the same correlation coefficient
of 0.33 but a reduced covariance from 1.37 to 1.11 kcal/mol. The weak correlation is due to the wide spread of
the predictions for the compounds with less favourable binding affinities. More negative predictions are made
for some of these compounds (Fig. 3), which are caused by more negative van der Waals contributions. It should
be noted that, because of the exclusion of entropic contributions, the predicted binding free energies are much
more negative than the experimental measurements. The inclusion of entropy terms typically reduces errors but
does not improve the correlations, as noted in previous studies30, 31, 36, 37.
Based on the positions and the chemical properties of the modifications made to the scaffold (Fig. 1, Table 1),
the compounds are clustered into different groups. The grouping is based on the following categories: (1) ether
variation at position hy in Fig. 1, (2) pyridyl variation at position hg, (3) central aryl variation at position b, (4)
lactam substituent variation at position s. About one third of the compounds have modifications at more than
1 positions. This results in a division of the dataset into 7 subgroups: 0, 1, 2, 3, 4, 14 and 34. Subgroup 0 consists
Scientific Reports | (2022) 12:10433 | https://doi.org/10.1038/s41598-022-13319-6 4
Vol:.(1234567890)www.nature.com/scientificreports/
1traj 1traj-avg-rec
-20 -20
all (150) ligands, r=0.33 r = 0.22
charged ligands
-30 -30
∆GESMACS (kcal/mol)
∆GESMACS (kcal/mol)
-40 -40
-50 -50
-60 -60
-12 -10 -8 -6 -12 -10 -8 -6
∆Gexp (kcal/mol) ∆Gexp (kcal/mol)
Figure 3. Comparison of calculated binding free energies and experimental binding affinity data from 1traj and
1traj-ar ESMACS approach. The charged compounds are shown in orange.
Subgroupa 0 1 2 3 4 14 34 1 + 14
No. of comp 1 36 7 25 26 31 14 67
Pearson r – 0.66 0.28 0.10 −0.39 0.52 −0.37 0.68
Spearman ρ – 0.66 0.18 0.21 −0.49 0.37 −0.06 0.61
Kendall τ – 0.48 0.15 0.14 −0.40 0.24 0.03 0.43
Table 1. Correlations of calculated and experimental binding free energies for the subgroups of the
compounds. a The subgroups are defined using single categories (1–4) or combinations of these categories. 14,
for example, is a subgroup of compounds with modifications of (1) ether variation and (4) lactam substituent
variation. “1 + 14” is a subset of compounds from subgroups 1 and 14. L30 is labelled as the only member in
subgroup 0. Only electrostatically neutral compounds are included.
of the sole compound L30 (Fig. 1b), subgroups 1–4 have compounds with modifications (1)–(4), respectively,
subgroup 34 has compounds with modifications (3) and (4), and subgroup 14 has compounds with modifications
(1) and (4), and additional modification (3) for 4 of the compounds. These 4 compounds are grouped into 14
as the modification (3) is minor, with only one hydrogen atom being replaced by a fluorine atom, which should
not affect the ligand–protein interactions significantly. At position s, a diverse modification is introduced in
subgroup 4, with different sizes, up to 10 heavy atoms, and different chemical properties; a limited modification
is applied at this position in subgroups 14 and 34, with no more than 5 heavy atoms added there. The subgroup
within category 1 shows a strong correlation (r = 0.66), while additional modification within category 4 (subgroup
14) weakens the correlation slightly (r = 0.52) (Fig. 4). The combination of the two subgroups, containing about
half of the neutral compounds, yields a similar correlation to that for subgroup 1. The compounds in these two
subgroups have functional groups modified at positions s and hy. The position is located at the solvent accessible
region of the binding pocket, while the position hy is accommodated in a relatively spacious hydrophobic region.
No significant conformational changes are needed from protein to accommodate the functional groups for com-
pounds in subgroups 1 and 14. The 1traj protocol and the simulation length used here work well for such cases.
By contrast, the modifications at position hg (subgroup 2) are likely to affect the hydrogen bond of the ligands
with the hinge residue, the modifications of the aryl group at position b (subgroup 3) affect the interactions of
the compounds with the buried region where the gatekeeper residue locates, and large modifications at position
s (subgroup 4) disturb the solvent exposure region. The changes at these positions influence the conformation of
the binding pocket, especially the adenine and buried regions. The compounds in these subgroups show weak or
very weak correlations/anticorrelations (Fig. 4, Table 1), indicating that long simulations may be needed to fully
sample the conformational changes. The performance of the predictions for different subgroups is in agreement
with the criteria we have p roposed42 for the quality of predictions, including how well a compound fits into the
binding pocket and how many rotamers a compound may manifest. While the inclusion of adaptation energies
does not improve the overall correlation (Fig. 3b), it removes the anticorrelations for the subgroups 4 and 34,
with correlation coefficients modified from −0.39 and −0.37 to −0.04 and 0.09, respectively.
TIES results. The TIES study was performed for a total of 103 compounds pairs, of which 29 are simulated
by OpenMM and 74 by NAMD. Our previous studies have shown that consistent results are generated from dif-
ferent MD e ngines21, 40 or on different computational platforms32, provided that the same force field is used and
Scientific Reports | (2022) 12:10433 | https://doi.org/10.1038/s41598-022-13319-6 5
Vol.:(0123456789)www.nature.com/scientificreports/
Figure 4. Free energy differences from ESMACS for the electrostatically neutral compounds, grouped into
subsets of clusters. In each subset structural modification to L30 (denoted as 0) is restricted to specific regions,
with increasing numbers of regions being included. The sets are: (1) ether variations, (2) pyridyl variation, (3)
central aryl variation, (4) lactam substituent variation. The numbers (1–4) and their combinations also refer to
the different data sets displayed in the panels.
Figure 5. Comparison of relative binding affinities from (a) TIES and experiment, (b) ESMACS and
experiment, and (c) TIES and ESMACS for the compound pairs studied in TIES. In subfigure (a), the long
dashed, short dashed and dotted lines are y = x, y = x ± 1 and y = x ± 2. An excellent correlation is obtained
between the TIES calculations and the experimental measurement, with a correlation coefficient of 0.90. Strong
correlations are also obtained between ESMACS and experiment, and between TIES and ESMACS, with
correlation coefficients of 0.67 and 0.62, respectively.
the ensemble approach is employed. Here we evaluate the performance of TIES protocols in reproducing the
experimental data for the dataset.
Comparison of predictions with experimental data. A very good correlation, with a correlation coefficient of
0.90, is obtained between the calculated free energy differences and the experimental data (Fig. 5a). In the sub-
group with compound L30 as the reference, most of the predicted binding free energy differences are negative,
indicating that the modifications to the compound are likely to improve the binding potencies (ΔΔG < 0). The
calculations correctly predict compound L2 (Fig. 1) as one of the best binders. As L2 already has a very favour-
able binding free energy (−10.49 kcal/mol), it is not surprising that most of the modifications from it deteriorate
the binding affinities (ΔΔG > 0). For all of the 103 compound pairs, 94% of the TIES predictions agree direction-
ally with the experimental observations, that is, the calculated binding free energy differences have the same sign
as those from experimental measurements.
The relative binding free energy differences from TIES agree well with those from ESMACS (Fig. 5c), with
a correlation coefficient of 0.62. The predicted ΔΔG values for the two subgroups, paired with L30 and L2, are
clearly distinct from both of the protocols. The predicted ΔΔG results from ESMACS also have a good correlation
Scientific Reports | (2022) 12:10433 | https://doi.org/10.1038/s41598-022-13319-6 6
Vol:.(1234567890)www.nature.com/scientificreports/
Figure 6. Binding free energy differences in the closed cycle. L* represents 17 compounds which have
differences at one or more positions (blue cycles) to L2, and have been paired with both L30 and L2. The errors
for L30 → L2 are derived from the bootstrapped standard error from the ensemble simulations. The errors
in all other energy terms are the standard deviations of sampling distributions from the 17 compounds. The
experimental measurements are reported as single values with no uncertainties provided.
with the experimental data, with a correlation coefficient of 0.67 (Fig. 5b). We should again point out that
because of the nature of the approximations used, such as use of an implicit solvent model and the neglect of
the conformational entropy contributions, the ESMACS approach does not provide accurate absolute (Fig. 3) or
relative (Fig. 5b) binding free energies. However, it often yields precise binding affinity rankings. As an alchemical
approach, TIES is in principle both accurate and precise in its domain of applicability. The calculated binding
free energies are therefore directly comparable with those from experimental measurements, as evidenced by
the same scales of the axes in Fig. 5a.
It should be noted, however, that an apparent overestimation is observed for some of the compound pairs
involving L30, making the predicted free energy differences larger than those from experiments. An MSE of
−1.36 kcal/mol is obtained for the L30 subgroup, compared with an MSE of 0.16 kcal/mol for the subgroup with
compound L2 as the reference. The apparent overestimations are investigated further in the following sections.
Overestimation from closed cycle mutations. There are 17 compounds which are paired with both L30 and L2
(Fig. 6). This makes it possible to check the performance of the cycle closure method. For the transformations
starting from L2 (L2 → L* in Fig. 6a), the average free energy change from TIES calculations agrees well with the
experimental data (Fig. 6b). The transformation L30 → L2, however, overestimates the difference by 1.28 kcal/
mol. The two-step transformation for all 17 compounds (L30 → L2 → L*) generates an averaged overestimation
of 1.17 kcal/mol, similar to that observed in L30 → L2 transformation. Compounds L* and L2 (Fig. 6) have the
same/similar alkyl isopropyl substituent at the hydrophobic position (Fig. 1), while L30 does not; transforma-
tions L30 → L* therefore share the same change as that in L30 → L2 transformation. There is a similar overes-
timation in L30 → L* (−0.99 kcal/mol) as that in L30 → L2, which is likely to be rooted in the same alchemical
change of growing an alkyl group from L30.
The legs L30 → L2, L2 → L* and L* → L30 generate an average difference of 0.17 kcal/mol within the
closed cycle (L30 → L2 → L* → L30, Fig. 6) between the calculations and the experiments. As we have stated
previously40, a hysteresis value of 0 is a necessary but not sufficient condition for convergence of predictions. An
overall hysteresis near 0 for a closed cycle is not necessarily an indication of convergence for each leg; it may be
a result of cancellation from individual legs. It is understandable that extending an alkyl group into a hydropho-
bic binding pocket (Fig. 2b) makes the binding more favourable, about which TIES and experiment agree with
each other directionally. It is likely that the force field and/or the sampling contribute to the differences between
calculations and experimental measurements. All simulations were initiated from the same X-ray structure in
which an isopropyl group is present in the bound ligand. The removal of the group (Fig. 1) would be expected to
induce some conformational collapse or solvation of the hydrophobic subpocket (Fig. 2). The subpocket is formed
by a few hydrophobic residues including Leu2000, Phe2004, Ile2009, Leu2070, Phe2075, His2077 and Ile2100.
The root-mean-square deviations of these residues from the X-ray structure show no overall differences for the
simulations of L2 and L30. Therefore, despite the variability in the ligand structure, no significant changes are
observed in the shape and size of the subpocket from the simulations of the two ligands. This indicates that the
current sampling regimen does not permit protein conformational adaptations for ligands without the isopropyl
group in the ESMACS and TIES simulations. This could explain the predicted less favourable binding and hence
larger differences in the binding free energies (Figs. 5a, 6) between the ligands with and without the isopropyl
group. It is unlikely though that ROS1 needs to adopt a DFG-in conformation to accommodate the compounds
containing the –CH group, as the DFG motif directly interacts with the scaffold of the compounds and retains
them in the same binding mode (Fig. 2).
Ligand pairs sharing the common change. 50 pairs have been identified which involve a common variation
between the two compounds in the pairs, changing from a –CH group to –C–CH–(CH3)2 at the hydrophobic
site. This is the same change as that between L30 to L2 (Fig. 1). Simulations for the pair get an overestimation of
1.28 kcal/mol for the binding free energy difference: −4.16 kcal/mol from TIES vs −2.88 kcal/mol from experi-
ment. For these 50 pairs, an averaged binding free energy difference of −3.82 kcal/mol is obtained from TIES
calculations, while an average of −2.42 kcal/mol from experimental data. A recent study has proposed a combi-
Scientific Reports | (2022) 12:10433 | https://doi.org/10.1038/s41598-022-13319-6 7
Vol.:(0123456789)www.nature.com/scientificreports/
Figure 7. Original and “corrected” binding free energies from TIES calculations, compared with the
experimental data. The correction is made by assuming a systematic overestimation is introduced by –CH to
–C–CH–(CH3)2 transformation which is involved in all of these pairs.
nation of machine learning (ML) and alchemical free energy calculation to improve the accuracy of free energy
predictions43. The ML method is used to learn the differences between the calculations and the experimental data
and derives a correct term which brings the two closer. Such an approach may identify and subsequently correct
the discrepancies as observed here. It should be noted that the ML approach used in the s tudy43 only learns the
differences between the calculations and experiments, with no attempt to identify the source of the discrepan-
cies. Studies have shown that a large set of typical chemical modifications lead to a nearly normal distribution
of binding energy differences44. For individual modifications, however, a wide and non-Gaussian distribution
has been observed for experimental binding free energies from a large number of independent m easurements42.
Such non-normality has also been reported in numerous ensemble simulations when large sample sizes are
used20, 22, 27. These observations indicate that the assumption of Gaussian statistics may not be j ustified20,42. If, on
average, these 50 compound pairs have the same discrepancy as that in L30 → L2 transformation, the systematic
differences might be collectively “corrected”. If we apply an offset and shift up all of the TIES results by 1.28 kcal/
mol, the calculations agree well with the experimental data, with an MSE reducing from −1.40 to −0.12 kcal/mol
(Fig. 7). As stated above, this offset could be associated with incomplete sampling of the protein conformational
movement that is required to fully accommodate the change from a –C–CH–(CH3)2 group, which is present in
the initial X-ray structures, to a –CH group in the region of the A-loop.
Conclusion
Using the TIES and ESMACS protocols, we have computed the binding free energies of a series of ligands
interacting with ROS1 kinase. Good correlations are obtained from our ESMACS study for subsets of the com-
pounds. An excellent statistical ranking is generated from the TIES study, with a correlation of 0.90 between the
predictions and the experimental measurements. Moreover, TIES and ESMACS agree with one another in the
prediction of free energy differences.
An unexplained overestimation is observed in the TIES study for one subset of compound pairs which share
a common difference between the pairs. For the transformations to which cycle closure methods can be applied
for the error estimation, a cancellation has been observed as the errors are similar for specific legs within the
cycle. This results in an overall hysteresis near 0 for a closed cycle, but significant errors remain for individual legs.
While continuing improvements in the force fields and the application of statistically robust ensemble methods
are essential to generate increased accuracy for the physics-based alchemical approaches, machine learning
methods may help to identify discrepancies between the predictions and experimental data and potentially
reduce those differences, providing sufficient quantities of reliable training data are available that incorporate
information on the way such data are distributed. Despite the existence of this systematic discrepancy, an excel-
lent correlation is obtained in the free energy differences between the calculations and the experiments, showing
once again that the TIES approach can be used in prospective drug discovery projects to predict the changes of
binding free energies in the lead optimisation process29, 32, 37.
Data availability
The structures for the ROS1 protein and the compounds, and Amber format topologies and PDB-format coor-
dinates for the compound pairs, are freely available at http://doi.org/10.23728/b2share.89da477f828048dd8332
72b51360d13a.
Received: 16 March 2022; Accepted: 23 May 2022
Scientific Reports | (2022) 12:10433 | https://doi.org/10.1038/s41598-022-13319-6 8
Vol:.(1234567890)www.nature.com/scientificreports/
References
1. Drilon, A. et al. ROS1-dependent cancers—Biology, diagnostics and therapeutics. Nat. Rev. Clin. Oncol. 18, 35–55. https://doi.
org/10.1038/s41571-020-0408-9 (2021).
2. Gu, T. L. et al. Survey of tyrosine kinase signaling reveals ROS kinase fusions in human cholangiocarcinoma. PLoS One 6, e15640.
https://doi.org/10.1371/journal.pone.0015640 (2011).
3. Wiesner, T. et al. Kinase fusions are frequent in Spitz tumours and spitzoid melanomas. Nat. Commun. 5, 3116. https://doi.org/
10.1038/ncomms4116 (2014).
4. DiMasi, J. A., Grabowski, H. G. & Hansen, R. W. Innovation in the pharmaceutical industry: New estimates of R&D costs. J. Health
Econ. 47, 20–33. https://doi.org/10.1016/j.jhealeco.2016.01.012 (2016).
5. Wouters, O. J., McKee, M. & Luyten, J. Estimated research and development investment needed to bring a new medicine to market,
2009–2018. JAMA 323, 844–853. https://doi.org/10.1001/jama.2020.1166 (2020).
6. Sabe, V. T. et al. Current trends in computer aided drug design and a highlight of drugs discovered via computational techniques:
A review. Eur. J. Med. Chem. 224, 113705. https://doi.org/10.1016/j.ejmech.2021.113705 (2021).
7. Wan, S., Bhati, A. P., Zasada, S. J. & Coveney, P. V. Rapid, accurate, precise and reproducible ligand-protein binding free energy
prediction. Interface Focus 10, 20200007. https://doi.org/10.1098/rsfs.2020.0007 (2020).
8. Wang, L. et al. Accurate and reliable prediction of relative ligand binding potency in prospective drug discovery by way of a modern
free-energy calculation protocol and force field. J. Am. Chem. Soc. 137, 2695–2703. https://doi.org/10.1021/ja512751q (2015).
9. Molecular Operating Environment (MOE), 2019.01. Chemical Computing Group ULC, 1010 Sherbooke St. West, Suite #910,
Montreal, QC, Canada, H3A 2R7 (2021).
10. Homeyer, N. & Gohlke, H. FEW: A workflow tool for free energy calculations of ligand binding. J. Comput. Chem. 34, 965–973.
https://doi.org/10.1002/jcc.23218 (2013).
11. Loeffler, H. H., Michel, J. & Woods, C. FESetup: Automating setup for alchemical free energy simulations. J. Chem. Inf. Model 55,
2485–2490. https://doi.org/10.1021/acs.jcim.5b00368 (2015).
12. Zavitsanou, S. et al. FEPrepare: A web-based tool for automating the setup of relative binding free energy calculations. J Chem.
Inf. Model. 61, 4131–4138. https://doi.org/10.1021/acs.jcim.1c00215 (2021).
13. Kim, S. et al. CHARMM-GUI free energy calculator for absolute and relative ligand solvation and binding free energy simulations.
J. Chem. Theory Comput. 16, 7207–7218. https://doi.org/10.1021/acs.jctc.0c00884 (2020).
14. Wan, S., Knapp, B., Wright, D. W., Deane, C. M. & Coveney, P. V. Rapid, precise, and reproducible prediction of peptide-MHC
binding affinities from molecular dynamics that correlate well with experiment. J. Chem. Theory Comput. 11, 3346–3356. https://
doi.org/10.1021/acs.jctc.5b00179 (2015).
15. Bhati, A. P., Wan, S., Wright, D. W. & Coveney, P. V. Rapid, accurate, precise, and reliable relative free energy prediction using
ensemble based thermodynamic integration. J. Chem. Theory Comput. 13, 210–222. https://d oi.o
rg/1 0.1 021/a cs.j ctc.6 b0097 9 (2017).
16. Kollman, P. A. et al. Calculating structures and free energies of complex molecules: Combining molecular mechanics and con-
tinuum models. Acc. Chem. Res. 33, 889–897. https://doi.org/10.1021/ar000033j (2000).
17. Vassaux, M., Wan, S., Edeling, W. & Coveney, P. V. Ensembles are required to handle aleatoric and parametric uncertainty in
molecular dynamics simulation. J. Chem. Theory Comput. 17, 5187–5197. https://doi.org/10.1021/acs.jctc.1c00526 (2021).
18. Coveney, P. V. & Wan, S. On the calculation of equilibrium thermodynamic properties from molecular dynamics. Phys. Chem.
Chem. Phys. 18, 30236–30240. https://doi.org/10.1039/c6cp02349e (2016).
19. Knapp, B., Ospina, L. & Deane, C. M. Avoiding false positive conclusions in molecular simulation: The importance of replicas. J.
Chem. Theory Comput. 14, 6127–6138. https://doi.org/10.1021/acs.jctc.8b00391 (2018).
20. Wan, S., Sinclair, R. C. & Coveney, P. V. Uncertainty quantification in classical molecular dynamics. Philos. Trans. R. Soc. A 379,
20200082. https://doi.org/10.1098/rsta.2020.0082 (2021).
21. Wade, A., Bhati, A. P., Wan, S. & Coveney, P. V. Alchemical free energy estimators and molecular dynamics engines: Accuracy
precision and reproducibility. J. Chem. Theory Comput. https://doi.org/10.1021/acs.jctc.2c00114 (2022).
22. Bhati, A. P. & Coveney, P. V. Large scale study of ligand-protein relative binding free energy calculations: Actionable predictions
from statistically robust protocols. J. Chem. Theory Comput. 18, 2687–2702. https://doi.org/10.1021/acs.jctc.1c01288 (2022).
23. Sadiq, S. K. et al. Automated molecular simulation based binding affinity calculator for ligand-bound HIV-1 proteases. J. Chem.
Inf. Model 48, 1909–1919. https://doi.org/10.1021/ci8000937 (2008).
24. Vulpetti, A. & Bosotti, R. Sequence and structural analysis of kinase ATP pocket residues. Farmaco 59, 759–765. https://doi.org/
10.1016/j.farmac.2004.05.010 (2004).
25. Fiser, A. & Sali, A. ModLoop: Automated modeling of loops in protein structures. Bioinformatics 19, 2500–2501. https://doi.org/
10.1093/bioinformatics/btg362 (2003).
26. Kelley, B. P., Brown, S. P., Warren, G. L. & Muchmore, S. W. POSIT: Flexible shape-guided docking for pose prediction. J. Chem.
Inf. Model 55, 1771–1780. https://doi.org/10.1021/acs.jcim.5b00142 (2015).
27. Bieniek, M. K., Bhati, A. P., Wan, S. & Coveney, P. V. TIES 20: Relative binding free energy with a flexible superimposition algorithm
and partial ring morphing. J. Chem. Theory Comput. 17, 1250–1265. https://doi.org/10.1021/acs.jctc.0c01179 (2021).
28. Amber 2021. University of California, San Francisco.
29. Wan, S. et al. Evaluation and characterization of Trk kinase inhibitors for the treatment of pain: Reliable binding affinity predic-
tions from theory and computation. J. Chem. Inf. Model 57, 897–909. https://doi.org/10.1021/acs.jcim.6b00780 (2017).
30. Wright, D. W. et al. Application of the ESMACS binding free energy protocol to a multi-binding site lactate dehydogenase A ligand
dataset. Adv. Theory Simul. 3, 1900194. https://doi.org/10.1002/adts.201900194 (2019).
31. Wright, D. W. et al. Application of ESMACS binding free energy protocols to diverse datasets: Bromodomain-containing protein
4. Sci. Rep. 9, 6017. https://doi.org/10.1038/s41598-019-41758-1 (2019).
32. Wan, S. et al. Rapid and reliable binding affinity prediction of bromodomain inhibitors: A computational study. J. Chem. Theory
Comput. 13, 784–795. https://doi.org/10.1021/acs.jctc.6b00794 (2017).
33. Menzer, W. M., Li, C., Sun, W., Xie, B. & Minh, D. D. L. Simple entropy terms for end-point binding free energy calculations. J.
Chem. Theory Comput. 14, 6035–6049. https://doi.org/10.1021/acs.jctc.8b00418 (2018).
34. Duan, L., Liu, X. & Zhang, J. Z. Interaction entropy: A new paradigm for highly efficient and reliable computation of protein-ligand
binding free energy. J. Am. Chem. Soc. 138, 5722–5728. https://doi.org/10.1021/jacs.6b02682 (2016).
35. Wang, J. & Hou, T. Develop and test a solvent accessible surface area-based model in conformational entropy calculations. J. Chem.
Inf. Model. 52, 1199–1212. https://doi.org/10.1021/ci300064d (2012).
36. Zhang, X., Perez-Sanchez, H. & Lightstone, F. C. A comprehensive docking and MM/GBSA rescoring study of ligand recognition
upon binding antithrombin. Curr. Top. Med. Chem. 17, 1631–1639. https://doi.org/10.2174/1568026616666161117112604 (2017).
37. Wan, S. et al. Hit-to-lead and lead optimization binding free energy calculations for G protein-coupled receptors. Interface Focus
10, 20190128. https://doi.org/10.1098/rsfs.2019.0128 (2020).
38. Phillips, J. C. et al. Scalable molecular dynamics with NAMD. J. Comput. Chem. 26, 1781–1802. https://doi.org/10.1002/jcc.20289
(2005).
39. Eastman, P. et al. OpenMM 7: Rapid development of high performance algorithms for molecular dynamics. PLoS Comput. Biol.
13, e1005659. https://doi.org/10.1371/journal.pcbi.1005659 (2017).
Scientific Reports | (2022) 12:10433 | https://doi.org/10.1038/s41598-022-13319-6 9
Vol.:(0123456789)www.nature.com/scientificreports/
40. Bhati, A. P., Wan, S., Hu, Y., Sherborne, B. & Coveney, P. V. Uncertainty quantification in alchemical free energy methods. J. Chem.
Theory Comput. 14, 2867–2880. https://doi.org/10.1021/acs.jctc.7b01143 (2018).
41. Lee, T. S., Hu, Y., Sherborne, B., Guo, Z. & York, D. M. Toward fast and accurate binding affinity prediction with pmemdGTI: An
efficient implementation of GPU-accelerated thermodynamic integration. J. Chem. Theory Comput. 13, 3077–3084. https://doi.
org/10.1021/acs.jctc.7b00102 (2017).
42. Wan, S. et al. Ensemble simulations and experimental free energy distributions: Evaluation and characterization of isoxazole amides
as SMYD3 inhibitors. J. Chem. Inf. Model. 62(10), 2561–2570. https://doi.org/10.1021/acs.jcim.2c00255 (2022).
43. Scheen, J. et al. Hybrid alchemical free energy/machine-learning methodology for the computation of hydration free energies. J.
Chem. Inf. Model. 60, 5331–5339. https://doi.org/10.1021/acs.jcim.0c00600 (2020).
44. Hajduk, P. J. & Sauer, D. R. Statistical analysis of the effects of common chemical substituents on ligand potency. J. Med. Chem.
51, 553–564. https://doi.org/10.1021/jm070838y (2008).
Acknowledgements
We are grateful for funding for the UK MRC Medical Bioinformatics project (Grant no. MR/L016311/1), the
EPSRC funded UK Consortium on Mesoscale Engineering Sciences (UKCOMES Grant no. EP/L00030X/1), the
European Commission for EU H2020 CompBioMed2 Centre of Excellence (Grant no. 823712) and EU H2020
EXDCI-2 project (Grant no. 800957). We acknowledge the Gauss Centre for Supercomputing for providing
computing time on SuperMUC-NG (https://doku.lrz.de/display/PUBLIC/SuperMUC-NG) at Leibniz Super-
computing Centre under project COVID-19-SNG1 and the very able assistance of its scientific support staff.
We also made use of the ARCHER2 UK National Supercomputing Service (http://www.archer2.ac.uk). Access
to ARCHER2 was provided through the UKCOMES grant. Some of this work was performed on the Summit
supercomputer (https://www.olcf.ornl.gov/summit/) at the Oak Ridge National Laboratory, thanks to the 2021
DOE INCITE award “COMPBIO”.
Author contributions
S.W.: Conceptualization, data curation, formal analysis, methodology, writing—original draft, review & editing.
A.P.B.: Data curation. D.W.W.: Conceptualization, data curation. A.D.W.: Data curation. G.T.: Conceptualization,
data curation, writing—review & editing. H.v.V.: Conceptualization, writing—review & editing. P.V.C.: Funding
acquisition, conceptualization, methodology, supervision, writing—original draft, review & editing.
Competing interests
The authors declare no competing interests.
Additional information
Correspondence and requests for materials should be addressed to P.V.C.
Reprints and permissions information is available at www.nature.com/reprints.
Publisher’s note Springer Nature remains neutral with regard to jurisdictional claims in published maps and
institutional affiliations.
Open Access This article is licensed under a Creative Commons Attribution 4.0 International
License, which permits use, sharing, adaptation, distribution and reproduction in any medium or
format, as long as you give appropriate credit to the original author(s) and the source, provide a link to the
Creative Commons licence, and indicate if changes were made. The images or other third party material in this
article are included in the article’s Creative Commons licence, unless indicated otherwise in a credit line to the
material. If material is not included in the article’s Creative Commons licence and your intended use is not
permitted by statutory regulation or exceeds the permitted use, you will need to obtain permission directly from
the copyright holder. To view a copy of this licence, visit http://creativecommons.org/licenses/by/4.0/.
© The Author(s) 2022
Scientific Reports | (2022) 12:10433 | https://doi.org/10.1038/s41598-022-13319-6 10
Vol:.(1234567890)You can also read