Evolution of the repression mechanisms in circadian clocks
←
→
Page content transcription
If your browser does not render page correctly, please read the page content below
Tyler et al. Genome Biology    (2022) 23:17
https://doi.org/10.1186/s13059-021-02571-0

 RESEARCH                                                                                                                                      Open Access

Evolution of the repression mechanisms
in circadian clocks
Jonathan Tyler1,2 , Yining Lu1 , Jay Dunlap3 and Daniel B. Forger1,4*

*Correspondence:
forger@umich.edu                        Abstract
1
  Department of Mathematics,            Background: Circadian (daily) timekeeping is essential to the survival of many
University of Michigan, 48109 Ann       organisms. An integral part of all circadian timekeeping systems is negative feedback
Arbor, MI, USA
4
  Department of Computational           between an activator and repressor. However, the role of this feedback varies widely
Medicine and Bioinformatics,            between lower and higher organisms.
University of Michigan, 48109 Ann
Arbor, MI, USA
                                        Results: Here, we study repression mechanisms in the cyanobacterial and eukaryotic
Full list of author information is      clocks through mathematical modeling and systems analysis. We find a common
available at the end of the article     mathematical model that describes the mechanism by which organisms generate
                                        rhythms; however, transcription’s role in this has diverged. In cyanobacteria, protein
                                        sequestration and phosphorylation generate and regulate rhythms while transcription
                                        regulation keeps proteins in proper stoichiometric balance. Based on recent
                                        experimental work, we propose a repressor phospholock mechanism that models the
                                        negative feedback through transcription in clocks of higher organisms. Interestingly,
                                        this model, when coupled with activator phosphorylation, allows for oscillations over a
                                        wide range of protein stoichiometries, thereby reconciling the negative feedback
                                        mechanism in Neurospora with that in mammals and cyanobacteria.
                                        Conclusions: Taken together, these results paint a picture of how circadian
                                        timekeeping may have evolved.
                                        Keywords: Circadian clocks, Evolution, Transcription, Protein sequestration,
                                        Phosphorylation

                                      Background
                                      Circadian clocks time most behavioral and physiological events in a 24-h day to optimize
                                      fitness in many organisms [1]. Molecular mechanisms are responsible for driving these
                                      rhythms at the cellular level [2]. A common theme for the generation of oscillations at
                                      the molecular level is the presence of negative feedback [3]. However, the mechanisms by
                                      which various organisms implement negative feedback differ. For example, in cyanobac-
                                      teria, three proteins, KaiA, KaiB, and KaiC, interact to generate near 24-h rhythms in the
                                      phosphorylation status of KaiC, giving rise to a purely post-translational clock. On the
                                      other hand, eukaryotic organisms produce the required negative feedback through tran-
                                      scriptional activation of a repressor that, after a sufficient amount of repressor is present,
                                      inhibits the activator from further promoting transcription.

                                      © The Author(s). 2022 Open Access This article is licensed under a Creative Commons Attribution 4.0 International License,
                                      which permits use, sharing, adaptation, distribution and reproduction in any medium or format, as long as you give appropriate
                                      credit to the original author(s) and the source, provide a link to the Creative Commons licence, and indicate if changes were
                                      made. The images or other third party material in this article are included in the article’s Creative Commons licence, unless
                                      indicated otherwise in a credit line to the material. If material is not included in the article’s Creative Commons licence and your
                                      intended use is not permitted by statutory regulation or exceeds the permitted use, you will need to obtain permission directly
                                      from the copyright holder. To view a copy of this licence, visit http://creativecommons.org/licenses/by/4.0/. The Creative
                                      Commons Public Domain Dedication waiver (http://creativecommons.org/publicdomain/zero/1.0/) applies to the data made
                                      available in this article, unless otherwise stated in a credit line to the data.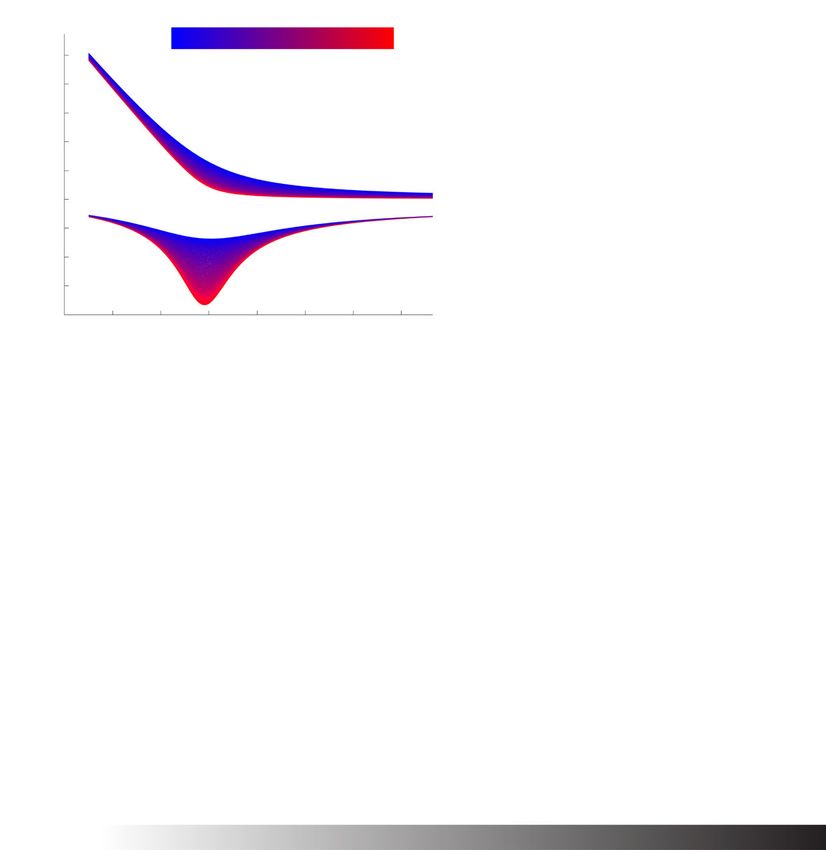
Tyler et al. Genome Biology   (2022) 23:17                                                                     Page 2 of 18

                    Despite our increased understanding of the core negative feedback architecture across
                  many organisms, the evolutionary paradigm of circadian clocks remains unclear. Here,
                  we develop novel mathematical models of the clocks in cyanobacteria, Neurospora, and
                  mammals that reveal convergent principles by which diverse organisms generate oscilla-
                  tions. Our cyanobacterial clock models reflect protein sequestration between KaiA and
                  KaiC [4, 5] while transcription regulates proper stoichiometric balance. Additionally, we
                  present a mathematical model of the eukaryotic clock incorporating a novel “phospho-
                  lock” mechanism that couples phosphorylation with protein sequestration. We find that
                  the addition of phosphorylation increases the robustness of oscillations at biologically
                  reasonable protein affinities. Furthermore, we show that, when adding activator phospho-
                  rylation, our model allows for oscillations at lower stoichiometric ratios of repressor to
                  activator, reconciling experimental results from Neurospora with sequestration models.
                    Altogether, our analysis reveals that the circadian clock mechanisms among prokary-
                  otes and eukaryotes may have evolved towards similar ends. That is, as the clock’s core
                  feedback moved from post-translational regulation in cyanobacteria to a transcription-
                  translation feedback loop in Neurospora and higher organisms, the regulation of
                  stoichiometry, which is essential for robust oscillations, moved from a transcription-
                  translation feedback loop to a post-translational mechanism.

                  Results
                  A detailed model of the cyanobacterial clock
                  Cyanobacteria are among the simplest organisms to exhibit circadian oscillations in cel-
                  lular components. Proper functioning of the cyanobacterial circadian clock relies on
                  interactions among three proteins: KaiA, KaiB, and KaiC [6]. Central to the protein
                  interactions are two indispensable phosphorylation sites on KaiC-Ser-431 (S431) and
                  KaiC-Thr-432 (T432). Recently, crystal structural analysis of the protein complexes in
                  the KaiABC system revealed a detailed sequestration mechanism of KaiA by KaiBC pro-
                  tein complexes (Fig. 1A) and confirmed in silico [7, 8]. First, KaiA acts as an enzyme
                  to enhance the phosphorylation of KaiC on the T432 site and, subsequently, the S431
                  site. Then, once site S431 is phosphorylated, KaiC undergoes a conformational change
                  from a pre-hydrolysis state to a post-hydrolysis state creating a hub [9]. Simultaneously,
                  KaiB undergoes a fold-change transition into an active state that is captured by the
                  post-hydrolysis KaiC on the N-terminal (CI) domain. The KaiBC complex recruits KaiA
                  proteins and prevents KaiC activation on the C-terminal (CII) domain. In other words,
                  KaiBC complexes sequester free KaiA proteins.
                    Here, we model the sequestration mechanism of KaiA by the KaiBC complex with a
                  system of ordinary differential equations (ODEs) assuming mass-action kinetics (see Eqs.
                  –(8) in Additional file 1: Supplementary Information). Our model considers KaiC pro-
                  teins in four states: unphosphorylated KaiC (denoted by U), S431 phosphorylated KaiC
                  (denoted by S), T432 phosphorylated KaiC (denoted by T), and S431 and T432 phospho-
                  rylated KaiC (denoted by ST). A similar notation is used in the phosphorylation status
                  of KaiBC. Our model assumes that KaiB binding only happens when the S431 site is
                  phosphorylated [10, 11].
                    Simulations of this detailed model suggest that the components oscillate over a wide
                  range of reaction rates. Analyzing the temporal profiles of the KaiABC oscillator, we see
                  that the fraction of phosphorylated KaiC oscillates with a roughly 24-h period (Fig. S1,
Tyler et al. Genome Biology (2022) 23:17 Page 3 of 18
Fig. 1 Reaction diagrams for the cyanobacterial clock models. Reaction diagrams for the detailed model (A),
core model (B), TTFL model (C), and the PTR model (D). A Squares are proteins in various states; small circles
indicate the phosphatase groups on the corresponding sites (red corresponds to the T432 site and yellow to
the S431 site). Arrows indicate reactions among proteins, the width of which shows the relative strength. B
The schematic of the core mechanism where KaiA enhances only the phosphorylation from U to T. C
Extension of the core mechanism: the TTFL as an inhibition scheme where KaiC-S acts like an inhibitor of the
kaiBC gene. D Schematic of the post-translational regulation (PTR) model with a constitutive source of
transcription
Additional file 1: Supplementary Information). Also, an asymmetry between the KaiC
phosphorylation and dephosphorylation phases are consistent with previous experimen-
tal results [10, 12]. Analysis of the phases of these profiles suggests that the dynamics are
indeed what we expect: first, free KaiA activates unphosphorylated KaiC (U); next, acti-
vated KaiC phosphorylates on the T432 site (T), which then slowly phosphorylates on the
S431 site (ST). The total phosphorylation level of KaiC increases accordingly during the
activation phase. Meanwhile, KaiB begins to bind with the S431 and T432 phosphorylated
KaiC. The resulting KaiBC complexes in turn sequester KaiA through tight binding. Once
sequestration depletes KaiA sufficiently, phosphorylation stops and dephosphorylation
dominates, leading the system back to a highly unphosphorylated state.
Our detailed model reproduces important qualitative and quantitative results, which
we illustrate by plotting circadian data from [12] alongside our model simulations (Fig. 2).
In particular, we observe an asymmetric circadian rhythm where KaiC proteins spend less
time in phosphorylation than dephosphorylation (Fig. 2A, B). Also, our model shows a
robust period of around 24 h with less than 5% fluctuations for several ATP/ADP ratios
(Fig. 2C–F). The CI domain of KaiC binds with KaiB, and thus sequesters KaiA, at night
as shown experimentally in [12] (Fig. 2G–H). Taken together, our model recapitulates
experimental results revealing the importance of the KaiC CI domain for the proper
functioning of the cyanobacterial circadian clock.
Finally, we perform a bifurcation analysis (Fig. S2, Additional file 1: Supplementary
Information) and stochastic simulations (Fig. S3, Additional file 1: Supplementary Infor-
mation) of our detailed model. This bifurcation analysis reveals a result similar to that inTyler et al. Genome Biology (2022) 23:17 Page 4 of 18
Fig. 2 Simulations of the detailed model recapitulate experimental results. A, B Comparison with
experimental data from Rust et al. [10]. In both results, τ1 = 9.5 h is the phosphorylation phase duration and
τ2 = 18.5 h is the dephosphorylation phase duration. C–F Comparison with circadian data from Phong et al.
[12], our model shows a robust period around 24 h under many ATP/ADP ratios. G, H Comparison with
Phong et al. [12], where we confirmed the importance of the CI domain in sustaining oscillations. We
simulate the model with weak KaiB-KaiC binding representing the KaiC muted in the CI domain (CI cat-) and
the oscillation is abolishedTyler et al. Genome Biology (2022) 23:17 Page 5 of 18
[13] where the relative ratio of KaiA and KaiB to KaiC plays an important role in the circa-
dian clock (Fig. S2, Additional file 1: Supplementary Information). Stochastic simulations
reveal that, as the total number of KaiC molecules in the system increases, the stability of
the oscillations increases. When the total number of KaiC molecules is low (CT ≤ 50),
the trajectories exhibit randomness without sustained oscillations (Fig. S3A, Additional
file 1: Supplementary Information). As CT increases, the stochastic simulations approach
that of the deterministic system (Fig. S3, Additional file 1: Supplementary Information).
A simple model of the cyanobacterial clock reveals tight binding is necessary for
oscillations, similar to the mammalian system
Here, we propose a simple model of the cyanobacterial clock where only the KaiA and
KaiC proteins are explicitly included (see Fig. 1B for the schematic). Our model is based
on the detailed cyanobacterial model from above which accounts for a wide range of
experimental observations. In our simplified model, given below in System (C), the KaiA-
enhanced phosphorylation of the T site is much faster than autophosphorylation of the S
site. The tight binding between KaiA and the unphosphorylated KaiC ensures that phos-
phorylation proceeds rapidly even in the presence of low amounts of free KaiA (the first
equation in System (C)). As the phosphorylation continues, the number of KaiC pro-
teins phosphorylated on the S site increases (the second equation in System (C)). In turn,
sequestration of KaiA increases through tight-binding (the last equation in System (C)).
d[ T]
= k1 f ([ S] , AT , Kd )(CT −[ T] −[ ST] −[ S] ) − k2 [ T]
dt
d[ ST]
= k2 [ T] −k3 [ ST]
dt (C)
d[ S]
= k3 [ ST] −k4 [ S]
dt
f ([ S] , AT , Kd ) = AT −[ S] −Kd + (AT −[ S] −Kd )2 + 4Kd AT /2
The variable CT is the total amount of the KaiC protein in the system. In the last
equation, the free amount of KaiA, denoted by [ A], is represented as a function of S431
phosphorylated KaiC that is derived under equilibrium assumptions similar to those
in [14] (see Supplementary Information, Section 3 for a detailed derivation). As in the
detailed model, the variable [ T] gives the amount of KaiC protein phosphorylated on
the T site. Similarly, the variables [ S] and [ ST] reflect the amount of KaiC protein
phosphorylated on the S site and both the S and T sites, respectively.
Our simulations demonstrate that KaiA sequestration through tight binding with S431
phosphorylated KaiC is indispensable for generating oscillations for various values of the
binding affinity of KaiA and S431 phosphorylated KaiC (Kd ). In particular, as the Kd value
decreases (i.e., the binding affinity increases), the cusp of the KaiA concentration sharp-
ens, and the magnitude of the sensitivity of the KaiA concentration to the amount of S
increases (Fig. 3A, B). Increasing sensitivity, or order of reaction [15], of the activator
KaiA with respect to S431 phosphorylated KaiC corresponds to an increasing likelihood
of oscillations [15, 16]. Moreover, for increasing values of Kd , the fraction of parameter
sets that generate oscillations decreases (Fig. 3C). This result shows that the system is
more likely to generate stable oscillations when there is stronger KaiA sequestration (i.e.,
smaller Kd ). A similar dependence on smaller Kd values is present in the interaction of
the activator and the repressor in the mammalian system [14].Tyler et al. Genome Biology (2022) 23:17 Page 6 of 18
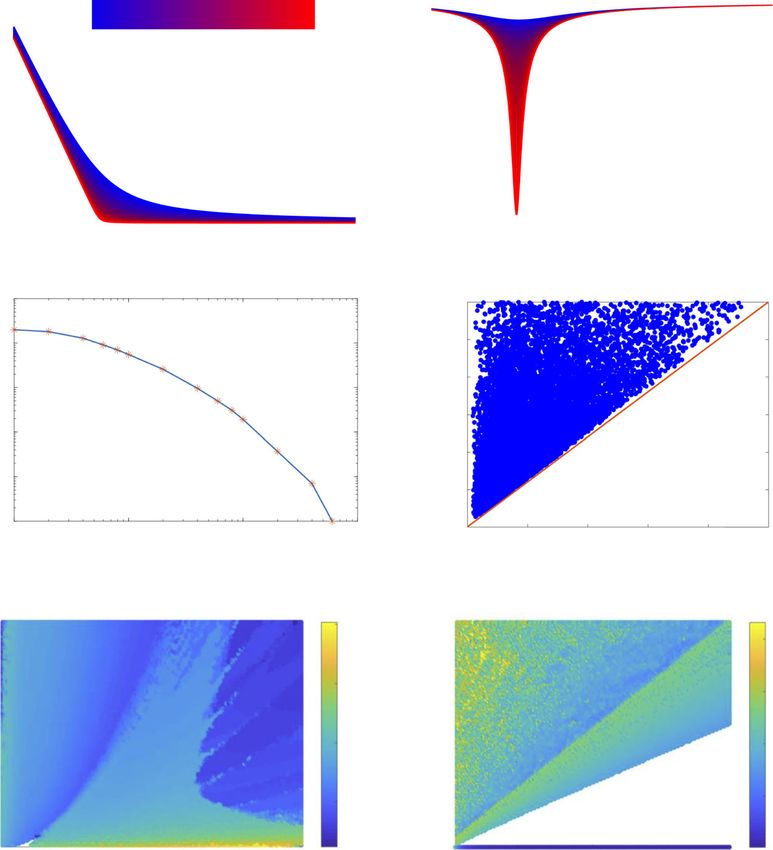
Fig. 3 Simulations of core cyanobacterial models reveal keys to robust circadian oscillations. A Profile of the
KaiA amount ([A]) with respect to the KaiC-S amount ([S]). As the curves move from blue to red, the binding
affinity increases (i.e., Kd decreases from 10−2 to 10−4 . Here, AT = 8. B The sensitivity of the KaiA amount (A)
with respect to the KaiC-S amount ([S]). Again, blue curves indicate weaker binding affinity while red curves
reflect tighter binding. C The core model generates oscillations for a lower fraction of parameter sets as Kd
increases from 10−4 to 10−1 . The parameter sets are plotted as sample points (indicated by “*”) with a fitted
curve on a log plot. D Any parameter set that generates oscillations is located above the line CT = 1/3AT ,
verifying the balanced molar ratio condition. E, F Simulation of the TTFL model and the PTR oscillator model.
Each oscillation is plotted as a point with a scaled color representing the period length. See Table S1
(Additional file 1: Supplementary Information) for a detailed description of the parameters
A necessary stoichiometric ratio for oscillations in the simple cyanobacterial model
Additional theoretical analysis (see Supplementary Information, Section 3) and sim-
ulations confirm that a necessary condition for oscillations to occur in our model
is
CT > (1 + r)AT + ,
where r is a constant related to the rates of phosphorylation and dephosphorylation, and
is a small positive constant. Consistent with existing experimental and modeling results
[13, 17, 18], our simulations suggest that a balanced molar ratio between KaiA and KaiC
abundance is crucial for generating sustainable oscillations. The observation that KaiB
abundance does not affect the circadian rhythm in the same way is also consistent withTyler et al. Genome Biology (2022) 23:17 Page 7 of 18
the model design. In our simulations, we choose parameter values such that r = 2 and
3AT . (1)
Simulation results verify that parameters violating Condition (1) rarely generate oscilla-
tions (Fig. 3D). A similar mechanism has been proposed for the mammalian circadian
clock where repressors and activators are in a balanced molar ratio [14].
Simple cyanobacterial model is functionally equivalent to the previous Kim-Forger model
System (C) reflects the interplay between phosphorylation and sequestration in the
KaiABC oscillator in cyanobacteria. Correctly timed and ordered phosphorylation is nec-
essary for robust circadian rhythm generation. Surprisingly, even though the mechanisms
that generate rhythms are different among cyanobacteria and higher-order eukaryotes,
the form of the repression function is similar. In particular, recall the simple Kim-Forger
model of the mammalian circadian clock from [14, 19]:
dM
= α1 f (P, A, Kd ) − β1 M
dt
dPc
= α2 M − β2 Pc
dt (M)
dP
= α3 Pc − β3 P
dt
f (P, A, Kd ) = A − P − Kd + (A − P − Kd )2 + 4AKd /(2A)
Here, M models the mRNA of the repressor protein, PC is the cytosolic repressor protein,
and P is the nuclear repressor protein. The parameter Kd is the binding affinity of the
activator A and the nuclear repressor, P. The function f (P, A, Kd ) models the amount of
free activator as a function of total activator, estimated by A, and repressor (P) present
[14]. Note that the repression functions in Systems (C) and (M) are equivalent, indicating
that the action of repression is conserved across the organisms even though the specific
mechanisms of repression are different.
Additional transcription-translation feedback loop adds robustness to oscillations in
cyanobacteria
We also find that an additional transcription-translation feedback loop (TTFL) plays a
significant role in sustaining robust oscillations. Besides the KaiABC system, the histidine
kinases SasA and CikA regulate the output signaling from the post-translational oscillator
to the transcriptional activity in the in vivo oscillator. The integrated roles of SasA, CikA,
and RpaA together with KaiABC in the cyanobacterial circadian clock were summarized
recently [20]. When KaiC phosphorylation reaches its peak, SasA binds to the CI domain
of the ST-phosphorylated KaiC [9, 21], autophosphorylates, and transfers the phosphate
group to RpaA, turning on the transcription factor [22]. During the dephosphorylation
phase, when KaiB binds to the CI domain to form the KaiBC complex, SasA is released
from KaiC. CikA is then recruited by the KaiBC complex, dephosphorylates RpaA, and
thus, inhibits the transcription. In other words, the transcription of the kaiBC gene is
activated when most of the KaiC proteins are highly phosphorylated and is inhibited when
KaiC proteins are mostly in the S state. Therefore, we model the TTFL as an inhibitionTyler et al. Genome Biology (2022) 23:17 Page 8 of 18
scheme where S431 phosphorylated KaiC acts like an inhibitor of the kaiBC gene (Fig. 1C,
System (TTFL) below).
d[ M] 100
= Vtrsp 4 − Vm [ M]
dt
1 + [S]
K0
d[ U]
= Ks [ M] −k1 [ A] [ U] +k4 [ S] −Vd [ U]
dt
d[ T]
= k1 [ A] [ U] −k2 [ T] −Vd [ T] (TTFL)
dt
d[ ST]
= k2 [ T] −k3 [ ST] −Vd [ ST]
dt
d[ S]
= k3 [ ST] −k4 [ S] −Vd [ S]
dt
[ A] = AT −[ S] −Kd + (AT −[ S] −Kd )2 + 4Kd AT /2
The variable M is the amount of mRNA transcribed from the kaiBC gene.
We investigate the role of the transcription-translation feedback loop (System (TTFL))
as an additional negative feedback loop in the KaiC system by comparing with a modified
system with a constitutive source of transcription (Fig. 1D, System (PTR) below). See
Table S1 (Additional file 1: Supplementary Information) for a detailed description of the
parameters and the ranges of parameters used.
d[ M]
= Vtrsp − Vm [ M]
dt
d[ U]
= Ks [ M] −k1 [ A] [ U] +k4 [ S] −Vd [ U]
dt
d[ T]
= k1 [ A] [ U] −k2 [ T] −Vd [ T]
dt (PTR)
d[ ST]
= k2 [ T] −k3 [ ST] −Vd [ ST]
dt
d[ S]
= k3 [ ST] −k4 [ S] −Vd [ S]
dt
[ A] = AT −[ S] −Kd + (AT −[ S] −Kd )2 + 4Kd AT /2
We simulate both Systems (TTFL) and (PTR) with 22,500 randomly generated parame-
ter sets varying the transcription rate, Ks , and the total KaiA concentration, AT . The TTFL
model generates circadian oscillations under a wide range of parameters (98.84%, Fig. 3E),
while the PTR model, without the additional feedback loop, only exhibits oscillations
when satisfying Condition (1) (60.33%, Fig. 3F). Altogether, our analysis and simulations
suggest that the TTFL, as an additional negative feedback loop in the cyanobacte-
rial clock, can help sustain the required molar ratio balance through a homeostatic
mechanism.
A novel “Phospholock” model of the eukaryotic clock
In light of recent results that reveal a complex interplay between binding of the activa-
tor and repressor as well as the timing and ordering of phosphorylation of the repressors
[23–25], we introduce an extension of System (M) for higher-order eukaryotes that incor-
porates additional phosphorylation of the repressor after binding to the activator. In
particular, the repressor complex, after binding with the activator, is phosphorylated,Tyler et al. Genome Biology (2022) 23:17 Page 9 of 18
subsequently leading to differential binding affinities between the activator and repres-
sor complexes at various phosphorylation states and dissociation of the two complexes
occurring after sufficient phosphorylation. We call this mechanism the “phospholock” as
the additional phosphorylation of the repressor in turn keeps the activator and repres-
sor complex sequestered together more so than pure protein sequestration. Notably, after
phosphorylation is incorporated, the mathematical model of the repression mechanism
is equivalent to those Systems (C) and (M) up to additional coefficients as shown by the
model below (System (E)).
In this phospholock model, the activator complex, A, promotes the transcription of the
repressor gene. The repressor mRNA, M, is then translated to the repressor protein r,
which forms a final complex R with other proteins, e.g., CK1. Next, the repressor complex
binds to A, leading to the subsequent phosphorylation of the repressor complex. After
sufficient phosphorylation, the activator and repressor complexes dissociate, leaving the
activator free to promote transcription of the repressor gene again. In this way, we incor-
porate phosphorylation, which has been shown to be essential to oscillations, with the
previously established protein sequestration repression mechanism.
We describe the phospholock mechanism with a simple model below (see Supple-
mentary Information, Section 4, for the derivation of the repression function, f (R)).
dM
= α1 f (R) − β1 M
dt
dr
= α2 M − β2 r
dt
dR (E)
= α3 R − β3 R
dt
K̃1 · AT − K̃1 · R − K̃2 + (K̃1 · AT + K̃1 · R + K̃2 )2 − 4K̃12 AT R
f (R) = .
2K̃1
In Fig. 4B, we plot the repression function f (R) for a specific parameter set where Kd =
k
1 while varying the ratio of phosphorylation to dephosphorylation (i.e., k2 = k2f2r ). As
k2 increases, the cusp of the repression function sharpens (Fig. 4B, top). Moreover, the
magnitude of the peak sensitivity increases as k2 increases (Fig. 4B, bottom).
Next, we investigate how the interplay between the Kd value and the ratio of the strength
of phosphorylation to dephosphorylation (k2 ) affects the robustness of oscillations. As Kd
values decrease, the likelihood that the system generates oscillations increases in general
(Fig. 4C). Moreover, at small Kd values, the system is more likely to generate oscilla-
tions when dephosphorylation is stronger than phosphorylation, i.e., k2 < 1. However,
as Kd increases, e.g., Kd ≥ 0.1, the system is more likely to generate oscillations when
phosphorylation is stronger than dephosphorylation, i.e., k2 > 1 (Fig. 4C).
Additional activator phosphorylation in the phospholock model allows for wider
stoichiometric ratios
While System (E) represents the mechanisms of the circadian clock in Drosophila and
mammals, we now investigate the mechanism in Neurospora. The repression mecha-
nism in the Neurospora circadian clock historically has been regarded as a Hill-type
repression mechanism over a pure protein sequestration mechanism [19]. In this Hill-
type repression, the repressor inactivates the activator by catalyzing several successive
phosphorylations [26]. Moreover, the higher number of phosphorylations results in aTyler et al. Genome Biology (2022) 23:17 Page 10 of 18
Fig. 4 Novel “phospholock” model of the eukaryotic circadian clock. A Schematic of the “phospholock”
model of the eukaryotic circadian clock. The activator complex, A, promotes transcription of the repressor
gene, which is then translated to the repressor protein r. Next, the repressor protein(s) form complexes with
other proteins, specifically kinases. Then, the repressor complex binds to the activator complex. Over time,
the repressor proteins become gradually more phosphorylated until it dissociates, leaving the activator
complex free, and thus completing the cycle. B The repression function f (R) (top) from System (E) and the
sensitivity (bottom) for a specific parameter set (see the “Methods” section) with Kd = 1. The ratio of
phosphorylation to dephosphorylation is increased from 1 (blue) to 10000 (red). As the ratio increases, the
cusp of the repression function sharpens, reflected in the increase in the magnitude of the peak sensitivity
(bottom). C The percent of parameter sets that exhibit oscillations increases with increasing phosphorylation
strength and varying Kd values (0.0001, 0.001, 0.01, 0.1, and 1). When the Kd values are small (≤ 0.01), the
system is more likely to generate oscillations when dephosphorylation is stronger than phosphorylation.
However, at more likely Kd levels, i.e., Kd ≥ 0.1, the system is more likely to generate oscillations when
phosphorylation is stronger than dephosphorylation. D Schematic of the phospholock mechanism with the
additional phosphorylation of the activator (as in the Neurospora system). E The distribution of stoichiometric
ratios (R:A) calculated from parameter sets that generate oscillations for increasing k3 values. Adding
phosphorylation of the activator increases the range of stoichiometric ratios from parameter sets that exhibit
oscillations as the k3 parameter increasesTyler et al. Genome Biology (2022) 23:17 Page 11 of 18
higher chance of oscillations occurring [19]. Even though the assumptions used to derive
the Hill function are very restrictive [16], mathematical models of the Neurospora clock
[27–29] continue to use a Hill-type repression term to model the mechanism by which
FRQ represses WCC over protein sequestration for two key reasons: 1) phosphorylation
of the activator is a crucial element in the generation of oscillations [30–32], and 2) the
stoichiometric ratio of repressor to activator in Neurospora is not consistent with required
stoichiometric ratios in protein sequestration models [33].
However, when we add phosphorylation of the activator to the phospholock model
(Fig. 4D), we find that oscillations are possible at a wide range of stoichiometric ratios.
System (E), now with added phosphorylation of the activator, becomes
dM
= α1 f (R) − β1 M
dt
dr
= α 2 M − β2 r
dt
dR (N)
= α3 R − β3 R
dt
K̃1 AT − K̃3 R − K̃2 (1 + k4 ) + (K̃1 AT + K̃3 R + K̃2 (1 + k4 ))2 − 4K̃1 K̃3 AT R
f (R) = .
2K̃1 (1 + k4 )
Note that, even with the additional phosphorylation of the activator, the repression func-
tions in Systems (C), (E), and (N) are equivalent up to changes in parameter coefficients.
See Supplementary Information, Section 5, for the derivation of the repression function.
Next, we simulate thousands of parameter sets that generate oscillations for increas-
ing k3 values and then compute the stoichiometric ratio given by each parameter set.
As k3 increases above zero, the range of stoichiometric ratios that sustain oscillations
increases (Fig. 4E). In fact, the stoichiometric ratio can attain values very close to zero
(Fig. 4E), values well within the range of measured levels of nuclear FRQ and WCC in
Neurospora [34]. Thus, adding in the phosphorylation of the activator can significantly
decrease the number of repressors required for the system to exhibit oscillations. In this
case, phosphorylation acts to inactivate WCC without requiring the presence of FRQ.
Moreover, increasing k3 actually decreases the robustness of the oscillations in this case
(see Supplementary Information, Section 6).
Discussion
Here, we present mathematical models of the cyanobacterial, mammalian, and Neu-
rospora circadian clocks that reflect the crucial interplay between phosphorylation
and sequestration of activators and repressors. Our models ultimately reveal a com-
mon repression function that generates oscillations at the molecular level independently
in the three systems. This consistent repression function is particularly surpris-
ing considering the divergent mechanisms by which oscillations are generated, e.g.,
purely post-translational (cyanobacteria) versus a transcription-translation feedback loop
(eukaryotes).
Moreover, our results reveal stoichiometric balancing requirements for oscillations and
how these requirements may be satisfied in the three systems. For example, an additional
transcription-translation feedback loop (TTFL) in cyanobacteria plays a significant role
in sustaining robust oscillations by maintaining the required molar ratio (Condition (1)).
This additional feedback loop matches the proposed role of the Rev-erbα TTFL in theTyler et al. Genome Biology (2022) 23:17 Page 12 of 18
mammalian clock [14, 19] that acts synergistically with the core feedback loop to maintain
the molar ratio between activators and repressors. For example, when the molar ratio is
perturbed to greater than 1 (i.e., more repressor), the additional feedback loop promotes
activator production, restoring the 1:1 molar ratio required for robust oscillations [19].
Similarly, when the molar ratio is perturbed in the cyanobacterial system to greater than
its required range (i.e., more free KaiC), then RpaA is dephosphorylated leading to low
transcription of the kaiBC genes and a decrease in free KaiC, restoring the molar ratio
required for robust oscillations.
To compare oscillations across species, we do not specifically account for the structure
of some clock complexes. Accounting for this in molar ratios (e.g., the KaiC hexamer)
shows that the requirements we see are consistent with other previous work (e.g., [18]).
That being said, the mechanisms we discuss are far from a complete picture of circadian
timekeeping. In fact, factors like co-operative binding or ultrasensitivity also play key roles
[35, 36].
In Neurospora, it has been shown experimentally that phosphorylation of the activa-
tor is crucial to the generation of rhythms, and stoichiometric ratios of the repressor to
activator do not agree with the ranges required from the protein sequestration paradigm.
However, when additional phosphorylation of the activator is added to the phospholock
model, the reconciliation among the possible models emerges. Additional phosphoryla-
tion of the activator allows for another method by which the repressor may inactivate
the activator, namely successive phosphorylations. Once the activator is phosphorylated,
it must be dephosphorylated to promote transcription again. Thus, fewer repressors are
required to attain the required amount of inactivation of the activator than when there is
no phosphorylation of the activator. That is, with no phosphorylation, once the repressor
is degraded, free activators may promote transcription, so another repressor is required to
sequester the activator. However, if the activator is phosphorylated, then another repres-
sor does not need to bind to the activator. Thus, fewer repressors are required leading to
a wider range in the stoichiometric ratios that generate oscillations.
Recent work using mice showed biochemically that PER promotes the nuclear entry
of CRY and the phosphorylation of CLOCK [37]. This additional phosphorylation
of CLOCK prevents it from binding to DNA, resulting in what the authors call
“displacement-type repression” [37]. This is mechanistically identical to previous work
showing that FRQ-mediated phosphorylation of specific sites on WC-1 and WC-2 is
required for repression of WCC [32]. The two mechanisms may be identical, i.e., phos-
phorylation of the activator complex effected by the repressor complex brings about
repression of the activator by preventing it from binding to DNA.
In previous protein sequestration models, the robustness of oscillations relied heavily
on a tight binding affinity between the activator and repressor. In this way, the repressor
sufficiently sequesters the activator, rendering it unable to promote transcription. How-
ever, these previous models required unrealistic binding affinities. In the phospholock
model, the inactivation of the activator by the repressor is balanced between binding of
the two components and phosphorylation/dephosphorylation of the repressor. That is,
at low binding affinities of the activator and repressor, the phospholock model reveals
that stronger phosphorylation adds robustness to the oscillations by keeping the activa-
tor inactivated. In contrast, at high binding affinities, stronger dephosphorylation adds
robustness by freeing some activators to promote transcription.Tyler et al. Genome Biology (2022) 23:17 Page 13 of 18
The phospholock model also revealed that rapid degradation of the repressor is not
required for sustained oscillations, confirming previous experimental results [23, 24, 38].
That is, simulations revealed that decreasing the k3 value, a surrogate marker of the degra-
dation strength of the phosphorylated repressor, increases the sensitivity of the repression
function, thereby increasing the robustness of oscillations. Therefore, our results are con-
sistent with the important feature, now shown experimentally in both Neurospora [38]
and mice [23], that rapid degradation of the phosphorylated repressors is not required for
rhythm generation.
Altogether, our novel models of the cyanobacteria and eukaryotic circadian clocks cor-
roborate the emerging theory that molecular clock mechanisms in divergent organisms
may have evolved convergently [39]. In particular, a simple mechanism of the cyanobac-
teria clock is as follows: KaiA is required for the phosphorylation of KaiC on the T site.
When the subsequent S site of KaiC is phosphorylated, KaiC binds to KaiB and gets “acti-
vated”. The “activated” KaiC can then bind and inactivate KaiA with the help of KaiB.
We assume that KaiC, when bound to KaiB, is very efficient in inhibiting KaiA, such that
effectively all KaiA is sequestered even in the presence of a small amount of KaiC with the
S site phosphorylated. After the phosphorylation is completed and KaiC gets dephospho-
rylated at the S site, there is eventually not enough KaiC to sequester all KaiA, and KaiA
is released. The free KaiA then efficiently phosphorylates the unphosphorylated KaiC,
starting the cycle again. The eukaryotic systems work via a similar mechanism. An acti-
vator complex, A, activates the transcription of repressor proteins, which is functionally
identical to KaiA activating KaiC on the T site. Next, the eukaryotic repressor proteins
sequester and inactivate the activating complex. Similarly, the phosphorylation of KaiC
on the S site allows KaiC to sequester and inactivate KaiA. Finally, the repressor proteins
in eukaryotes undergo several phosphorylations and then dissociate, freeing the activat-
ing complex, completing the cycle. Similarly, as KaiC is dephosphorylated below a certain
threshold, it releases KaiA, which then facilitates KaiC phosphorylation on the T site,
completing the cycle. Despite differences among the three clocks, it is surprising that the
systems’ core mechanisms share a similar architecture for generating robust oscillations.
Follow-up work could consider simulated evolution in silico experiments that may
reveal efficient and robust mechanisms for generating oscillations across independent
species. Such mechanisms could help further delineate how clocks may have evolved.
Additionally, the plant molecular circadian clock is much more complex than that found
in other organisms, at least in its TTFL structure. Further work should explore how
sequestration and the mechanisms to balance molar ratios we discuss may play a role in
the plant circadian clock. Further experiments could measure or change the molar ratios
of activators and repressors to determine how the phospholock mechanism we propose
extends the range where sustained oscillations are found.
Conclusion
Our mathematical models reveal circadian clocks in cyanobacteria and some eukary-
otes employ both protein sequestration and phosphorylation to generate oscillations.
An additional transcription-translation feedback loop in cyanobacteria adds robustness
to the oscillations over constitutive transcription of the kaibc genes. Interestingly, the
Vrille or Rev-erb transcription-translation feedback loops in Drosophila and mammals,
respectively, may have rediscovered this cyanobacterial mechanism to add robustnessTyler et al. Genome Biology (2022) 23:17 Page 14 of 18
oscillations. In fungi and mammals, phosphorylation acts as a lock to keep repressor and
activator complexes coupled and thus adds robustness to the oscillations, especially at
higher Kd values (lower protein affinity). Furthermore, the phospholock in Neurospora
includes phosphorylation of the activator, which drives wider stoichiometric ratios of
repressor to activator. Thus, our model reveals how Neurospora fits into the previous pro-
tein sequestration model for mammalian circadian clocks. Taken together, these results
paint a picture of how circadian timekeeping may have evolved [40–42].
Methods
Computing the fraction of parameter sets for which System (C) generates oscillations
For 14 Kd values increasing from 10−4 to 10−1 , we randomly generate 105 parameter sets
based on the parameter values in Table S1 (Additional file 1: Supplementary Informa-
tion). In particular, we fix the k2 , k3 , k4 , Vtrsp , Vd , and Vm parameters and select all other
parameters from a random uniform distribution based on the ranges in Table S1 (Addi-
tional file 1: Supplementary Information). Then, we use the fast Fourier transform (fft)
function in MATLAB to assess whether the parameter sets are sufficient for System (C)
to exhibit oscillations.
Next, we simulate the TTFL and PTR models each 22,500 times after randomly gener-
ating parameter sets when varying Ks and AT concentrations based on the ranges found
in Table S1 (Additional file 1: Supplementary Information). We calculate the period by
first applying the FFT on the time course and then identifying the strongest frequency in
the spectrum.
Plotting sensitivity of repression functions
We plot the repression function f ([ S] , AT , Kd ) with respect to [ S] from System (C) for
decreasing values of Kd (10−2 to 10−4 ) using the parameter values in Table S1 (Addi-
tional file 1: Supplementary Information) (Fig. 3A). Additionally, in Fig.3B, we plot the
d log f ([S],AT ,Kd )
sensitivity of f ([ S] , AT , Kd ) (equal to d log[A] [15, 16]) computed in MATLAB
R2020b.
Similarly, we plot the repression function f (R) from System (E) using the parameter val-
k
ues found in Table 1 for k2 = k2f2r values ranging from 1 to 104 (Fig. 4B, top) for repressor
d log f (R)
amounts from 75 to 150. We also plot the sensitivity of f (R) (equal to d log R [15, 16]) for
the same range of repressor values and k2 values (Fig. 4B, bottom) computed in MATLAB
R2020b.
Table 1 Parameter values used to plot the repression function f (R) and its sensitivity with respect to
R (Fig. 4B)
Parameter Value
α1 95.2
β1 25.6
α2 43.4
β2 28.7
α3 98.3
β3 20.1
Kd 1
k3 1.9
AT 98.9Tyler et al. Genome Biology (2022) 23:17 Page 15 of 18
Counting parameter sets for which the phospholock model generates oscillations
We randomly generated 104 parameter sets where AT , α1 , β1 , . . . , α3 , and β3 were sampled
from a uniform distribution between 0 and 100. Then, we sampled the parameters k1f and
k2f from a uniform distribution between 0 and 1. To guarantee Kd = 1, we set k1r = k1f .
Additionally, we sampled k3 from a uniform distribution between 0 and 0.1.
Next, we simulated the phospholock model for each randomly generated parameter
set using the function ode23tb in MATLAB. Specifically, we randomly initialized the
initial conditions and ran the model for 300 time units. Then, we took the mean of the
M values and simulated the model again. The second time, however, we ran an event
location procedure where the ode solver saves all times that satisfy: (1) M is equal to the
mean calculated from the initial run and (2) M is increasing. Then, we concluded that the
model oscillated if
|(te1 − te2 ) − (te2 − te3 )| < 0.001,
where te1 is the last time that the event took place, te2 is the second to last, and te3 is the
third to last. We checked several plots of the oscillating parameter sets to make sure that
our procedure selected parameter sets that generate oscillations.
Finally, we simulated the 104 randomly generated parameter sets varying the phospho-
rylation strengths by setting k2r = 100 · k2f (strongest dephosphorylation, Fig. 2C; left),
k2r = 10 · k2f , k2r = k2f , . . . , k2r = 0.0001 · k2f (strongest phosphorylation, Fig. 2C; right).
Each time, we counted how many parameter sets generated oscillations.
Stoichiometric ratio analysis
Beginning with k3 = 0, we randomly generate parameter sets until we recovered 100
such that the phospholock model with added activator phosphorylation generates oscil-
lations (see Eqn. (56) in Supplementary Information for the updated repression function
in this case). In particular, we randomly sample AT , α1 , β1 , . . . , α3 , and β3 from a uniform
distribution between 0 and 100. Next, we sample k1f , k2r , and k4f from a uniform distri-
bution between 0 and 1. We set Kd = 10−5 in this case, so k1r = 10−5 · k1f . Additionally,
we assume phosphorylation is stronger than dephosphorylation in the phospholock, so
we set k2f = 10 · k2r . Finally, we set autophosphorylation and autodephosphorylation as
equal, so k4r = k4f . Parameter sets were assessed for whether they generated oscillations
based on the same method as above.
For each of the 100 parameter sets that exhibit oscillations, we compute the sto-
ichiometric ratio in the following way. First, we solve the following equation for R.
AT − K̃3 · AR β1 β2 β3 R
= , (2)
1 + k4 α1 α2 α3
where
K̃1 AT + K̃3 RT + K̃2 (1 + k4 ) − (K̃1 AT + K̃3 RT + K̃2 (1 + k4 ))2 − 4K̃1 K̃3 AT RT
AR = .
2K̃1 K̃3
The solution to Eqn. (2) gives the repressor concentration at the steady state. Then, the
stoichiometric ratio is
R
S= ,
AT
where R solves Eqn. (2).Tyler et al. Genome Biology (2022) 23:17 Page 16 of 18
Supplementary Information
The online version contains supplementary material available at https://doi.org/10.1186/s13059-021-02571-0.
Additional file 1: A separate pdf file that includes more detailed mathematical derivations and analysis of the
models presented in the main text, Figures S1-S4, and Tables S1 and S2.
Additional file 2: Review history.
Review history
The review history is available as Additional file 2.
Authors’ contributions
JT, YL, JD, and DF designed the study. JT and YL performed the mathematical analysis. JT, YL, JD, and DF analyzed the
results and wrote the manuscript. All authors read and approved the final manuscript.
Funding
This work was supported by a National Institutes of Health Training Grant (T32 HL007622), by the National Institutes of
Health (R35GM118021), and by the National Science Foundation (DMS 1714059 and DMS 2052499).
Availability of data and materials
The codes for the phospholock analyses are provided in the GitHub repository (https://github.com/jptyler/Phospholock)
under MIT license [43].
Declarations
Ethics approval and consent to participate
Not applicable.
Competing interests
The authors declare they have no competing interests.
Author details
1 Department of Mathematics, University of Michigan, 48109 Ann Arbor, MI, USA. 2 Division of Pediatric
Hematology/Oncology, Department of Pediatrics, University of Michigan, 48109 Ann Arbor, MI, USA. 3 Department of
Molecular and Systems Biology, Geisel School of Medicine at Dartmouth, 03755 Hanover, NH, USA. 4 Department of
Computational Medicine and Bioinformatics, University of Michigan, 48109 Ann Arbor, MI, USA.
Received: 3 November 2020 Accepted: 7 December 2021
References
1. Ouyang Y, Andersson CR, Kondo T, Golden SS, Johnson CH. Resonating circadian clocks enhance fitness in
cyanobacteria. P Natl Acad Sci USA. 1998;95(15):8660–64. https://doi.org/10.1073/pnas.95.15.8660.
https://www.pnas.org/content/95/15/8660.full.pdf.
2. Dunlap JC. Molecular bases for circadian clocks. Cell. 1999;96(2):271–90. https://doi.org/10.1016/S0092-
8674(00)80566-8.
3. Alon U. Network motifs: theory and experimental approaches. Nat Rev Genet. 2007;8(6):450–61. https://doi.org/10.
1038/nrg2102.
4. Tseng R, Chang Y-G, Bravo I, Latham R, Chaudhary A, Kuo N-W, LiWang A. Cooperative KaiA-KaiB-KaiC interactions
affect KaiB/SasA competition in the circadian clock of cyanobacteria. J Mol Biol. 2014;426(2):389–402. https://doi.
org/10.1016/j.jmb.2013.09.040.
5. Chang Y-G, Cohen SE, Phong C, Myers WK, Kim Y-I, Tseng R, Lin J, Zhang L, Boyd JS, Lee Y, Kang S, Lee D, Li S,
Britt RD, Rust MJ, Golden SS, LiWang A. A protein fold switch joins the circadian oscillator to clock output in
cyanobacteria. Science. 2015;349(6245):324–28. https://doi.org/10.1126/science.1260031
https://science.sciencemag.org/content/349/6245/324.full.pdf.
6. Nishiwaki T, Satomi Y, Nakajima M, Lee C, Kiyohara R, Kageyama H, Kitayama Y, Temamoto M, Yamaguchi A,
Hijikata A, Go M, Iwasaki H, Takao T, Kondo T. Role of KaiC phosphorylation in the circadian clock system of
Synechococcus elongatus PCC 7942. P Natl Acad Sci USA. 2004;101(38):13927–32. https://doi.org/10.1073/pnas.
0403906101. https://www.pnas.org/content/101/38/13927.full.pdf.
7. Clodong S, Dühring U, Kronk L, Wilde A, Axmann I, Herzel H, Kollmann M. Functioning and robustness of a
bacterial circadian clock. Mol Syst Biol. 2007;3:90. https://doi.org/10.1038/msb4100128.
8. AXMANN IM, LEGEWIE S, HERZEL H, MINIMAL CIRCADIAN CLOCK MODEL A54–64. https://doi.org/10.1142/
9781860949920_0006. https://www.worldscientific.com/doi/pdf/10.1142/9781860949920_0006. https://www.
worldscientific.com/doi/abs/10.1142/9781860949920_0006.
9. Tseng R, Goularte NF, Chavan A, Luu J, Cohen SE, Chang Y-G, Heisler J, Li S, Michael AK, Tripathi S, Golden SS,
LiWang A, Partch CL. Structural basis of the day-night transition in a bacterial circadian clock. Science. 2017;355(6330):
1174–80. https://doi.org/10.1126/science.aag2516. https://science.sciencemag.org/content/355/6330/1174.full.pdf.
10. Rust MJ, Markson JS, Lane WS, Fisher DS, O’Shea EK. Ordered phosphorylation governs oscillation of a
three-protein circadian clock. Science. 2007;318(5851):809–12.Tyler et al. Genome Biology (2022) 23:17 Page 17 of 18
11. Lin J, Chew J, Chockanathan U, Rust MJ. Mixtures of opposing phosphorylations within hexamers precisely time
feedback in the cyanobacterial circadian clock. P Natl Acad Sci USA. 2014;111(37):3937–45. https://doi.org/10.1073/
pnas.1408692111. https://www.pnas.org/content/111/37/E3937.full.pdf.
12. Phong C, Markson JS, Wilhoite CM, Rust MJ. Robust and tunable circadian rhythms from differentially sensitive
catalytic domains. P Natl Acad Sci USA. 2013;110(3):1124–29. https://doi.org/10.1073/pnas.1212113110.
https://www.pnas.org/content/110/3/1124.full.pdf.
13. van Zon JS, Lubensky DK, Altena PRH, ten Wolde PR. An allosteric model of circadian KaiC phosphorylation. P Natl
Acad Sci USA. 2007;104(18):7420–25. https://doi.org/10.1073/pnas.0608665104.
https://www.pnas.org/content/104/18/7420.full.pdf.
14. Kim JK, Forger DB. A mechanism for robust circadian timekeeping via stoichiometric balance. Mol Syst Biol.
2012;8(1):630. https://doi.org/10.1038/msb.2012.62. https://www.embopress.org/doi/pdf/10.1038/msb.2012.62.
15. Thron CD. The secant condition for instability in biochemical feedback control–I, The role of cooperativity and
saturability. B Math Biol. 1991;53(3):383–401. https://doi.org/10.1016/S0092-8240(05)80394-5.
16. Forger DB. Biological Clocks, Rhythms, and Oscillations. Cambridge: The MIT Press; 2017.
17. Kageyama H, Nishiwaki T, Nakajima M, Iwasaki H, Oyama T, Kondo T. Cyanobacterial circadian pacemaker: Kai
protein complex dynamics in the KaiC phosphorylation cycle in vitro. Mol Cell. 2006;23(2):161–71. https://doi.org/10.
1016/j.molcel.2006.05.039.
18. Mori T, Sugiyama S, Byrne M, Johnson CH, Uchihashi T, Ando T. Revealing circadian mechanisms of integration
and resilience by visualizing clock proteins working in real time. Nat Commun. 2018;9(1):3245. https://doi.org/10.
1038/s41467-018-05438-4.
19. Kim JK. Protein sequestration versus Hill-type repression in circadian clock models. IET Syst Biol. 2016;10:125–13510.
20. Swan JA, Golden SS, LiWang A, Partch CL. Structure, function, and mechanism of the core circadian clock in
cyanobacteria. J Biol Chem. 2018;293(14):5026–34. https://doi.org/10.1074/jbc.TM117.001433.
21. Gutu A, O’Shea EK. Two antagonistic clock-regulated histidine kinases time the activation of circadian gene
expression. Mol Cell. 2013;50(2):288–94. https://doi.org/10.1016/j.molcel.2013.02.022.
22. Takai N, Nakajima M, Oyama T, Kito R, Sugita C, Sugita M, Kondo T, Iwasaki H. A KaiC-associating SasA–RpaA
two-component regulatory system as a major circadian timing mediator in cyanobacteria. P Natl Acad Sci USA.
2006;103(32):12109–14. https://doi.org/10.1073/pnas.0602955103.
https://www.pnas.org/content/103/32/12109.full.pdf.
23. Ode KL, Ukai H, Susaki EA, Narumi R, Matsumoto K, Hara J, Koide N, Abe T, Kanemaki MT, Kiyonari H, Ueda HR.
Knockout-rescue embryonic stem cell-derived mouse reveals circadian-period control by quality and quantity of
cry1. Mol Cell. 2017;65(1):176–90. https://doi.org/10.1016/j.molcel.2016.11.022.
24. Dunlap JC, Loros JJ. Just-So Stories and Origin Myths: Phosphorylation and Structural Disorder in Circadian Clock
Proteins. Mol Cell. 2018;69(2):165–68. https://doi.org/10.1016/j.molcel.2017.11.028.
25. Baker CL, Kettenbach AN, Loros JJ, Gerber SA, Dunlap JC. Quantitative proteomics reveals a dynamic interactome
and phase-specific phosphorylation in the Neurospora circadian clock. Mol Cell. 2009;34(3):354–63. https://doi.org/
10.1016/j.molcel.2009.04.023.
26. Gonze D, Abou-Jaoudé W. The Goodwin model: Behind the Hill function. PLoS ONE. 2013;8(8):1–15. https://doi.org/
10.1371/journal.pone.0069573.
27. Hong CI, Jolma IW, Loros JJ, Dunlap JC, Ruoff P. Simulating dark expressions and interactions of frq and wc-1 in the
Neurospora circadian clock. Biophys J. 2008;94(4):1221–32. https://doi.org/10.1529/biophysj.107.115154.
28. Bellman J, Kim JK, Lim S, Hong CI. Modeling reveals a key mechanism for light-dependent phase shifts of
Neurospora circadian rhythms. Biophys J. 2018;115(6):1093–102. https://doi.org/10.1016/j.bpj.2018.07.029.
29. Upadhyay A, Brunner M, Herzel H. An inactivation switch enables rhythms in a Neurospora clock model. Int J Mol
Sci. 2019;20(12):2985. https://doi.org/10.3390/ijms20122985.
30. He Q, Shu H, Cheng P, Chen S, Wang L, Liu Y. Light-independent phosphorylation of white collar-1 regulates its
function in the neurospora circadian negative feedback loop. J Biol Chem. 2005;280(17):17526–32. https://doi.org/
10.1074/jbc.M414010200. http://www.jbc.org/content/280/17/17526.full.pdf+html.
31. He Q, Cha J, He Q, Lee H-C, Yang Y, Liu Y. CKI and CKII mediate the FREQUENCY-dependent phosphorylation of
the WHITE COLLAR complex to close the Neurospora circadian negative feedback loop. Gen Dev. 2006;20(18):
2552–65. https://doi.org/10.1101/gad.1463506. http://genesdev.cshlp.org/content/20/18/2552.full.pdf+html.
32. Wang B, Kettenbach AN, Zhou X, Loros JJ, Dunlap JC. The phospho-code determining circadian feedback loop
closure and output in Neurospora. Mol Cell. 2019;74(4):771–7843. https://doi.org/10.1016/j.molcel.2019.03.003.
33. Schafmeier T, Haase A, Káldi K, Scholz J, Fuchs M, Brunner M. Transcriptional feedback of Neurospora circadian
clock gene by phosphorylation-dependent inactivation of its transcription factor. Cell. 2005;122(2):235–46. https://
doi.org/10.1016/j.cell.2005.05.032.
34. Hong CI, Ruoff P, Loros JJ, Dunlap JC. Closing the circadian negative feedback loop: Frq-dependent clearance of
wc-1 from the nucleus. Gen Dev. 2008;22(22):3196–204. https://doi.org/10.1101/gad.1706908.
http://genesdev.cshlp.org/content/22/22/3196.full.pdf+html.
35. Hong L, Lavrentovich DO, Chavan A, Leypunskiy E, Li E, Matthews C, LiWang A, Rust MJ, Dinner AR. Bayesian
modeling reveals metabolite-dependent ultrasensitivity in the cyanobacterial circadian clock. Mol Syst Biol.
2020;16(6):9355. https://doi.org/10.15252/msb.20199355.
https://www.embopress.org/doi/pdf/10.15252/msb.20199355.
36. Heisler J, Swan JA, Palacios JG, Sancar C, Ernst DC, Spangler RK, Bagshaw CR, Tripathi S, Crosby P, Golden SS,
Partch CL, LiWang A. Structural mimicry confers robustness in the cyanobacterial circadian clock. bioRxiv. 2020.
https://doi.org/10.1101/2020.06.17.158394. https://www.biorxiv.org/content/early/2020/06/19/2020.06.17.158394.
full.pdf.
37. Cao X, Yang Y, Selby CP, Liu Z, Sancar A. Molecular mechanism of the repressive phase of the mammalian
circadian clock. P Natl Acad Sci USA. 2021;118(2):. https://doi.org/10.1073/pnas.2021174118.
https://www.pnas.org/content/118/2/e2021174118.full.pdf.Tyler et al. Genome Biology (2022) 23:17 Page 18 of 18
38. Larrondo LF, Olivares-Yañez C, Baker CL, Loros JJ, Dunlap JC. Decoupling circadian clock protein turnover from
circadian period determination. Science. 2015;347(6221):. https://doi.org/10.1126/science.1257277.
https://science.sciencemag.org/content/347/6221/1257277.full.pdf.
39. Partch CL. Orchestration of circadian timing by macromolecular protein assemblies. J Mol Biol. 2020;432(12):
3426–48. https://doi.org/10.1016/j.jmb.2019.12.046. Circadian Regulation: from Molecules to Physiology.
40. Tyson JJ, Othmer HG. The dynamics of feedback cellular control circuits in biochemical pathways. Prog Theor Biol.
1978;5:1–62.
41. Yang X. Generalized form of Hurwitz-Routh criterion and Hopf bifurcation of higher order. Appl Math Lett.
2002;15(5):615–21. https://doi.org/10.1016/S0893-9659(02)80014-3.
42. Parico GCG, Perez I, Fribourgh JL, Hernandez BN, Lee H-W, Partch CL. The human CRY1 tail controls circadian
timing by regulating its association with CLOCK:BMAL1. P Natl Acad Sci USA. 2020. https://doi.org/10.1073/pnas.
1920653117. https://www.pnas.org/content/early/2020/10/23/1920653117.full.pdf.
43. Tyler J, Lu Y, Dunlap J, Forger D. Phospholock. GitHub. 2021. https://github.com/jptyler/Phospholock. Accessed 30
Dec 2021.
Publisher’s Note
Springer Nature remains neutral with regard to jurisdictional claims in published maps and institutional affiliations.You can also read