The New Standardized Malaysian Healthy Eating Index - MDPI
←
→
Page content transcription
If your browser does not render page correctly, please read the page content below

nutrients
Article
The New Standardized Malaysian Healthy Eating Index
Marhamah Jailani 1 , Siti Masitah Elias 1, *                 and Roslee Rajikan 2

                                          1   Faculty of Science and Technology, Universiti Sains Islam Malaysia, Nilai 71800, Malaysia;
                                              marhamah.jailani@gmail.com
                                          2   Faculty of Health Science, Universiti Kebangsaan Malaysia, Kuala Lumpur 50300, Malaysia;
                                              roslee@ukm.edu.my
                                          *   Correspondence: masitah@usim.edu.my; Tel.: +60-6798-8767

                                          Abstract: Healthy Eating Index (HEI) is a diet quality measure that assesses the population’s com-
                                          pliance towards dietary guidelines. In Malaysia, diet quality measure, though existing, has some
                                          limitations in terms of application and relevance. This study aims to develop a new standardized
                                          Malaysian Healthy Eating Index (S-MHEI) that can measure the diet quality of all Malaysians re-
                                          gardless of their energy requirement level. The Malaysian Dietary Guidelines (MDG) 2010 and
                                          MDG for Children and Adolescents (MDGCA) 2013 were used as main references in developing
                                          the index components. In addition, the latest Malaysian Adults Nutrition Survey (MANS) and
                                          Adolescent Nutrition Survey (ANS) were also referred to ensure the relevance of the components
                                          selected. For adequacy components, the least restrictive method was used in setting the standard
                                          for the scoring system. Meanwhile, the scoring system for moderation components was built based
                                          on the Recommended Nutrient Intake (RNI) 2017. The new S-MHEI comprises of 11 components
                                          with a maximum total score of 100. The least restrictive method allowed the index to be used across
                                          energy requirement levels. However, the index will not be sensitive towards adhering to the specific
                                          recommended amount of intake—which in effect, made the index focus on measuring diet quality

                                   rather than diet quantity.
Citation: Jailani, M.; Elias, S.M.;
Rajikan, R. The New Standardized
                                          Keywords: healthy eating index; Malaysian population; least restrictive
Malaysian Healthy Eating Index.
Nutrients 2021, 13, 3474. https://
doi.org/10.3390/nu13103474
                                          1. Introduction
Academic Editor: Stefano Erzegovesi             The Healthy Eating Index (HEI) was first developed in 1995 to assess the overall diet
                                          quality of the American population by integrating nutrient needs and dietary guidelines in
Received: 28 July 2021                    one single measure [1]. Since then, the index has been revised and improvised, and later
Accepted: 14 September 2021
                                          was widely adapted by other countries to evaluate the population’s diet quality in terms of
Published: 30 September 2021
                                          conformity towards the respective country’s dietary guidelines [2–13]. The validity and the
                                          reliability of the index has been proven by numerous studies [10,12,14–22]. In addition to
Publisher’s Note: MDPI stays neutral
                                          the validity and reliability evaluation, researchers have also been expanding the use of the
with regard to jurisdictional claims in
                                          HEI to the studies in epidemiology, population and subpopulation monitoring and nutri-
published maps and institutional affil-
                                          tion interventions [23–37]. Other possible uses of HEI include to scrutinize the connection
iations.
                                          between diet quality and diet cost [38], socio-demographic and economic indicator [39],
                                          and to evaluate diet quality in different levels of food environment (e.g., national level food
                                          supply, grocery stores and restaurant menus) [7,11,13].
                                                In Malaysia, there were several attempts to develop a diet quality measure based on
Copyright: © 2021 by the authors.         the Malaysian Dietary Guidelines (MDG) and Malaysian Food Pyramid (MFP), i.e., the
Licensee MDPI, Basel, Switzerland.
                                          Healthy Eating Index for Malaysian Adults (HEI-MA) [40], Malaysian Healthy Eating
This article is an open access article
                                          Index (MHEI) [41] and Malaysian Diet Quality Index (MDQI) [42]. The HEI-MA and MHEI
distributed under the terms and
                                          were similar in terms of scoring system, where both adopted servings-based scoring criteria
conditions of the Creative Commons
                                          introduced by Kennedy et al., (1995) [1]. This method limited the use of the indices to only
Attribution (CC BY) license (https://
                                          certain energy requirements included in the MDG 2010 (1500 to 2500 kcal). Furthermore,
creativecommons.org/licenses/by/
4.0/).
                                          the criteria for minimum score for total fat and sodium (or natrium) in both indices were

Nutrients 2021, 13, 3474. https://doi.org/10.3390/nu13103474                                                https://www.mdpi.com/journal/nutrients
Nutrients 2021, 13, 3474                                                                                            2 of 12

                           also derived based on the 85th percentile of the population intake as in the Malaysian
                           Adults Nutrition Survey (MANS) 2003 which can be considered outdated and needed to
                           be revised with the publication of the newer MANS 2014.
                                 The only difference between these two indices was that MHEI included food variety
                           as a component. Despite the importance of diet diversity in achieving a balanced diet,
                           Waijers et al., had argued against the need of including diet variety as an index’s component
                           as it may lead to a double-scoring problem [43]. In the case of MHEI, there were seven
                           adequacy components of different food groups included, and the criteria of having the
                           maximum score for the variety component was to have at least seven types of foods per
                           day. Thus, obtaining a non-zero score for each adequacy component had actually implied
                           diet diversity [11]. In contrast, a less diverse diet would be reflected through more zero
                           scores which would accumulate into a lower total score. Therefore, even without the
                           variety component, the combined score would eventually demonstrate diet variety in the
                           consumption pattern.
                                 On the other hands, MDQI was different from HEI in terms of component selection
                           and scoring method. A food group will only be selected to be the index’s component if
                           it passes the reliability and validity testing. In conducting the tests, MDQI used MANS
                           2003 Food Frequency Questionnaire (FFQ) data. This led to the same issue as HEI-MA and
                           MHEI where the relevance of MDQI components need to be revised with the issuance of
                           MANS 2014. Furthermore, MDQI used a bidirectional scoring system where the criteria
                           for scoring consider both intake frequency and serving size. This method limits the DQI
                           application in statistical analysis and further in diet–disease research [11].
                                 Despite the limitations of the existing indices, numbers of studies were found using
                           these indices as a measure of the population’s diet quality which reflects their impor-
                           tance [44–48]. This leads to the need for the development of one standard Malaysian
                           HEI that can suit the needs of all energy requirement levels using the latest information
                           available. Thus, this study aims to develop a new and more standardized MHEI that can
                           be used to assess the population’s overall diet quality. The development of the index will
                           be described thoroughly in this article.
                                 The new standardized MHEI (S-MHEI) will be a very useful tool in assessing changes
                           in Malaysians’ diet quality over time and the population adherence to the MDG provided by
                           the Ministry of Health. This information will help the ministry in planning the intervention
                           program, population monitoring and strategy in reducing the cases of malnutrition among
                           Malaysians according to the food groups relevant. In addition, the index can be applied
                           in a larger research area to have a deeper understanding about diet related diseases and
                           demographic factors that influence poor dietary intake.

                           2. Materials and Methods
                           2.1. Method to Development the S-MHEI Components
                                To assess overall diet quality of Malaysian population, the components of the index
                           were developed based on MDG 2010 [49] and Malaysian Dietary Guidelines for Children
                           and Adolescent (MDGCA) 2013 [50]–the latest version of the MDG and MDGCA available.
                           These guidelines compiled the science-based nutrition and physical activity recommenda-
                           tion with the aim to provide culturally sensitive dietary advice suited to the dietary needs
                           of the various communities in Malaysia apart from physical activity recommendation.
                           Diet-related recommendations were shortlisted and analyzed before being translated into
                           the index components and divided into either adequacy or moderation type. The ade-
                           quacy component refers to food group that was recommended to be consumed sufficiently
                           while moderation component denotes food group that was advised to be taken within
                           reasonable limits.
                                Since the MDG and the MDGCA are not being revised very regularly, the rele-
                           vance of the components was further analyzed by looking at the population’s intake
                           in Malaysian Adult Nutrition Survey (MANS) 2014 [51] and Adolescent Nutrition Survey
                           (ANS) 2017 [52]. In the case where the survey result proves that the intake of the short-listed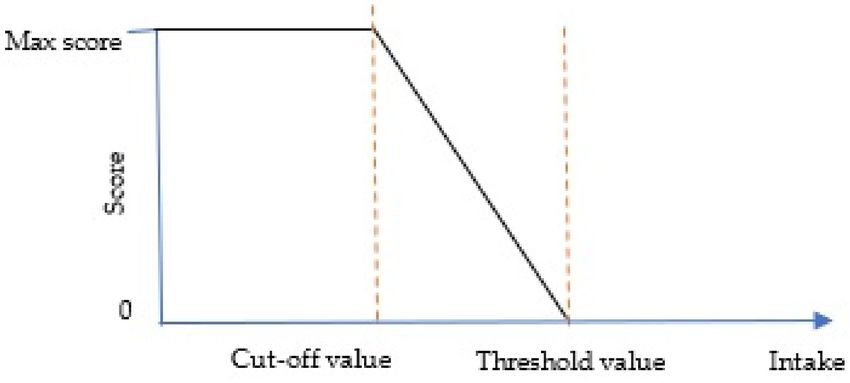
Nutrients 2021, 13, 3474                                                                                            3 of 12

                           component has been satisfied by the population, that particular component will be taken
                           out from the list so that the end result is very specific and focuses only on the dietary
                           quality that needs to be improved. This additional analysis is important in reassessing the
                           relevance of component type. For instance, if the intake level of an adequacy component is
                           too high, the component type should be changed from adequacy to moderation to ensure
                           the consumption of the component is within the standard of diet quality.

                           2.2. Method to Develop the S-MHEI Scoring Standard
                                This study adopted the least restrictive standard introduced by Guenther et al. (2008) [2]
                           in setting the criteria for the scoring of population dietary intake. In this standard, the
                           easiest-to-achieve recommendation among appropriate energy requirement level was
                           chosen as the cut-off point for maximum score. As for the threshold value for minimum
                           score, all adequacy components will take the value 0 which indicates no consumption
                           while the moderation and optimal components will refer to the recommendations in the
                           Recommended Nutrient Intake (RNI) 2017 [53] and the latest WHO guidelines (if existing)
                           which were built based on clear evidence that specifies how high an intake must be to be
                           considered high enough that it deserves the score 0.
                                Using this standard, the scores are expected to turn out higher than when the standard
                           is not applied as it focuses more on identifying intakes that do not meet the recommen-
                           dations [2] rather than being sensitive in terms of fulfilling specific amount of food for
                           each energy requirement. In effect, the final score will give information on the level of diet
                           quality achieved by the population instead of explaining how many people do not meet
                           the precise amount of food that they are supposed to consume.
                                In setting the standard, energy density approach was used where the recommended
                           servings for each food component were converted into amounts per 1000 kcal for every
                           energy requirement level. To obtain the serving size of the food components for every
                           energy requirement level, computer simulation method was used and 10,000 data sets were
                           generated based on the amount of carbohydrate, protein and fat in each food component
                           as outlined in MDG2010. Any data set that is outside the recommended percentage of
                           macronutrient contribution towards Total Energy Intake (TEI) as described in RNI 2017
                           (carbohydrates 50–65% TEI, fat 25–30% TEI and protein 10–20% TEI) [53] were eliminated.
                           In the case that a specific micronutrient or macronutrient was chosen as one of the index’s
                           components, the recommendations were expressed in either milligrams (mg) or percentage
                           of daily TEI. The elimination of simulated dietary intake that falls outside the acceptable
                           percentage will mimic a more plausible and healthy diet intake for each calorie level.

                           3. Results and Discussion
                           3.1. Components of the S-MHEI
                                 The MDG 2010 and MDGCA 2013 consists of key messages covering the recommen-
                           dations on food variety, body weight, physical activity, food and beverages consumption,
                           flavors, water consumption, breastfeeding practice, food safety and food labels. On the
                           first stage, key messages that are not relevant were excluded (i.e., body weight, physical
                           activity, breastfeeding practice, food safety and food labels). Food variety recommendation
                           was also removed from being part of the index component due to the reasons presented in
                           the previous subsection.
                                 Findings of MANS 2014 showed that Malaysian adults have met the recommended
                           intake of plain water in terms of its amount and frequency [51]. Apart from that, plain
                           water is also calorie-free which made it irrelevant to be included in the index. Thus, water
                           was also eliminated from being part of the index component. It is also important to note
                           that both MANS 2014 and ANS 2017 highlighted the concern on the increasing intake of
                           sugar among Malaysian adults and adolescents. Therefore, added sugar was included
                           as one of the index components even though there are no specific key messages on the
                           recommended amount of intake in both the MDG 2010 and MDGCA 2013.
Nutrients 2021, 13, 3474 4 of 12
The remaining key messages were then scrutinized and developed into 11 components
that reflect both the MDG 2010 and MDGCA 2013 recommendations on healthy food
consumption. The 11 components were further grouped into three categories according to
their recommendation type, i.e., adequacy, optimal or moderation. The components, their
type and the recommendations from the MDG 2010 and MDGCA 2013 from which the
components were derived are presented in the following Table 1.
Table 1. S-MHEI’s components and related MDG2010 and MDGCA2013 recommendations.
No Component Type a Recommendation from MDG2010 Recommendation from MDGCA2013
Consume at least four servings of cereal Ensure an adequate intake of cereal and cereal
1 Total grains A
foods daily based foods according to age
Choose at least half of your grain products Ensure that at least half of daily cereal intake
2 Whole grains A
from whole grains includes whole grain
3 Fruits A Eat at least 2 servings of fruits a day Eat variety of fruit and vegetables every day.
Eat adequate amount of fruits and vegetables
4 Vegetables A Eat at least 3 servings of vegetables a day every day
5 Fish A Choose fish more frequently; if possible, daily Eat fish daily
6 Meat, poultry and eggs A Consume meat, poultry and egg moderately Consume meat, poultry and egg moderately
Consume legumes daily. Consume legumes daily
7 Legumes and nuts A
Include nuts and seeds in weekly diet Include nuts and seeds in weekly diet
Consume 2 to 3 servings of milk and milk
8 Milk and milk products A Consume milk and milk product everyday
products everyday
Minimize the use of fat in food preparation in
Limit total daily fat intake to 25 and 30%
9 Total Fat O order to keep total daily fat intake between 20
of energy
to 30% energy
Limit salt intake to 1 teaspoon a day
10 Sodium M Reduce consumption of highly salted foods Limit intake of salt and sauce
and condiments
11 Sugar M Consume food and beverages low in sugar. Consume food and beverages low in sugar.
a A refers to adequacy component; O refers to optimal components; M refers to moderation component.
3.2. S-MHEI’s Score and Interpretation
For most of the index’s components, a maximum of 10 points are assigned when the
specific criteria are fulfilled. However, for ‘total grains’ (which include rice, other cereal
products and tubers; and ‘whole grain’, the maximum score assigned for both components
is five to avoid overlapped scoring since both components are from the same food group.
In effect, the whole index has a total score of 100. A dietary intake score of more than 80%
shows good diet quality while a score between 51 and 80% indicates the diet quality needs
an improvement, while a total score below 51% is considered poor diet quality [54].
3.3. Standard for Scoring Adequacy Component
For adequacy components, the minimum score of zero is assigned when the compo-
nent is not consumed at all, and the maximum score will be given when the component
intake is equal or higher than the cut-off value. The score of intakes between zero and the
cut-off value are prorated linearly and calculated as below:
The reported intake
Score = × The maximum score (1)
The cut o f f value
The following Figure 1 illustrates the relationship between the score and the intake of
adequacy component.Nutrients 2021, 13, 3474 5 of 12
Figure 1. Relationship between score and adequacy component intake.
The cut-off value for adequacy components is the lowest recommended amount ‘per
1000 kcal’ for daily energy intake between 1200 to 3000 kcal. When an energy density
approach was applied, the amount appeared to be quite similar across energy levels
(Table 2) and not increasing linearly as when they were not expressed in ‘per 1000 kcal’
unit. Thus, by applying the least restrictive method in determining the cut-off value,
the value chosen still meets the needs of people who have higher energy requirements
since the higher calorie patterns had the same nutrient goals [2]. For example, in Table 2,
the lowest recommended amount of total grains for daily energy intake between 1200 to
3000 kcal grains is 1.4 servings per 1000 kcal. This means that for someone who needs
2500 kcal, he must consume at least (2500 kcal × 1.4 servings/1000 kcal) 3.5 servings daily
to get the maximum score while someone who needs 3000 kcal must consume at least
(3000 kcal × 1.4 servings/1000 kcal) 4.2 servings daily to achieve the maximum score.
Table 2. Recommended servings according to food group (adequacy component), expressed per 1000 kcal.
Food
Calorie Level (kcal)
Group
1000 1100 1200 1300 1400 1500 1600 1700 1800 1900 2000 2100 2200 2300 2400 2500 2600 2700 2800 2900 3000
Total 1.0 1.5 1.4 1.4 1.6 1.7 1.9 2.1 2.3 2.4 2.6 2.7 2.9 3.0 3.0 3.0 3.0 3.0 3.0 2.9 2.9
grains 1
Whole 0.5 0.8 0.7 0.7 0.8 0.9 1.0 1.1 1.2 1.2 1.3 1.4 1.5 1.5 1.5 1.5 1.5 1.5 1.5 1.5 1.5
grain 1
Fruits 2 1.5 1.4 1.5 1.5 1.5 1.5 1.3 1.2 1.2 1.1 1.1 1.0 0.9 0.9 0.9 0.9 1.0 1.1 1.1 1.1 1.2
Vegetables 1.5 1.4 1.3 1.3 1.3 1.2 1.3 1.3 1.4 1.4 1.5 1.5 1.6 1.8 1.7 1.6 1.6 1.4 1.4 1.2 1.2
Fish 3 0.6 0.6 0.6 0.6 0.7 0.6 0.6 0.6 0.6 0.5 0.5 0.5 0.5 0.5 0.5 0.5 0.5 0.5 0.5 0.4 0.4
Meat,
poultry
0.3 0.4 0.4 0.5 0.5 0.6 0.6 0.7 0.7 0.7 0.7 0.7 0.8 0.8 0.8 0.8 0.8 0.8 0.8 0.8 0.8
and
eggs 4
Legumes
and 0.9 0.9 0.7 0.8 0.7 0.7 0.6 0.6 0.6 0.5 0.5 0.5 0.4 0.4 0.4 0.4 0.4 0.4 0.4 0.4 0.4
Nuts 5
Milk and
milk
prod- 2.3 1.8 1.7 1.6 1.5 1.4 1.4 1.3 1.2 1.2 1.1 1.1 1.0 1.0 1.0 1.0 0.9 0.9 0.9 0.9 0.9
ucts 6
1 based on 30 g carbohydrate per serving; 2 based on 15 g carbohydrate per serving; 3 based on 14 g protein per serving; 4 based on 14 g
protein per serving; 5 based on 7 g protein per serving; 6 based on 7 g protein per serving.
Energy requirements lower than 1200 kcal are not considered since they usually aimed
only at children between 2 to 3 years old whose recommended nutrient intake is too low
compared to the rest of the population, even when expressed on a density basis.
3.4. Standard for Scoring Moderation Components
For the moderation component, zero will be assigned if the component consumption
is above the threshold value and the maximum points will be given if the intake is equalNutrients 2021, 13, 3474 6 of 12
to or lower than the cut-off value. The score between the cut-off value and the threshold
value will be awarded proportionately as the calculation below:
( The threshold value − The reported intake)
Score = × The maximum score (2)
( The threshold value − The cuto f f value)
Determining the threshold value for the moderation component is quite tricky since
there is no clear scientific evidence that specifies how high an intake must be to be con-
sidered high enough that it deserves the score 0 [2]. In the case where a standard is set to
be high enough that a large proportion of the population get the minimum score of zero,
overtime changes and difference among individuals and groups will be hard to detect at
the low end of the scoring range [2]. Figure 2 illustrates the relationship between the score
and the intake of moderation components.
Figure 2. Standard for scoring moderation components.
3.4.1. Sodium
For sodium, WHO recommends less than 2000 mg sodium per day for adults and
the amount shall be adjusted downward based on the energy requirements of children
relative to those of adults [55]. Meanwhile, the RNI 2017 recommendation on sodium
intake for children aged 4 years old to adults is between 1200 to 1500 mg per day; and
2300 mg was set as the highest upper limit among all ages since it has the lowest observed
adverse effect level (LOAEL). Findings from ANS 2017 found that, 75.1% of adolescents
exceeded the NPANM III target, 19.2% achieved them and 5.7% took less than 75% of
the recommended intake of sodium. The median sodium intake as a percentage of the
recommended nutrient intake among adolescents (1500 mg sodium was recommended for
adolescent of age 13–17 years old) was 179.65%, which is equivalent to 2694.73 mg. On the
other hand, MANS 2014 showed that the median sodium intake among Malaysian adults
was about 1935 mg/day.
The concern with high salt intake as raised in MDG 2010 was based on the evidence
of an association between dietary salt intake and blood pressure which has been regarded
by WHO as high-quality evidence [55]. The recent National Health and Morbidity Survey
(NHMS) 2019 also reported the high prevalence of hypertension among Malaysian adults
was still high and only slight reduction was recorded from the year 2015 (30.3%) to the year
2019 (30.0%). This progress is quite insignificant given that Malaysia, as a WHO member
state, has agreed to bring down the global population salt consumption by 30% by year
2025 [56].
Therefore, 2300 mg will be set as the threshold value for the minimum score, zero, due
to the concern on the LOAEL. Since 80% marks a good diet quality, 2000 mg of sodium
intake is set to get the score of eight and as a result, 1925 mg of sodium intake will mark
the cut-off value for maximum point of 10, which satisfies the recommendations of WHO.
Even though the cut-off value exceeds RNI 2017 recommendation, it is still acceptable since
the main concern in measuring diet quality is more to observe the population who do not
adhere to dietary recommendations rather than strictly abiding by the quantity suggested.
In other words, we are more interested in the number of populations who get the minimumNutrients 2021, 13, 3474 7 of 12
score compared to number of populations who do not reach the maximum score. The
following Table 3 summarizes the score and level of sodium intake.
Table 3. Summary of score correspond to Sodium intake (mg).
Score 0 1 2 3 4 5 6 7 8 9 10
Intake (mg) ≥2300.0 2265.5 2225.0 2187.5 2150.0 2112.5 2075.0 2037.5 2000.0 1962.5 ≤1925.0
3.4.2. Added Sugar
In the case of added sugar, MDG 2010 quoted the Dietary Reference Intake (DRI)
committee of the Institute of Medicine (IOM) (2002) in setting the upper limit of sugar
intake which is 25% of TEI [49,57]. On the other hand, WHO recommends an intake of
free sugar for both adults and children to be less than 10% of TEI, and further reduction to
below 5% of TEI is suggested [58].
The recommendation on the limitation of added sugar consumption is based on the
suggestion of its association with obesity and dental caries [49,58]. Besides that, apart from
calories, added sugar contains no vitamins and minerals [49]. Thus, over consumption
of sugar could replace micronutrient-dense food from diet and lead to greater risk of
vitamin and mineral deficiency [49]. In terms of population intake, ANS 2017 showed
a tremendous increase in the median sugar intake among adolescents, i.e., from 29.53 g
in 2012 to 40.71 g in 2017. However, 57.2% of the adolescents were found to satisfy the
recommended consumption of free sugar to be less than 10% of TEI. On the other hand,
MANS 2014 recorded the mean intake of sugar of 25.52 g/day for Malaysian adults with
a prevalence of 55.9%. Based on NHMS 2019, 30.4% of adults in Malaysia were found
to be overweight while 19.7% were found to be obese, which increased from the survey
conducted in 2015 (30% overweight and 17.7% obese). The same case goes for the children
aged 5–17 years old, where 15% of them were found overweight while 14.8% were obese,
an increase of 2.9% compared to findings from NHMS 2015 (11.9% prevalence of obesity
among children).
Based on the recommendations, the survey reports on sugar intake among the popula-
tion and the prevalence of obesity among Malaysians, 25% of TEI is set as the threshold for
added sugar while the cut of value for the maximum score is set to be less than 5% of TEI.
Table 4 summarizes the added sugar intake for all scores point from 0 to 10.
Table 4. Summary of score correspond to Added Sugar intake (% of TEI).
Score 0 1 2 3 4 5 6 7 8 9 10
Intake (% of TEI) ≥25 23 21 19 17 15 13 11 9 7 ≤5
3.5. Standard for Scoring Optimal Components
For optimal component, zero will be assigned in two conditions. An individual will
get a score of zero if there is no intake of the component at all, or, if the intake is higher
than the threshold value. On the other hand, the maximum points will be given if the
intake is between the recommended intake range which is marked by lower and upper
cut-off values. The score between zero intake and the lower cut-off value is calculated
using Formula (1) while the score for intake between the upper cut-off value and the
threshold value is awarded proportionately as the calculation in Formula (2). Figure 3
illustrates the relationship between the intake of optimal component and the score for
better comprehension.Nutrients 2021, 13, 3474 8 of 12
Figure 3. Standard for scoring optimal components.
Total Fat (TF)
Total fat is put under optimal component since it is recommended to be consumed
within a specified range. Fat is important in the human diet as it helps in physiological and
structural function, growth and development (especially during infancy), the digestion
process and survival during limited food availability [49,50,53]. However, excess intake of
high fat diet coupled with low energy expenditure may lead to obesity [49]. In addition, a
rise in plasma triglyceride—an independent risk factor of atherogenesis—was also found
to be contributed by high fat loaded diet [59].
For total fat (TF), both the MDG 2010 and MDGCA 2013 recommended the limit on
daily intake to be less than 30% of TEI—which is in line with the recommendation of WHO
in avoiding unhealthy weight gain [49,50,60]. However, the lower limit for adults was set
at 20% TEI while the lower limit for children is 25% TEI. Revision on the limit by RNI 2017
raised the minimum recommended intake for adults from 20 to 25% TEI and introduced
35% TEI as an upper safe limit for an active adult [53]. In addition, RNI 2017 also proposed
25–35% TEI as the new range of children and teenagers’ total daily fat intake [53].
MANS 2014 reported the median total fat intake among Malaysian adults as 29%
TEI, which is aligned with the recommendations discussed previously [51]. However,
NHMS 2015 recorded that 17.7% of the Malaysian population were obese and 30% were
overweight which in total make almost half of the population [61]. Despite the unhealthy
trend in the population’s weight, the findings of NHMS 2015 do not support the conclusive
association between obesity and fat intake [53]. However, according to ANS 2017, the
prevalence of inadequate TF intake among adolescents sums up to 53.1% where 42.2% of
them were reported to have more than 35% TEI contributed by fat while the other 10.9%
had less than 25% TEI contributed by fat. The excess and deficiency in daily TF intake
among adolescents are something worrisome since these unhealthy habits might develop
into risk in the future—thus explaining the significance of the existence of TF as one of the
S-MHEI components.
The method of even distribution between the interval of crucial score (0, 5, 8 and 10)
will be used here. Considering the recommendations by MDG 2010, MDGCA 2013 and
RNI 2017, 20 and 35% TEI will both correspond to score of eight, which is the minimum
mark to show good TF intake, while 25 and 30% TEI will mark the lower and upper cut-off
values for maximum score of 10. Consequently, the threshold value for minimum score
will be set at 0 and 55% TEI. Even though it is nearly impossible to record a daily TF intake
of 0% TEI, it will be maintained in the scoring standard to emphasize the importance of
having optimal TF intake and at the same time capture any changes in TF deficiency. This
will allow the index to give a low score whenever the intake of TF is below the lower cut-off
value. The following Table 5 summarizes the TF intake for all scores point from 0 to 10.
Table 5. Summary of score corresponding to total fat intake (% of TEI).
Score 0 1 2 3 4 5 6 7 8 9 10
Intake (% ≥55.0 52.5 50.0 47.5 45.0 42.5 40.0 37.5 35.0 32.5 25.0–
of TEI) 0.0 2.5 5.0 7.5 10.0 12.5 15.0 17.5 20.0 22.5 30.0Nutrients 2021, 13, 3474 9 of 12
3.6. The New Standardized Malaysian Healthy Eating Index (S-MHEI)
The summary of the new standardized Malaysian Healthy Eating Index as a whole is
described in Table 6 as follows.
Table 6. The new standardized Malaysian Healthy Eating Index (S-MHEI).
No Component Type Max Score Criteria for Min Score (0) Criteria for Max Score
1 Total grains A 5 0 servings/1000 kcal 1.4 servings/1000 kcal
2 Whole grains A 5 0 servings/1000 kcal 0.7 servings/1000 kcal
3 Fruits A 10 0 servings/1000 kcal 0.9 servings/1000 kcal
4 Vegetables A 10 0 servings/1000 kcal 1.2 servings/1000 kcal
5 Fish A 10 0 servings/1000 kcal 0.4 servings/1000 kcal
6 Meat, poultry and eggs A 10 0 servings/1000 kcal 0.4 servings/1000 kcal
7 Legumes and nuts A 10 0 servings/1000 kcal 0.4 servings/1000 kcal
8 Milk and milk products A 10 0 servings/1000 kcal 0.9 servings/1000 kcal
9 Total Fat O 10 0 or ≥55% of TEI 25–30% of TEI
10 Added Sugar M 10 ≥25% of TEI ≤5% of TEI
11 Sodium M 10 ≥2300 mg ≤1925.0 mg
3.7. Strengths and Limitations of S-MHEI
In general, HEI is a simple diet quality measuring tool which is easy to apply and
has a straightforward explanation compared to other similar tools. In terms of this new
standardized MHEI, almost all components of the existing diet quality indices were re-
tained. In addition to that, whole grain and added sugar were introduced to address
the suboptimal intake within the population and the current necessities in terms of the
prevalence of diet-related diseases, apart from highlighting the recommendations included
in the MDG 2010 which were not brought forward before.
Furthermore, in setting the scoring criteria, the density standard was used instead
of the serving-base standard in order to widen the use of the index to all levels of energy
requirements rather than just for adults. Besides that, the least restrictive (easiest to achieve)
of the recommended amounts of food to consume was chosen in determining the threshold
and cut-off value for minimum and maximum score so that this new index can be more
specific in identifying intakes that do not meet the recommendation rather than being
sensitive towards adhering to the recommended intake. As a result, this index will identify
some but not all intakes that do not meet individual recommendations. However, all the
errors will be in the same direction and the index will separate between diet quality from
diet quantity.
Despite the concern on the excess intake of saturated fat (SF) on health, TF was
chosen over SF to be one of the components due to limitations in terms of the SF database
and assessment method. However, whenever the complete database is available and
the assessment method is well developed, this index shall be revised and SF is highly
recommended to be included as one of moderation components.
It is also important to note that this index is not suitable for children younger than age
two, pregnant women and diseased individuals due to their special dietary requirements
such as breast milk, additional supplements, etc. Thus, for these groups, another specific
HEI can be developed.
4. Conclusions
The new developed S-MHEI assess the diet quality in terms of conformity to the
dietary guidelines specified for the Malaysian children, adolescents and adults’ needs. The
assessment is focused on the food and beverages consumption and nutrients gained fromNutrients 2021, 13, 3474 10 of 12
them as it emphasizes balance among food groups rather than the quantity consumed. This
can be seen from the same maximum score assigned for all food groups. In effect, the index
highlighted the food group to encourage and to reduce. This feature is also important as it
accommodates the variety of eating patterns in Malaysian multiracial culture. The least
restrictive approach employed by this index ensures that the criteria for maximum score
are the easiest to achieve despite the difference in age and sex which is the main difference
of the index with the existing ones.
Author Contributions: Conceptualization, M.J., S.M.E. and R.R.; formal analysis, M.J. and S.M.E.;
funding acquisition, S.M.E.; methodology, M.J., S.M.E. and R.R.; supervision, S.M.E. and R.R.;
writing—original draft, M.J.; writing—review and editing, S.M.E. and R.R. All authors have read and
agreed to the published version of the manuscript.
Funding: This research was funded by the Ministry of Higher Education, Malaysia under the
Fundamental Research Grant Scheme (grant number: FRGS/1/2018/SS08/USIM/02/6).
Institutional Review Board Statement: Not applicable.
Informed Consent Statement: Not applicable.
Data Availability Statement: Data available on request. The data presented in this study are
available on request from the corresponding author.
Conflicts of Interest: The authors declare no conflict of interest.
References
1. Kennedy, E.T.; Ohls, J.; Carlson, S.; Fleming, K. The Healthy Eating Index: Design and application. J. Am. Diet. Assoc. 1995, 95,
1103–1108. [CrossRef]
2. Guenther, P.M.; Reedy, J.; Krebs-Smith, S.M. Development of the Healthy Eating Index-2005. J. Am. Diet. Assoc. 2008, 108,
1896–1901. [CrossRef]
3. Taechangam, S.; Pinitchun, U.; Pachotikarn, C. Development of nutrition education tool: Healthy Eating Index in Thailand. Asia
Pac. J. Clin. Nutr. 2008, 17 (Suppl. S1), 365–367.
4. Woodruff, S.J.; Hanning, R.M. Development and implications of a revised Canadian Healthy Eating Index (HEIC-2009). Public
Health Nutr. 2010, 13, 820–825. [CrossRef]
5. Previdelli, Á.N.; Andrade, S.C.; Pires, M.M.; Ferreira, S.R.; Fisberg, R.M.; Marchioni, D.M. A revised version of the Healthy Eating
Index for the Brazilian population. Revista de Saúde Pública 2011, 45, 794–798. [CrossRef]
6. Van Lee, L.; Geelen, A.; van Huysduynen, E.J.; de Vries, J.H.; van’t Veer, P.; Feskens, E.J. The Dutch Healthy Diet index (DHD-index):
An instrument to measure adherence to the Dutch Guidelines for a Healthy Diet. Nutr. J. 2012, 11, 1–9. [CrossRef] [PubMed]
7. Guenther, P.M.; Casavale, K.O.; Reedy, J.; Kirkpatrick, S.I.; Hiza, H.A.B.; Kuczynski, K.J.; Krebs-Smith, S.M. Update of the Healthy
Eating Index: HEI-2010. J. Acad. Nutr. Diet. 2013, 113, 569–580. [CrossRef] [PubMed]
8. Kyttälä, P.; Erkkola, M.; Lehtinen-Jacks, S.; Ovaskainen, M.L.; Uusitalo, L.; Veijola, R.; Simell, O.; Knip, M.; Virtanen, S.M. Finnish
Children Healthy Eating Index (FCHEI) and its associations with family and child characteristics in pre-school children. Public
Health Nutr. 2014, 17, 2519–2527. [CrossRef]
9. Yook, S.M.; Park, S.; Moon, H.K.; Kim, K.; Shim, J.E.; Hwang, J.Y. Development of Korean Healthy Eating Index for adults using
the Korea National Health and Nutrition Examination Survey data. J. Nutr. Health 2015, 48, 419–428. [CrossRef]
10. Roy, R.; Hebden, L.; Rangan, A.; Allman-Farinelli, M. The development, application, and validation of a Healthy Eating Index for
Australian adults (HEIFA—2013). Nutrition 2016, 32, 432–440. [CrossRef]
11. Yuan, Y.Q.; Li, F.; Dong, R.H.; Chen, J.S.; He, G.S.; Li, S.G.; Chen, B. The development of a Chinese Healthy Eating Index and its
application in the general population. Nutrients 2017, 9, 977. [CrossRef] [PubMed]
12. Looman, M.; Feskens, E.J.; de Rijk, M.; Meijboom, S.; Biesbroek, S.; Temme, E.H.; de Vries, J.; Geelen, A. Development and
evaluation of the Dutch Healthy Diet index 2015. Public Health Nutr. 2017, 20, 2289–2299. [CrossRef]
13. Krebs-Smith, S.M.; Pannucci, T.E.; Subar, A.F.; Kirkpatrick, S.I.; Lerman, J.L.; Tooze, J.A.; Reedy, J. Update of the Healthy Eating
Index: HEI-2015. J. Acad. Nutr. Diet. 2018, 118, 1591–1602. [CrossRef]
14. Hann, C.S.; Rock, C.L.; King, I.; Drewnowski, A. Validation of the Healthy Eating Index with use of plasma biomarkers in a
clinical sample of women. Am. J. Clin. Nutr. 2001, 74, 479–486. [CrossRef]
15. Fisberg, R.M.; Slater, B.; Barros, R.R.; Lima, F.D.; Cesar, C.L.; Carandina, L.; Barros, M.B.; Goldbaum, M. Healthy Eating Index:
Evaluation of adapted version and its applicability. Rev. Nutr. 2004, 17, 301–318. [CrossRef]
16. Guenther, P.M.; Reedy, J.; Krebs-Smith, S.M.; Reeve, B.B. Evaluation of the Healthy Eating Index-2005. J. Am. Diet. Assoc. 2008,
108, 1854–1864. [CrossRef] [PubMed]
17. Andrade, S.C.; Previdelli, A.N.; Marchioni, D.M.; Fisberg, R.M. Evaluation of the reliability and validity of the Brazilian Healthy
Eating Index Revised. Revista de Saúde Pública 2013, 47, 675–683. [CrossRef] [PubMed]Nutrients 2021, 13, 3474 11 of 12
18. Guenther, P.M.; Kirkpatrick, S.I.; Reedy, J.; Krebs-Smith, S.M.; Buckman, D.W.; Dodd, K.W.; Casavale, K.O.; Carroll, R.J. The
Healthy Eating Index-2010 is a valid and reliable measure of diet quality according to the 2010 Dietary Guidelines for Americans.
J. Nutr. 2014, 144, 399–407. [CrossRef] [PubMed]
19. Yuan, Y.Q.; Li, F.; Wu, H.; Wang, Y.C.; Chen, J.S.; He, G.S.; Li, S.G.; Chen, B. Evaluation of the validity and reliability of the
Chinese Healthy Eating Index. Nutrients 2018, 10, 114. [CrossRef]
20. Toffano, R.B.; Hillesheim, E.; Mathias, M.G.; Coelho-Landell, C.A.; Salomão, R.G.; Almada, M.O.; Camarneiro, J.M.; Barros, T.T.;
Camelo-Junior, J.S.; Rezzi, S.; et al. Validation of the Brazilian Healthy Eating Index-Revised using biomarkers in children and
adolescents. Nutrients 2018, 10, 154. [CrossRef]
21. Reedy, J.; Lerman, J.L.; Krebs-Smith, S.M.; Kirkpatrick, S.I.; Pannucci, T.E.; Wilson, M.M.; Subar, A.F.; Kahle, L.L.; Tooze, J.A.
Evaluation of the Healthy Eating Index-2015. J. Acad. Nutr. Diet. 2018, 118, 1622–1633. [CrossRef]
22. Panizza, C.E.; Shvetsov, Y.B.; Harmon, B.E.; Wilkens, L.R.; Le Marchand, L.; Haiman, C.; Reedy, J.; Boushey, C.J. Testing the
predictive validity of the Healthy Eating Index-2015 in the Multiethnic Cohort: Is the score associated with a reduced risk of
all-cause and cause-specific mortality? Nutrients 2018, 10, 452. [CrossRef]
23. Schap, T.R.; Kuczynski, K.; Hiza, H. Healthy Eating Index—Beyond the score. J. Acad. Nutr. Diet. 2017, 117, 519–521. [CrossRef] [PubMed]
24. Guo, X.; Warden, B.A.; Paeratakul, S.; Bray, G.A. Healthy Eating Index and obesity. Eur. J. Clin. Nutr. 2004, 58, 1580–1586.
[CrossRef] [PubMed]
25. Drewnowski, A.; Fiddler, E.C.; Dauchet, L.; Galan, P.; Hercberg, S. Diet quality measures and cardiovascular risk factors in France:
Applying the Healthy Eating Index to the SU. VI. MAX study. J. Am. Coll. Nutr. 2009, 28, 22–29. [CrossRef] [PubMed]
26. Tande, D.L.; Magel, R.; Strand, B.N. Healthy Eating Index and abdominal obesity. Public Health Nutr. 2010, 13, 208–214. [CrossRef]
27. Chandran, U.; Bandera, E.V.; Williams-King, M.G.; Paddock, L.E.; Rodriguez-Rodriguez, L.; Lu, S.E.; Faulkner, S.; Pulick, K.;
Olson, S.H. Healthy Eating Index and ovarian cancer risk. Cancer Causes Control. 2011, 22, 563–571. [CrossRef]
28. Pick, M.E.; Edwards, M.; Moreau, D.; Ryan, E.A. Assessment of diet quality in pregnant women using the Healthy Eating Index.
J. Am. Diet. Assoc. 2005, 105, 240–246. [CrossRef]
29. Manios, Y.; Kourlaba, G.; Kondaki, K.; Grammatikaki, E.; Birbilis, M.; Oikonomou, E.; Roma-Giannikou, E. Diet quality of
preschoolers in Greece based on the Healthy Eating Index: The GENESIS study. J. Am. Diet. Assoc. 2009, 109, 616–623. [CrossRef]
30. Savoca, M.R.; Arcury, T.A.; Leng, X.; Bell, R.A.; Chen, H.; Anderson, A.; Kohrman, T.; Quandt, S.A. The diet quality of
rural older adults in the South as measured by Healthy Eating Index-2005 varies by ethnicity. J. Am. Diet. Assoc. 2009, 109,
2063–2067. [CrossRef]
31. Han, C.Y.; Colega, M.; Quah, E.P.; Chan, Y.H.; Godfrey, K.M.; Kwek, K.; Saw, S.M.; Gluckman, P.D.; Chong, Y.S.; Chong, M.F.
A Healthy Eating Index to measure diet quality in pregnant women in Singapore: A cross-sectional study. BMC Nutr. 2015, 1,
1–11. [CrossRef]
32. Gao, Z.; Yu, X.; Lee, J.Y. Consumer demand for diet quality: Evidence from the Healthy Eating Index. Aust. J. Agric. Resour. Econ.
2013, 57, 301–319. [CrossRef]
33. Lutz, L.J.; Gaffney-Stomberg, E.; Scisco, J.L.; Cable, S.J.; Philip Karl, J.; Young, A.J.; McClung, J.P. Assessment of dietary intake
using the Healthy Eating Index during military training. US Army Med. Dep. J. 2013, 1, 91–96.
34. Berube, L.T.; Kiely, M.; Yazici, Y.; Woolf, K. Diet quality of individuals with rheumatoid arthritis using the Healthy Eating Index
(HEI)-2010. Nutr. Health 2017, 23, 17–24. [CrossRef] [PubMed]
35. Wolfson, J.A.; Leung, C.W.; Richardson, C.R. More frequent cooking at home is associated with higher Healthy Eating Index-2015
score. Public Health Nutr. 2020, 23, 2384–2394. [CrossRef]
36. Kirkpatrick, S.I.; Reedy, J.; Krebs-Smith, S.M.; Pannucci, T.E.; Subar, A.F.; Wilson, M.M.; Lerman, J.L.; Tooze, J.A. Applications of
the Healthy Eating Index for surveillance, epidemiology, and intervention research: Considerations and caveats. J. Acad. Nutr.
Diet. 2018, 118, 1603–1621. [CrossRef] [PubMed]
37. Ervin, R.B. Healthy Eating Index scores among adults, 60 years of age and over, by sociodemographic and health characteristics:
United States, 1999–2002. Adv. Data 2008, 395, 1–16.
38. Rehm, C.D.; Monsivais, P.; Drewnowski, A. Relation between diet cost and Healthy Eating Index 2010 scores among adults in the
United States 2007–2010. Prev. Med. 2015, 73, 70–75. [CrossRef] [PubMed]
39. Grech, A.; Sui, Z.; Siu, H.Y.; Zheng, M.; Allman-Farinelli, M.; Rangan, A. Socio-demographic determinants of diet quality in
Australian adults using the validated Healthy Eating Index for Australian Adults (HEIFA-2013). Healthcare 2017, 5, 7. [CrossRef]
40. Lee, T.T.; Norimah, A.K.; Safiah, M.Y. Development of Healthy Eating Index (HEI) for Malaysian Adults. In Proceedings of the
26th Scientific Conference of the Nutrition Society of Malaysia, Kuala Lumpur, Malaysia, 24–25 March 2011.
41. Teng, N.I.M.F.; Shahar, S.; Manaf, Z.A.; Haron, H.; Ngah, W.Z.W. Fasting calorie restriction improved the quality of dietary intake
among aging men in Klang Valley, Malaysia. Pak. J. Nutr. 2013, 12, 607–614. [CrossRef]
42. Fokeena, W.B.; Jamaluddin, R.; Khaza’ai, H. Development and assessment of the reliability and validity of a diet quality index in
a sample of Malaysian university students. J. Food Nutr Res. 2016, 4, 251–257.
43. Waijers, P.M.; Feskens, E.J.; Ocké, M.C. A critical review of predefined diet quality scores. Br. J. Nutr. 2007, 97, 219–231. [CrossRef]
44. Karupaiah, T.; Swee, W.C.S.; Liew, S.Y.; Ng, B.K.; Chinna, K. Dietary health behaviors of women living in high rise dwellings: A
case study of an urban community in Malaysia. J. Community Health 2013, 38, 163–171. [CrossRef]
45. Pei, C.S.; Appannah, G.; Sulaiman, N. Household food insecurity, diet quality, and weight status among indigenous women (Mah
Meri) in Peninsular Malaysia. Nutr. Res. Pract. 2018, 12, 135–142. [CrossRef]Nutrients 2021, 13, 3474 12 of 12
46. Chong, S.P.; Appannah, G.; Sulaiman, N. Predictors of diet quality as measured by Malaysian Healthy Eating Index among
aboriginal women (Mah Meri) in Malaysia. Nutrients 2019, 11, 135. [CrossRef]
47. Khalib, M.K.N.; Manaf, Z.A.; Shahar, S.; Ludin, A.F.M. Delivery of healthy lunch to worksites: A two-week pilot study in a
sample of working adults in Selangor, Malaysia. Mal. J. Nutr. 2018, 24, 575–585.
48. Pondor, I.; Gan, W.Y.; Appannah, G. Higher dietary cost is associated with higher diet quality: A cross-sectional study among
selected malaysian adults. Nutrients 2017, 9, 1028. [CrossRef] [PubMed]
49. National Coordinating Committee of Food and Nutrition. Malaysian Dietary Guidelines; Technical Working Group on Nutritional
Guidelines (for National Coordinating Committee of Food and Nutrition): Putrajaya, Malaysia, 2010.
50. National Coordinating Committee of Food and Nutrition. Malaysian Dietary Guidelines for Children and Adolescents; Technical Work-
ing Group on Nutritional Guidelines (for National Coordinating Committee of Food and Nutrition): Putrajaya, Malaysia, 2013.
51. Institute for Public Health. National Health and Morbidity Survey 2014: Malaysian Adult Nutrition Survey (MANS) Vol. II: Survey
Findings; Institute for Public Health Ministry of Health Malaysia: Kuala Lumpur, Malaysia, 2014.
52. Institute for Public Health. National Health and Morbidity Survey (NHMS) 2017: Adolescent Nutrition Survey 2017; Institute for
Public Health Ministry of Health Malaysia: Kuala Lumpur, Malaysia, 2017.
53. National Coordinating Committee on Food and Nutrition. Recommended Nutrient Intakes for Malaysia; Technical Working Group
on Nutritional Guidelines: Putrajaya, Malaysia, 2017.
54. Basiotis, P.; Carlson, A.; Gerrior, S.; Juan, W.; Lino, M. The Healthy Eating Index, 1999–2000: Charting dietary patterns of
Americans. Fam. Econ. Nutr. Rev. 2004, 16, 39–49.
55. WHO. Guideline: Sodium Intake for Adults and Children; World Health Organization: Geneva, Switzerland, 2012.
56. WHO. Global Action Plan for the Prevention and Control of Noncommunicable Diseases 2013–2020; World Health Organization: Geneva,
Switzerland, 2013.
57. Rippe, J.M.; Sievenpiper, J.L.; Lê, K.A.; White, J.S.; Clemens, R.; Angelopoulos, T.J. What is the appropriate upper limit for added
sugars consumption? Nutr. Rev. 2017, 75, 18–36. [CrossRef]
58. WHO. Guideline: Sugar Intake for Adults and Children; World Health Organization: Geneva, Switzerland, 2015.
59. Patsch, J.R.; Miesenböck, G.; Hopferwieser, T.; Mühlberger, V.; Knapp, E.; Dunn, J.K.; Gotto, A.M., Jr.; Patsch, W. Relation of
triglyceride metabolism and coronary artery disease: Studies in the postprandial state. Arterioscler. Thromb 1992, 12, 1336–1345.
[CrossRef] [PubMed]
60. Healthy Diet. Available online: www.who.int/news-room/fact-sheets/detail/healthy-diet (accessed on 15 June 2021).
61. Institute for Public Health. National Health and Morbidity Survey 2015 (NHMS 2015). Vol. II: Non-Communicable Diseases, Risk
Factors & Other Health Problems; Institute for Public Health Ministry of Health Malaysia: Kuala Lumpur, Malaysia, 2015.You can also read