The Information Content of Trump Tweets and the Currency Market
←
→
Page content transcription
If your browser does not render page correctly, please read the page content below
The Information Content of Trump Tweets and
                             the Currency Market

  ILIAS FILIPPOU         ARIE E. GOZLUKLU          MY T. NGUYEN          GANESH VISWANATH-NATRAJ

                                     This version: October 4, 2021

                                                 Abstract

       Using textual analysis, we identify the set of Trump tweets that contain information on
       macroeconomic policy, trade, or exchange rate content. We find that informative Trump
       tweets reduce speculative trading in foreign exchange markets, with a corresponding
       decline in trading volume, volatility, bid-ask spreads, and induce a positive bias in
       returns reflecting Trump’s (optimistic) views on the U.S. economy. Two-thirds of his
       informative tweets are optimistic. This bias serves as a diversion strategy from negative
       media coverage. We rationalize these results within a model of Trump tweets revealing
       economic content as a public signal that reduces disagreement among speculators.

    Acknowledgements: Filippou: John M. Olin Business School, Washington University in St. Louis,
USA. Email: iliasfilippou@wustl.edu; Gozluklu: The University of Warwick, Warwick Business School, UK.
Email: Arie.Gozluklu@wbs.ac.uk; Nguyen: The University of Warwick, Warwick Business School, UK. Email:
phd17mn@mail.wbs.ac.uk; Viswanath-Natraj: The University of Warwick, Warwick Business School, UK.
Email: Ganesh.Viswanath-Natraj@wbs.ac.uk. For detailed comments, we would like to thank Jesùs Gorrin,
Roman Kozhan, Philippe Mueller, Maria Sole Pagliari (discussant), Richard Taffler, Gyuri Venter, Simon Zorka
and seminar participants at the Warwick Business School Finance Brownbag and the French Finance (AFFI)
Conference.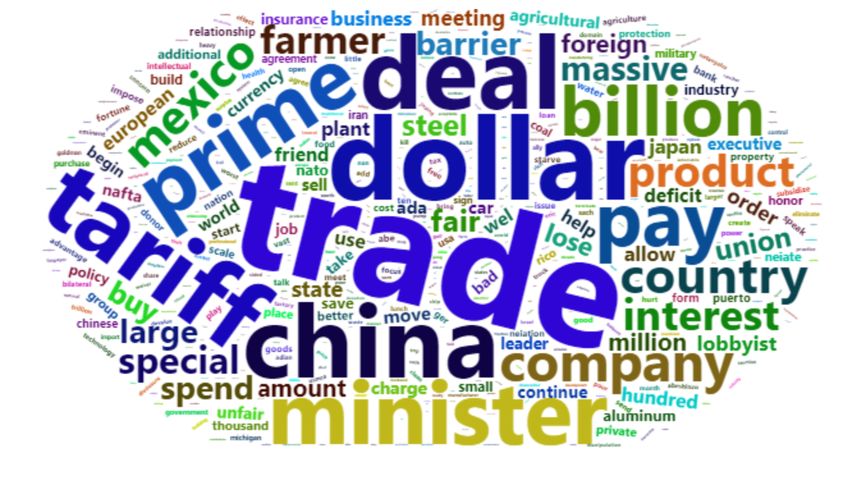
1        Introduction
Since Donald J. Trump started his U.S. presidential campaign in June 2015, he has exten-
sively used Twitter as a means of communication to the public. Although he is not the first
U.S. president to be active on social media, his personal Twitter account attracts enormous
attention at an unprecedented level due to various aspects, such as the frequency, content,
and language of his tweets.1 The figure of more than 77.5 million followers (as of April
2020) has shown how much attention the public is paying to the views shared by the U.S.
45 th President. Although the information content of these tweets is a matter of dispute, a
growing area of research is identifying the effects of his tweets on financial markets.2 For
example, research by Bank of America suggests that days with more than 35 Trump tweets
see negative returns of the Dow Index. The JPMorgan ’Volfefe’ index, on the other hand,
tracks how Trump tweets move the bond markets. In contrast, this paper focuses on the
information content of Trump tweets related to the macroeconomic outlook and trade on
the foreign exchange (FX) market, which is the most traded financial market worldwide
(BIS, 2019).3
        Trump tweets provide a novel experiment to study the effects of an unexpected public
signal on trading, volatility and returns in the currency market. Exchange rates in principle
aggregate macroeconomic information on future fundamentals of a country, yet the link
between economic fundamentals and foreign exchange markets is difficult to connect in a
high-frequency environment. To shed light on the effects of Trump tweets on exchange rates,
we use textual analysis to filter the set of Trump tweets that contain information on future
macroeconomic fundamentals relevant for FX market participants. This includes tweets on
trade, such as tariffs with China or Mexico, tweets on U.S. employment figures, or tweets
influencing the financial market perceptions of interest rates (e.g., Bianchi, Kung, and Kind,
2019). In a market with heterogeneous private information in spot rate expectations, a
common public signal can reduce investor disagreement in the FX market (e.g., Ranaldo
and Santucci de Magistris, 2019; Kruger, 2020). We hypothesize Trump tweets cause a
reduction in investor disagreement, and in turn, a decline in FX volume, volatility and bid-
ask spreads. Spot returns during Trump tweet hours reflect an (optimistic) bias regarding
the future macroeconomic fundamentals of the U.S. and foreign economies.
   1
     His Twitter account has been permanently suspended in January 2021 because of his tweets after the
U.S. Capitol attack.
    2
        https://www.washingtonpost.com/technology/2020/05/26/trump-twitter-label-fact-check/
    3
        https://www.bis.org/statistics/rpfx19_fx.pdf

                                                    1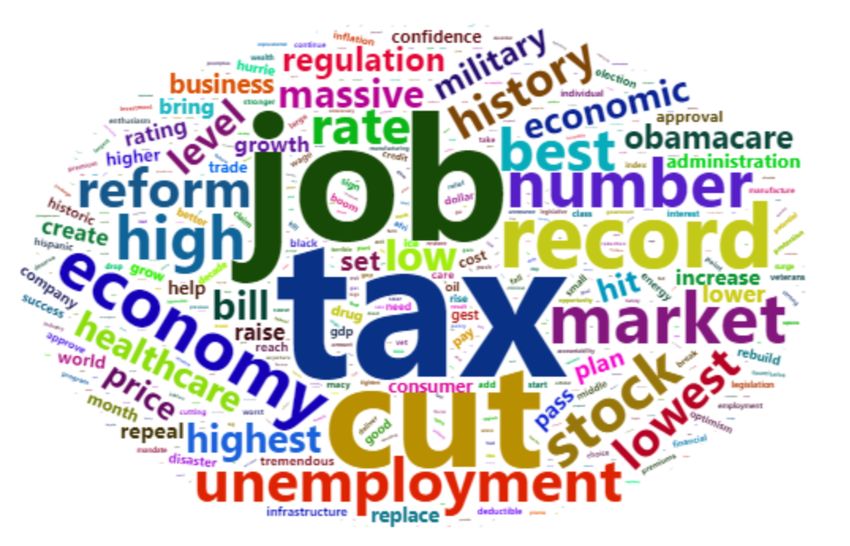
We next investigate whether Trump chooses to reveal information content about macro
economy and trade randomly or his public signals have an ulterior motive to distract the
media from negative press. In particular, we test the media diversion hypothesis using
media coverage about Trump’s Mueller investigation (Lewandowsky, Jetter, and Ecker,
2020) and its link to the optimistic bias about the future state of the U.S. economy.
   To explain the mechanism, we start with a model of heterogeneous private information
and Trump tweets as a public signal in the FX market. The market is populated by a set
of speculators, each with their own private signal on the valuation of the future spot rate.
Investors then update their private signal based on the Trump tweet, which we assume is
known to all traders. There are two distinct types of speculators in the model: (rational)
Bayesian investors who update their prior based on the information content of the Trump
tweet, and (irrational) Trump followers who fully adopt the Trump tweet. Our analysis
generates three predictions. First, as investors trade on a common signal, there is a decline
in the dispersion of investor beliefs on valuations of the future spot rate. We show that a
rise in the share of Trump followers leads to a decline in investor disagreement, and in turn
a decline in the volume of trading in the currency market. Second, the Trump tweet leads
to a decline in exchange rate volatility if the tweet is more informative than the private
signal. If speculators rely on the public information via informative Trump tweets over
their private signals, the corresponding reduction in asymmetric information leads to a
reduction in bid-ask spreads. Finally, we show that Trump tweets induce a bias in spot
returns reflecting differences between the (optimistic) views of Trump and the speculators
on the future valuation of macroeconomic fundamentals.
   Turning to the data, we first conduct a textual analysis on Trump tweets to identify
the information content related to the macroeconomic outlook, trade and international
developments that are impounded in exchange rates. Our sample period is from 16th
June 2015, the starting date of Trump’s presidential campaign, to 20th August 2019. We
implement two methods to identify Macro and Trade tweets. The first approach follows
keywords by topics outlined in Baker, Bloom, Davis, and Kost (2019). Second, we use
the topic modelling approach developed by Yan, Guo, Lan, and Cheng (2013) to filter
out tweets about macroeconomics outlook, trade policy, and exchange rate topics. This
approach is suitable for an analysis of short texts and hence ideal for the analysis of tweets.
To our knowledge, we are the first paper to use this approach in the finance literature.
   We proceed to link Trump tweets to outcomes in the FX market, and construct our
measures of FX market activity. For FX volume, we use CLS, a real time gross settlement
system which is the largest available dataset on trading volume across a wide range of

                                              2
market participants, e.g., banks, funds and corporations, for up to 16 bilateral pairs at an
hourly frequency (e.g., Hasbrouck and Levich, 2019). We combine our hourly volume data
with currency spot rates from Thomson Reuters Tick History. In addition, we have data on
bid-ask quotes for a series of banks, and construct intraday measures of volatility based on
high frequency changes in the spot rate.
   Our main empirical results test a panel specification with the outcome variables of FX
volume, volatility, bid-ask spreads and spot returns. Explanatory variables include an hourly
dummy for a macro or trade tweet, and controls for hour-of-day, day-of-week, scheduled
monetary announcements, fundamentals in financial markets such as the VIX index. We
find statistical evidence that Tweet hours are associated with a decrease in FX trading
volume. This result holds for all groups in our sample, with the biggest decline observed for
banks, non-bank financial institutions and funds. Second, we find declines in our measure
of intraday FX spot volatility and bid-ask spreads around Trump tweet hours, indicative of
a reduction in investor disagreement during tweet hours. Third, we identify systematic
effects of Trump tweets on FX spot returns. The dollar tends on average to appreciate with
respect to major bilateral pairs during Trump tweet hours. We find significant cumulative
returns in the hour following the tweet for an equal weighted average return of all 16
bilateral pairs, as well as a USD ETF index. This appreciation is consistent with the nature
of Trump tweets, that reflect typically his positive views on the U.S. economy (relative to
other countries), and trigger a protectionist stance on trade policies. We show that Trump
tweets are more likely to be informative following the hours with news about Mueller
investigation. Importantly, only positive tweets (optimistic bias about the U.S. economy)
are a reaction to the negative press coverage in the previous hour.
   In robustness exercises, we show that the results hold when controlling for a set of
macroeconomic releases that occur on the day of the tweet. This rules out an alternative
view that the effects of Trump tweets are due to the reaction of news that occurred earlier
in the day. We also provide a placebo test to show that Trump tweets in the set of non-
macro/trade topics do not have significant effects on FX markets. Finally, we test the
proposed mechanism through which Trump tweets cause a decline in trading volume
and volatility. In a FX market populated by speculators with heterogeneous information,
Trump tweets result in a reduction in investor disagreement. We test this mechanism by
constructing a proxy for FX disagreement from options data. We hypothesize that during
Trump tweet hours, the common signal reduces the dispersion in the future valuation of
exchange rate fundamentals, and therefore reduces the measure of disagreement based on

                                             3
the options pricing.4 In line with our hypothesis, we find a statistically significant reduction
in our measured proxy for investor disagreement during Trump tweet hours.
        The rest of the paper is structured as follows. Section 2 summarizes related literature.
Section 3 introduces a model with our theoretical predictions on the effects of Trump tweets
on FX volume, volatility and returns. Section 4 outlines the data. Section 5 discusses our
empirical findings. Section 6 concludes.

2        Related Literature
The paper contributes to a growing literature on studying the effects of Twitter content
on financial markets. Focusing on the stock market, studies examine the relationship
between Twitter sentiment and the stock market returns and volatility of stock indices
(Bollen, Mao, and Zeng, 2011; Mittal and Goel, 2012; Behrendt and Schmidt, 2018), the
effects of company-specific tweets (e.g., Sprenger, Tumasjan, Sandner, and Welpe 2014,
Bartov, Faurel, and Mohanram 2018), and the impact of twitter sentiment around FOMC
announcements on stock returns (Azar and Lo, 2016). Focusing on the currency market,
Gholampour and Van Wincoop (2017) examine investor tweets regarding the Euro/dollar
exchange rate and classify them into positive, negative, and neutral opinions. They create
a trading strategy based on this sentiment and find that the Sharpe ratio of this strategy
outperforms that of carry trade.5
        Turning to Trump tweets, there are a number of recent papers on studying the effects of
Trump tweets on the stock market, interest rate futures and the currency market. The effects
of Trump tweets on publicly traded firm stock returns and volatility (e.g., Ge, Kurov, and
Wolfe, 2018; Born, Myers, and Clark, 2017; Ajjoub, Walker, and Zhao, 2019; Juma’h and
Alnsour, 2018; Colonescu et al., 2018; Abdi, Kormanyos, Pelizzon, Getmansky Sherman,
and Simon, 2021; Scharnowski, 2021), tweets on threatening central bank independence
signalling a lower future path of the Federal Funds rate (Bianchi et al., 2019), and tweets
with a negative stance on Mexico-U.S. trade on the Peso/Dollar exchange rate (Benton and
Philips, 2018), tweets on the China-US trade dispute (Ferrari, Kurcz, and Pagliari, 2021),
and the role of tweets on macroeconomic policies to divert attention from media articles on
    4
     The measure of options disagreement we use is the absolute value of the moneyness ratio based on
Salomé (2020). The metric is intuitively measuring the difference between the strike and current spot price
after controlling for volatility and time to expiry.
   5
     In related work, Filippou, Gozluklu, Nguyen, and Taylor (2020) construct a measure of U.S. populist
rhetoric –using a broad set of newspapers– and find that currencies which perform well (badly) when U.S.
populist rhetoric is high offer low (high) currency excess returns. In addition, Filippou, Taylor, and Wang
(2020) show that FX news sentiment is a strong negative predictor of the cross-section of currency returns.

                                                    4
the Mueller report (Lewandowsky et al., 2020). Abdi et al. (2021) conduct a textual analysis
of Trump tweets and investigate whether Trump tweets contain information relevant for
stock prices. The authors find evidence that Trump tweets are responding to information
earlier in the day, and information effects for a subset of Trump tweets on the NAFTA trade
agreement and the US China trade war, which is consistent with our hypothesis that Trump
tweets with macroeconomic and trade content are more informative. Benton and Philips
(2018) and Ferrari et al. (2021) find that Trump tweets on Mexico-U.S. trade relations
and China-US Trade tensions cause an appreciation of the U.S. dollar. Our results extend
their analysis by conducting a textual analysis to identify the macroeconomic and trade
content of Trump tweets. This will include tweets on how the Federal Reserve should set
interest rates, trade tensions with Korea, the Middle East and Mexico. Second, we examine
the effects of informative trading on a number of metrics measuring returns and liquidity
for a larger wide basket of currencies. Third, through a model, we illustrate how Trump
tweets can affect spot returns due to differences in expectations of future exchange rate
fundamentals between Trump and investors.
   The second major literature our paper relates to is on the microstructure of currency
markets. Information asymmetry in currency markets have typically been studied by signing
trades in inter-dealer and dealer-customer markets through order flow (e.g., Evans and
Lyons, 2002; Ranaldo and Somogyi, 2021). More recently, a number of papers have
examined the information content of FX trading volume using CLS data (e.g., Fischer
and Ranaldo, 2011; Hasbrouck and Levich, 2019; Cespa, Gargano, Riddiough, and Sarno,
2021). On the theory side, our paper speaks to microstructural models of the FX spot
market that connect trading and volatility through a set of informed and "noise" traders,
with heterogeneous information on the fundamentals of the exchange rate (e.g., Jeanne
and Rose, 2002; Bacchetta and Van Wincoop, 2006; Gholampour and Van Wincoop, 2017).
We adapt the model framework to include a discussion of the introduction of a public signal,
the Trump tweet, on spot volume and volatility. Traders are differentiated in how they
update their signal based on the Trump tweet, with two sets of agents, rational Bayesian
agents, and irrational Trump followers, that have differing weights on private and public
information.
   Finally, we make a connection between FX market microstructure and the literature on
investor disagreement in financial markets. The theory of investor disagreement assumes
that investors have heterogeneous priors on the payoff of the asset (Hong and Stein, 2007).
Differences in investor information sets translate to disagreement on the future payoff, and
can induce trading and increase volatility, a finding consistent with studies in both stock

                                             5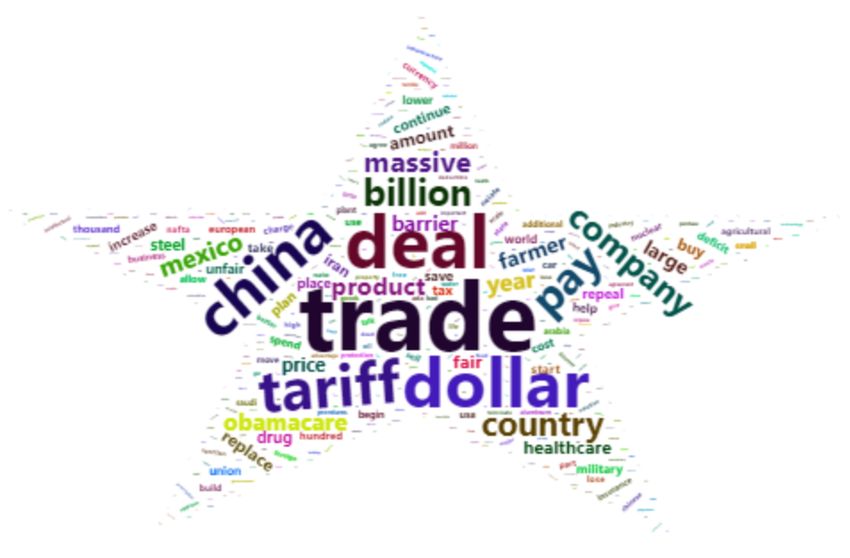
and currency markets (e.g., Ranaldo and Santucci de Magistris, 2019; Kruger, 2020). On
this front, our paper is closely related to Ranaldo and Santucci de Magistris (2019), which
also has a model of FX trading and heterogeneous information, and use an unexpected
monetary policy event of the Swiss National Bank in 2015 to show how increased investor
disagreement translated to increases in volume and volatility. We find complementary
evidence in our paper through an alternative event: using the information content of Trump
tweets. We hypothesize that Trump tweets cause a reduction in investor disagreement,
which in turn leads to less trading, lower volatility, and reduced asymmetric information
through lower bid ask spreads.

3         Model
We derive a simple model of trading in the FX market with public information. Each
investor has a prior of the exchange rate in one period from now. These traders follow
a similar functional form to informed traders in information models of the exchange
(Jeanne and Rose, 2002; Bacchetta and Van Wincoop, 2006; Gholampour and Van Wincoop,
2017). A public signal, the Trump tweet, is a common signal interpreted by all speculative
traders. A rational Bayesian agent combines their prior with the public signal. The posterior
distribution of the Bayesian agent’s signal is a weighted average of the public and private
information, with the weights a function of the relative precision of each signal. In addition
to Bayesian agents, a fraction of traders are characterized as Trump followers, and update
their prior to put a weight of one on the public signal. Using this setting, we examine the
impact of the public signal on the volume of trading, volatility and spot returns. Our key
mechanism is that the public signal induces a decline in investor disagreement, a channel
that can lead to a decline in trading volume and volatility, consistent with models of investor
disagreement in FX and stock markets (Ranaldo and Santucci de Magistris, 2019; Kruger,
2020).

Exchange rates

Consider a market of N agents with heterogeneous priors on the future payoff of the
exchange rate s t dollars per unit of foreign currency.6 The expectations of the future
                       j
exchange rate s t+1 for agent j is defined in equation 1. The expectation conditional on the
private signal is θ j . The precision of the private signal is governed by the variance σ2j .
    6
        Under this notation, an increase in s t implies a depreciation of the dollar.

                                                           6
j               j
                                   s t+1 = θ j + ε t+1 , ε j ∼ N (0, σ2j )                                    (1)

Trump tweets

We characterize the Trump tweet in equation 2 as a public signal known to all investors.
The arrival of the public signal is unexpected. For example, tweets can occur at any time of
the day, unlike scheduled monetary announcements of the central bank. The public tweet
has expectation θ T , with precision of the public signal governed by σ2T . For our analysis,
we assume the public and private signal are uncorrelated, cov(ε T , ε j ) = 0.

                                     T
                                   s t+1 = θ T + ε Tt+1 , ε T ∼ N (0, σ2T )                                   (2)

   An important assumption we make is that the Trump tweet aggregates private infor-
                                                                    PN
mation, and is equal to the average of the investor priors, θ T = N1 j=1 θ j . Critically, the
information aggregation of Trump is not known in advance by Bayesian agents.7

Bayesian agents

A rational agent will update their prior based on the public signal. Their expectation,
conditional on the public and private information, is a weighted average of the public and
private signal. Let us denote the weights on the public and private signal for a Bayesian
agent as ωBj and 1 − ωBj respectively, in equation 3.

                                     j
                                 E[s t+1 |I j , I T ] = ωBj θ T + (1 − ωBj )θ j                               (3)

       A Bayesian agent will update their prior based on the relative precision of the public
                                                                                                     σ2j
and private signal. Formally, we define the weight on the public signal, ωBj =                     σ2T +σ2j
                                                                                                              , in
equation 4.
   7
     If we model multiple periods traders will learn that the Trump signal is aggregating private information,
causing Bayesian agents to put a weight of 1 on the Trump signal. Therefore all agents would be Trump
followers in a multi-period setting. We avoid this problem by assuming a 2 period model, that is, the Bayesian
agents only form an expectation today (time t) of the payoff in period t + 1.

                                                         7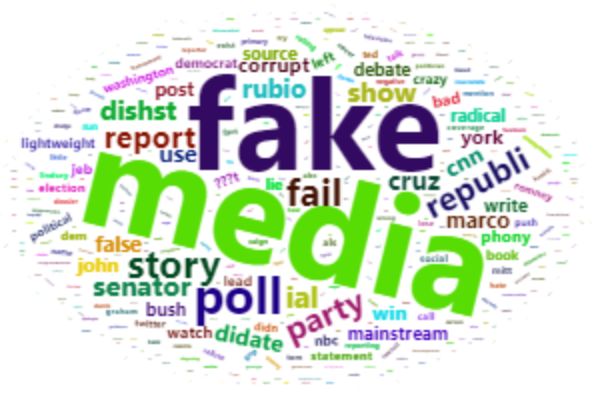
j
                                                                σ2j               σ2T
                               E[s t+1 |I j , I T ]   =                 θT +                 θj               (4)
                                                          σ2T   + σj  2
                                                                               σ2T   + σ2j

                                                                       σ2T
         If the relative precision of the public signal is             σ2j
                                                                             → 0, the Trump tweet is more precise,
and the investor’s weight on the public signal approaches one. Conversely, if the public
signal is noisy relative to the private signal, the investor puts a weight of zero on the public
signal.

Trump Followers

As well as Bayesian agents, a subset of agents are characterized as Trump followers. These
traders adopt the Trump tweet as their complete signal. This is defined formally in equation
5.

                                                      j
                                                E[s t+1 |I j , I T ] = θ T                                    (5)

         In the context of our model, an increase in the number of Trump followers reduces
investor disagreement in the FX market about the future spot rate. We can see this visually
in Figure 1, which plots the distribution of investor priors, and the posterior distribution of
each agent type. Under the assumption that the Trump tweet is centered at the distribution,
if a fraction of agents are Trump followers, the distribution of posteriors is now more
compact around θ T . The reduction in investor disagreement reduces the dispersion in
investor expectations of the future spot rate, with implications for the amount of trading
and volatility of the spot rate, consistent with related literature on the link between investor
disagreement and volume and volatility in FX and stock markets (Ranaldo and Santucci de
Magistris, 2019; Kruger, 2020).8

Investor optimization

The investor maximizes exponential utility over their next period wealth, U t = −e−γWt+1 ,
                                                                                         j   j
and invests entire wealth in foreign currency bonds Wt+1 = ρ t b t . The excess return made
     8
    Ranaldo and Somogyi (2021) has similar predictions to our model, and show that an increase in the
dispersion of trader expectations of the future payoff lead to an increase in trading and volatility in the
currency market. We depart from their framework in showing the channels through which a public signal
can generate a decline in information disagreement.

                                                                 8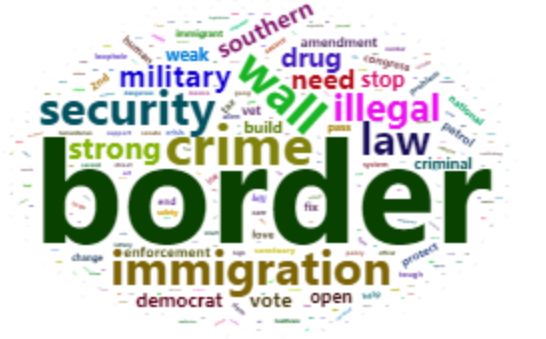
on the foreign currency bond for a Bayesian agent is defined in equation 6. Similarly, the
excess return on the domestic bond for a Trump follower is given by equation 7.

                                                                    j
                        ρ tj,B = ωBj s tT1 + (1 − ωBj )s t+1 − s t + i t∗ − i t       (6)

                                      ρ tj,T = s t+1
                                                 T
                                                     − s t + i t∗ − i t               (7)

   The optimization problem of the investor is to maximize utility subject to all wealth
invested in domestic bonds. This is given by a mean-variance problem, maximizing equation
8 subject to the constraint on next period wealth in equation 9.

                                                  j     1       j
                         max              L = E[Wt+1 ] − γVar(Wt+1 )                  (8)
                            j
                           bt                           2
subject to:

                                                   Wtj = ρ tj b tj                    (9)

   Solving for the optimal level of bond demand by Bayesian agents in equation 10, and
optimal bond demand by Trump followers in equation 11.

                                     ωBj θ T + (1 − ωBj )θ j − s t + i t∗ − i t
                          b tj   =                  2
                                                                                     (10)
                                         γ(ωBj σ2T + (1 − ωBj )2 σ2j )

                                                   θ T − s t + i t∗ − i t
                                        b tj   =                                     (11)
                                                             γσ2T

                                                         9
Market clearing
Given a total of N agents, let us define NB as the number of Bayesian agents and NT denote
the number of Trump followers. In equilibrium, market clearing requires the net bond
supply to be equal to zero, giving rise to equation 12.9
X X
b tj + b tj = 0 (12)
j∈NB j∈NT
Substituting the formulae for optimal bond holdings by Bayesian agents and Trump
followers into the market clearing condition yields equation 13.
X ωBj θ T + (1 − ωBj )θ j − s t + i t∗ − i t X θ T − st + i∗ − it
t
+ =0 (13)
j∈NB
2
ωBj σ2T + (1 − ωBj )2 σ2j j∈NT
σ2T
Under the simplifying assumption that the Trump tweet is equal to the average of
PN
investor priors, θ T = N1 j=1 θ j , the equilibrium spot exchange rate is given by equation
14.
s t = θ T + i t∗ − i t (14)
Asset pricing view of the exchange rate
We now determine the equilibrium exchange rate based on equilibrium in money markets,
following Jeanne and Rose (2002). First we use simple money demand functions for home
and foreign in equations 15 and 16.
m t − p t = −αi t + η y t (15)
m∗t − p∗t = −αi t∗ + η y t∗ (16)
9
This is similar to the market clearing condition in Bacchetta and Van Wincoop (2006) and Gholampour
and Van Wincoop (2017), in which the net bond demands of informed and liquidity (noise) traders are equal
to zero. The deviation in our model is the distinction between informed traders and Trump followers.
10Imposing purchasing power parity in equation 17, we derive an expression for s t as a
function of the difference in money supplies and income differences between the domestic
and foreign currencies in equation 18.
s t = p t − p∗t (17)
s t = m t − m∗t + α(i t − i t∗ ) − η( y t − y t∗ ) (18)
Let us denote future fundamentals f t in equation 19.
m t − m∗t η( y t − y t∗ )
ft = − (19)
1+α 1+α
We now obtain an expression for s t in terms of fundamentals m t and y t , and the expected
future spot rate, which is a weighted average of the Trump tweet and the public signal.
α
st = f t + E t [s t+1 ] (20)
1+α
Iterating forward, we obtain equation 21, which states that the spot rate is a function
of expected future fundamentals (Engel and West, 2005; Froot and Ramadorai, 2005).
∞
X α s
st = f t + E t [ f t+s ] (21)
s=1
1+α
We now present three predictions on the introduction of the Trump tweet on the volume
of trading, the conditional volatility of the spot exchange rate, and the bias of spot returns.
Prediction 1: Trading volume decreases as the share of Trump followers increases.
1
PN j
Define aggregate bilateral FX volume as VF X = 2 j=1
|b t |. The effect on FX volume is given
by equation 22. All else equal, a higher fraction of Trump followers will lower trading volume.
11| θ σ−θ2 |
P j T
VF X |I j , I T j∈NB
j
= P θ j −θ T θ j −θ Tsignal, the variance of the future spot rate for Bayesian agents and Trump followers are
always lower in the equilibrium with public information. Mathematically, the threshold
NB R2 −1
N > 0 > R2 is satisfied for any fraction of Bayesian agents when the public signal is
relatively more precise, R < 1.
If the Trump tweet does not have information content, and the public signal is imprecise,
the effect of spot rate volatility conditional on the public and private signal is ambiguous.
While there is still a decline in conditional variance for Bayesian agents, Trump followers now
experience an increase in spot rate volatility conditional on the public signal. Mathematically,
there is a decline in conditional volatility of the spot rate if and only if the share of Bayesian
agents is sufficiently high, given by the threshold in equation 24.
If Trump tweets are informative, more Bayesian agents will rely on public information
over their private signals, which in turn should lead to a reduction in information asymmetry
in the currency market. We conjecture that the decline in information asymmetry leads
to dealers quoting smaller bid-ask spreads, as they are more willing to take the other side
of trades based on public information. Therefore, an informative public signal via Trump
tweets should reduce not only the dispersion of investor beliefs on the future spot rate, but
also bid-ask spreads in the FX market.10
Prediction 3: An informative Trump tweet affects FX spot returns due to a bias be-
tween the Trump tweet and speculators’ expectations.
m t −m∗t η( y t − y t∗ )
Define the exchange rate fundamental f t = 1+α − 1+α . The spot rate with the introduction
of the Trump tweet is defined in equation 25. The dollar can appreciate due to a bias between
Trump expectations of future fundamentals and expectations of the average speculator.
wBj NB + NT ∞
X α s 1 X
j
s t |I T ,I j − s t |I j = E t [ f t+s
T
]− E[ f t+s ] (25)
N
| {z } s=1 1 + α N j∈N
public signal adoption | {z }
bias
Proof: see Appendix
10
While we do not model bid-ask spreads explicitly, based on the theory in Glosten and Milgrom (1985),
the bid-ask spread is a positive function of the share of informed traders in the market. Therefore, a decline in
the share of informed traders, due to adoption of the public signal by Trump followers, reduces the effective
share of informed (private) traders, and in turn leads dealers to quote smaller bid-ask spreads. Alternatively,
one could also rationalize the reduction in bid-ask spreads in an inventory model with competitive dealers
where the bid-ask spread is a function of the dealers’ risk aversion, asset volatility, aggregate trade size and
the number of dealers (De Jong and Rindi, 2009).
13The change in the spot rate conditional on public information is a weighted average of
the bias in Trump’s expectations of future fundamentals. This is equal to the difference
between the average of investor priors and the Trump signal for Trump followers. The
bias is weighted by the share of agents that adopt the public signal, and is given by the
wBj NB +NT
N . This is increasing in the weight given by Bayesian agents to the public signal. We
illustrate the bias in fundamentals in Figure 1. The average of investor priors is given by
¯ , and Trump’s prior of the future fundamental is given by f T . The posterior distribution
f t+s t+s
of Trump followers and Bayesian agents shifts toward Trump expectations, and this causes
a change in the spot exchange rate based on equation 21.11
The bias between Trump’s exchange rate fundamentals and the fundamentals of specu-
lators causes a change in the spot exchange rate. We can further decompose the direction of
the bias into differences between expectations of future fundamentals, output growth and
the money supply. For example, if growth expectations at home (U.S.) are systematically
j
higher for the Trump tweet, E t [ y t+s
T
] > E t [ y t+s ]∀s = 0, 1, 2,. This implies the bias will
be negative, causing an appreciation of the U.S. dollar. Similarly, tweets that imply an
increase in trade barriers and protectionism imply higher tariffs, a relative contraction in
foreign output growth, and an appreciation of the dollar spot exchange rate. We test this
empirically by examining spot returns during Trump tweets, with respect to tweets with
macroeconomic and trade content.
11
Note that we are assuming a bias in investor priors on the future macroeconomic fundamentals. This
relaxes the assumption on the prior of the Trump signal being equal to the average of investor priors,
PN
θ T = N1 j=1 θ j .
144 Data
4.1 Donald Trump’s Tweets
We obtain an archive of Donald Trump’s tweets from http://www.trumptwitterarchive.com,
which collects all tweets from account @realDonaldTrump. We are interested in the period
starting from June 16 2015, as it is the day when Donald Trump announced his presidential
campaign. Our sample ends in August 20 2019. During this period, there are 17,865 tweets
posted from his account in total. As expected, there are various topics covered in these
12
tweets.
We have two approaches to identify the information content of Trump tweets, and to
filter tweets that have macroeconomic, trade or exchange rate content. The first approach
uses a dictionary approach, and the second uses a textual analysis based on a bi-term topic
modelling approach.13 We combine the relevant Tweets identified by these two methods
for our empirical analysis.
4.1.1 Dictionary approach
Baker et al. (2019) provides a dictionary of policy related terms about the macroeconomics
outlook, trade policy, and exchange rate topics that are most relevant for the foreign ex-
change market. Other topics such as healthcare and energy are clearly much less connected
with currencies. Therefore, our focus is on Tweets containing terms falling into macroeco-
nomics outlook, trade policy, and exchange rate categories. Term sets in this dictionary are
constructed by careful audit and validation with a large sample of newspapers articles, so
it should generate a good level of accuracy. A comprehensive list of these terms associated
with three categories (macroeconomics outlook, trade policy, and exchange rates) can be
found in Table 1.
[TABLE 1 ABOUT HERE]
After filtering tweets containing at least one term in any of these three specific categories,
we do a manual reading of those tweets to remove all tweets not expressing the topic
12
The website from which we obtain the data also provides a list of some topics frequently tweeted by the
45th President of the U.S., such as personal superlatives (e.g., ’My I.Q. is one of the highest - and you all
know it!"), global warming (e.g., " Global warming is a HOAX"), and media disdain (e.g., "CNN Politics just
plain dumb").
13
Conventional textual analysis algorithms like LDA or LSA are difficult to use in this setting as their
algorithms are not well suited to defining topics with short messages.
15intended (false positives). We are left with a sample of 458 tweets.14 In particular, there
are 218 tweets about trade, 247 tweets about macroeconomics outlook, and 6 tweets about
exchange rates. A sample of tweets can be found in Table B in the Appendix.
4.1.2 Bi-term topic modelling (BTM) approach
BTM is a topic modelling approach developed by Yan et al. (2013) to address shortcomings
associated with conventional topic modelling approaches such as LDA and LSI when it
comes to discovering content of short texts. To the best of our knowledge, we are the first
to employ this method of textual analysis in the finance literature.
Two sets of input are required from BTM approach. The first is the collection of words,
which is the corpus. We apply BTM approach on our full sample of tweets after these tweets
are properly cleaned with standard text-cleaning procedures, such as lower capitalization,
removing numbers and English stop words. The second input required is the number of
topics, which we set as 9.15
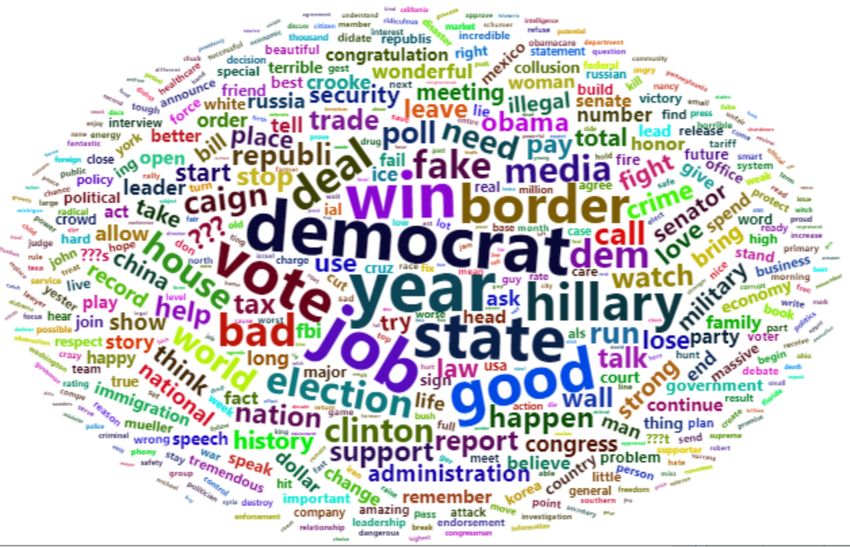
Two sets of output are generated from BTM algorithm. The first set of output includes
the list of top keywords in each topic and the respective probabilities of observing each
word in the topic. For each topic n, there is a set of vectors β̂n = [β̂n,1 ,..., β̂n,J ]’, in which
β̂n, j is the probability that the word j belongs to topic n. A full list of top keywords for all 9
topics can be found in Figure A1 in the Appendix. We summarise the keywords for the two
topics we identify as having relevant information content in Figure 2a and 2b. We classify
the keywords in Figure 2a as the trade topic, with keywords such as trade, tariff, china,
dollar, deal. Similarly, the keywords in Figure 2b refer to the macroeconomic topic. This
contains keywords such as job, tax, number, economy, market. These are the 2 out of 9
topics of our interest as they are directly relevant for the FX markets.
[FIGURE 2a and FIGURE 2b ABOUT HERE]
Now that we have identified the keywords in each topic, we use a second set of output
that measures the proportion of topics for each tweet. Formally, we define a set of vectors
for each tweet γ̂ t = [γ̂ t,1 , γ̂ t,2 , γ̂ t,3 ,..., γ̂ t,n ]’, in which γ̂ t,n measures the proportion of tweet t
that is made up of topic n. Our condition for a tweet with macroeconomic or trade content
14
Retweets are excluded from the sample
15
The choice of the optimal number of topics depends on key tradeoffs between interpretation and goodness
of fit (Chang, Gerrish, Wang, Boyd-Graber, and Blei, 2009; Hansen, McMahon, and Prat, 2018). For example,
in applying probabilistic topic modelling, a lower number of topics increases the interpretation of the topics,
whereas a larger number of topics leads to better goodness-of-fit of the model. Our choice of 9 topics is the
maximum number of topics which still offers an intuitive interpretation of trade and macroeconomic content.
16is a probability associated with Trade or Macroeconomics topics being at least 30%.16 We
then also check all these Tweets to manually to remove false positives, leaving us with a
filtered set of 181 Trade and 242 Macroeconomics tweets.
4.1.3 Combined Tweets identified by dictionary approach and BTM approach
We combine all tweets identified by dictionary approach and BTM approach as carrying
relevant information for the FX markets. There are occasions when multiple relevant tweets
are posted at the same hour. This leaves us with 506 hours with relevant tweets in total.
We merge the tweets data at an hourly frequency with FX order flow and indicative quotes
data. We summarise the distribution of these tweets across day of the week, and hour of
the day based on London time is shown in Panel A and Panel B of Figure 3. In Panel C and
Panel D of the same figure, we report these patterns for all tweets posted during the sample
period.
[Figure 3 ABOUT HERE]
It can be seen that tweets are distributed relatively equally across all days of the week.
It means that a number of tweets are posted during the weekend when the FX market is
relatively illiquid and the availability of trading data is also limited. We follow the literature
to handle tweets during the weekend by treating all these tweets as if they are posted
during the first hour of the next trading week (10pm on Sunday London Time).17 In terms
of hour of the day, most tweets are posted at late afternoon and early morning London
Time, which corresponds with morning and evening time based on EST time.
4.2 FX Trading Volume Data
We use the CLS FX volume dataset provided by Quandl. CLS Group handles over 50% of
global FX transaction volume (spot, swap, and forward), for up to 16 bilateral currency
pairs.18 The advantage of CLS data is spot FX volume aggregated and delivered at a
hourly frequency, in contrast to the BIS Survey. The data records volume of transactions
for four groups of market participants, banks, funds, non-bank financial institutions, and
16
Reducing the threshold to 20% results in many false positives.
17
We also implement the second approach by removing all tweets during the weekend from the sample.
Results are mostly similar and are available upon request.
18
The currencies included covers bilateral exchange rates of the U.S. with respect to Australia, Canada,
Euro Area, Japan, New Zealand, Norway, Sweden, Switzerland, United Kingdom, Hong Kong, Hungary, South
Africa, Iceland, Singapore, Mexico and Korea. Denmark’s currency is excluded from our sample as it is pegged
to the Euro
17corporations. Market makers are typically banks, and price takers in the market are divided
into three categories, including funds, non-bank financials, and corporates. This gives
us four groupings for measuring trading volume: transactions between the bank and
funds, bank and non-bank financials, bank and corporates, and bank-bank transactions.
Transactions between two market makers (inter-dealer transactions) or two price takers
are excluded from this dataset.
As our time period of interest is from when Donald Trump started his presidential
campaign on 16th June 2015, this dataset provides us with hourly data of over 4 years.
Data is recorded for 5 days a week, with each trading week beginning from 9pm on Sunday
and ending at 9pm on Friday (London Time). It therefore covers market transactions
between the time when Sydney market opens on Monday morning and New York market
closes on Friday evening. The pattern of average hourly spot FX trading volume based on
London time is shown in Figure 4.
[Figure 4 ABOUT HERE]
In early morning London time, when only Asian markets are open, trading volume is
relatively low. It starts to go up at around 7am as European markets begin their trading
day. Trading volume slightly decreases around lunchtime, but it quickly bounces back
and reaches its peak of the day at around 1pm. This is when both European and the U.S.
markets are active. The trading volume declines gradually after 5pm and reaches its lowest
level around 10pm, when only Australian market is open.
FX trading volume for the different groups of market participants are categorized by
different groups is plotted in Figure 5. Most of the trading in the spot FX market included
in this dataset (around 85%) occurs in inter-bank transactions between a market maker
and price taker bank. In contrast, trading between bank and corporates makes up only
around 1% of the total volume.
[Figure 5 ABOUT HERE]
We follow the literature (e.g., Krohn and Sushko 2017) to remove data on some holidays
when the FX trading volume is relatively thin. Those holidays include Christmas (24th -
26th December), New Years (31st December - 2nd January), July 4th, Good Friday, Easter
Monday, Memorial Day, Labour Day, and Thanksgiving and the day after.
184.3 Intraday FX Volatility and Bid Ask Spread
We obtain tick-by-tick high frequency data for spot indicative quotes from Thomson Reuters
Tick History. Our sample is from 16th June 2015 to 20th August 2019. This dataset contains
indicative quotes sampled at milli-second frequency.
Hourly Volatility: We follow Mueller, Tahbaz-Salehi, and Vedolin (2017) to construct
intraday realised volatility. Specifically, we compute spot exchange rate changes sampled at
five-minute intervals based on mid price of the quote. Hourly realised variance is the sum
of squared changes, and hourly volatility is the square root of realised hourly variance.
Hourly Bid Ask Spread: We first obtain the last quote of each hour and then construct
the bid-ask spread indicator as the difference between the ask and the bid prices divided
by the midpoint.
Hourly Returns: All currencies are quoted against the USD, meaning an increase in
s implies an appreciation of the USD. We calculate the exchange rate return as the log
difference in the exchange rate over an hour:
∆s t+1 = s t+1 − s t (26)
where s t is the log midpoint of the last quote at hour t.
195 Empirical analysis
In this section, we discover the effects of tweets on several characteristics of FX market,
including trading volume, volatility, bid ask spreads, and returns.
5.1 Panel regressions
We pool all observations from 16 currency pairs and run fixed-effects panel regressions
with hourly data. Our fixed-effects panel regression specification is in equation 27.
x i,t = αi + β1 Tweet t + β2 X t + µd + σh + εi,t (27)
The outcome variable x i,t is either the trading volume, realised volatility, bid ask spreads,
or returns for currency pair i at time t. Tweet t is the dummy variable equal 1 if there is a
tweet about macroeconomics outlook, trade, or FX posted by Donald Trump at that hour
and 0 otherwise, X t is a set of control variables (i.e., Presidency dummy, FOMC dummy,
VIX, and TED spread). Specifically, Presidency dummy is a variable equal 1 if date is after
8th November 2016, which is the day when Donald Trump won the election and got elected
as the U.S. President. FOMC dummy is equal 1 if during that hour FOMC announcements
are announced, and 0 otherwise. VIX is the CBOE Volatility Index, and TED spread is the
spread between 3-month LIBOR and 3-month T-Bill. µd and σh are time fixed effects that
control for the day of week and hour-of-day respectively. Standard errors are clustered at
the level of the currency pair.
5.2 Trump tweets and FX Trading Volume
We start by testing the first prediction of the model which suggests a link between FX
trading volume and Trump tweets with relevant content. To control for persistence in FX
volume, we follow Cespa et al. 2021 in constructing a measure of abnormal FX trading
volume. We construct our abnormal volume measure for currency pair i at time t is the log
deviation from the moving average of FX trading volume at the same hour over the last 21
trading days. Regression results for the panel specification with FX spot trading volume are
reported in Table 2.
[TABLE 2 ABOUT HERE]
The regression results shown in the first column suggest a negatively significant link
between the presence of a Tweet and spot FX trading volume during that hour. The
20coefficient of Tweet hour dummy is -0.631, with a t-statistic of -3.71. This negative
coefficient for Tweet hour dummy implies that during an hour when there is a Trump Tweet
relevant for the foreign exchange market, there is a decrease in abnormal spot FX trading
volume of approximately 0.63 per cent. To capture a time trend since Trump’s presidency,
the second column controls for presidency dummy and it still gives us a negatively significant
Tweet hour dummy’s coefficient. The presidency dummy in this regression is significant,
meaning that since Donald Trump won his presidency on 8th November 2016, spot FX
trading volume increases. In the third column, we add FOMC dummy into the regression,
and Tweets hour dummy remains strongly significant. The FOMC dummy is positive and
significant with a t-statistic of 2.62. This implies that the release of FOMC announcement
is associated with an increase in abnormal spot FX trading volume during that hour. This
result is consistent with evidence that FX volume increases following FOMC announcements
(Fischer and Ranaldo, 2011). In the fourth column, we add VIX as an additional control,
and the coefficient of Tweets hour dummy becomes even stronger, with a t-statistic of -4.16.
The coefficient of VIX in this regression is positively significant, with a t-statistic of 3.65.
This finding implies that during a time of higher uncertainty, spot FX trading volume spikes
up. In the fifth column, we incorporate TED spread into the specification. When all control
variables are included in the regression simultaneously, the coefficient of our variable of
interest, which is Tweet hour dummy, remains its negative sign and strongly significant
with a t-statistic of -4.25. Overall, results from this table suggest that during hour when
there is a Trump Tweet containing relevant information for the foreign exchange market,
spot FX trading volume decreases.
We now examine if there is variation in the effects on FX volume across the four groups
of market participants of banks, funds, non-financial and corporate firms. Regression results
for FX volume of each group are reported in Table 3.
[TABLE 3 ABOUT HERE]
In Panel A of the table, we examine the impact of tweets on trading activity between of
inter-bank transactions, where one bank is a market maker and the other is a price taker.
The coefficient of the Tweet dummy is negative and strongly significant in all specifications.
Similar patterns are also observed in the next two panels, where we show the results for
trading volume between banks and funds and banks and non-bank financial firms, where
the bank acts as the market maker (Panel C). In both panels, when the full set of control
variables enters the regression, the coefficient of Twitter dummy remains negative and
significant at a 1% level of significance. In panel D, we look at the trading activity between
21market maker bank and the corporate sector (e.g., multinational firms). The coefficient
of Tweet dummy is positive and slightly significant at the first column. However, in the
next four columns, this coefficient loses its statistical significance. Therefore we do not find
empirical evidence showing clear effects of Tweets on trading volume between the bank and
corporate sector. Overall, empirical results from Table 2 and Table 3 suggest that Donald
Trump’s Tweets decrease overall trading volume in the spot FX market in line with the first
prediction of the model. When we break down the trading volume by different market
participants, this result holds for three groups of informed market participants. In contrast,
we do not find evidence for this effect for uninformed group of market participants, i.e.,
corporate sector.19
5.3 Trump Tweets and FX Volatility
We now test the second prediction of the model, which states that volatility declines for
informative Trump tweets.20 We address the persistence of volatility by using innovations
to realised intra-day volatility as the relevant outcome variable. The regression results are
reported in Table 4. In the first column, when day of the week and hour of the day dummies
are the only control variables in the regression, the coefficient of Tweet dummy is negative
and strongly significant with a t-statistic of -5.07. It implies that Tweets reduce FX realised
volatility. When more variables are controlled for in the next columns, the magnitude of
Tweet dummy’s coefficient slightly decreases, however, it remains its statistical significance.
In the last column, when the full set of control variables is included in the regression, the
coefficient of our interest is negative with a a t-statistic of -2.90. These empirical findings
provide strong evidence suggesting that tweets reduce the realised volatility in the FX
market.
[TABLE 4 ABOUT HERE]
5.3.1 Trump Tweets and FX Bid-Ask Spreads
The reduction in volatility is consistent with a reduction in asymmetric information, and
this should also have an impact on market makers ability to quote smaller bid-ask spreads.
19
The corporate sector is typically characterized as liquidity traders, using the spot market for hedging
purposes rather than speculative activity (Ranaldo and Somogyi, 2021).
20
In the context of the model, we classify an informative Trump tweet as having a higher precision than
private information.
2221
To investigate the effects of tweets on bid-ask spreads, following Krohn and Sushko
(2017), we measure bid-ask spreads using price quotes by big banks based on the 2016
G-SIB Classification as these banks provide quotes across most pairs of currency in our
sample. Results showing the link between Tweets and bid-ask spreads are reported in Table
5. In the first column, the coefficient of Tweet dummy is negative with a t-statistic of -3.11,
and the relationship is robust to adding controls. The reduction in bid-ask spreads during
Trump Tweet hours, suggesting a reduction in information asymmetry due to trading on
the common public signal.22
[TABLE 5 ABOUT HERE]
5.4 Trump Tweets and FX Spot Returns
Testing the third prediction of the model, we examine the impact of Trump tweets on
FX spot returns. Theoretically, spot returns arise due to a bias between the expectations
of public and private information. If Trump tweets are more optimistic about the U.S.
economy, or more protectionist about trade relations than speculators, there is a bias in
the expectation of future macroeconomic fundamentals. Regression results are reported in
Table 6.
[TABLE 6 ABOUT HERE]
The positive coefficient of Tweet dummy in the first column suggests Trump tweets lead
to an appreciation of the U.S. dollar. Our estimates suggest that the USD appreciates by an
average of 0.5 per cent during Trump tweet hours against a basket of currencies.23 The
results are robust to adding additional controls, such as the Presidency, FOMC meetings,
and the VIX. These results support the model prediction that FX returns reflect Trump’s
optimistic view on the U.S. economy.
21
While we do not explicitly model bid-ask spreads, adoption of the public signal by speculators reduces
the information advantage of informed trading. A market maker needs to be compensated less for taking the
other side of informed trades, leading to lower bid-ask spreads.
22
While bid-ask spreads can also reflect changes in liquidity, we attribute the decline in bid-ask spreads due
to a decline in information asymmetry due to the decline in trading during these periods. If bid-ask spreads
declined due to increased liquidity, we may expect an increase in trading volume during Tweet hours.
23
We are using a notation of units of foreign currency per USD. Therefore a positive coefficient indicates an
appreciation of the USD with respect to the foreign currency.
235.4.1 Macro versus Trade Tweets
We now test if the appreciation of the USD is specific to tweets about trade or macroeconomic
content. Effects of presidential tweets on spot returns have been found in Benton and
Philips (2018), which shows that trade relations between Mexico and the U.S. lead to an
appreciation of the USD/Peso. We report results for the subset of trade and macro tweets in
Table 7. In another study that uses textual analysis of Presidential tweets on the China-US
trade dispute, Ferrari et al. (2021) find that trade tensions between China and the U.S lead
to an appreciation of emerging markets.
[TABLE 7 ABOUT HERE]
In Panels A and B, we show results for regressions with trade and macro tweets re-
spectively. In all specifications, the coefficient of the trade tweet is positive, implying that
hours with trade tweets are linked with appreciation of the USD. However, this effect is
rather weak as the statistical power is just 10%. In Panel B, we replace trade tweets with
macro tweets in the regressions. The coefficient of Macro tweet is positive and strongly
significant in all specifications. With the full set of control variables in the last column, the
coefficient of Macro tweet is 0.005 (0.5 per cent) with a t-statistic of 4.21. This is similar to
the unconditional effect of Trump tweets on spot returns, suggesting that the appreciation
of the USD against the panel of currencies is driven more by tweets with macro content.
This confirms the model prediction that spot returns are related to the bias in Trump’s
expectation of future macroeconomic fundamentals.
5.4.2 Sentiment analysis of Trump tweets
We can also consider measuring the direction of tweets based on a sentiment analysis.
For example, the bias between Trump tweets and private information are conditional on
whether Trump’s tweets are optimistic or pessimistic regarding the future growth of the
U.S. economy. To measure the direction of sentiment, we classify tweets into positive
and negative tone based on the dictionary developed by Liu and Hu (2004). Regressions
showing the link between positive and negative tweets and currency returns are reported
in Table 8.
[TABLE 8 ABOUT HERE]
In Panel A, we run regressions with independent variable of interest being positive
tweet. The coefficient of positive tweet is positive and strongly significant in all regressions.
24In the last column with the full set of control variable, the coefficient of positive tweet is
0.005 with a t-statistic of 5.22. This result implies that relevant Trump tweets with positive
sentiment are associated with USD’s appreciation. In Panel B, we examine tweets with
negative sentiment, and in line with our hypothesis, the coefficient on the tweet dummy
is negative and strongly significant. In the last column, the coefficient of this variable is
-0.008 with t-statistic of -5.07. The analysis suggests that the sentiment of tweets matters
for currency returns. Positive tweets are linked with USD’s appreciation, whereas negative
tweets are linked with USD’s depreciation. This is consistent with our model prediction on
the bias between Trump expectations and private information. Examining the distribution
of sentiment, we find two thirds of the sample are classified as positive sentiment, which
explains why the unconditional effects of Trump tweets are to cause a USD appreciation in
the hour of the tweet.
5.4.3 Trump tweets and media coverage of the Mueller’s investigation
We investigate whether Trump tweets are used as a distraction strategy by testing the
link between tweets and media coverage of the Mueller’s investigation in the New York
Times. We use the dataset for media coverage of the Mueller’s investigation provided in
Lewandowsky et al. (2020). Logit regressions are implemented to examine as to whether
media coverage of the Mueller’s investigation the probability of Trump tweeting in the next
hour. Results are shown in Table 9.
[TABLE 9 ABOUT HERE]
In Panel A, we show the link between informative tweets and media coverage of the
Mueller’s investigation. The coefficient of the lagged media coverage dummy is positive
and statistically significant in all specifications, which suggests that media coverage of this
potentially harmful topic for Trump increases the probability of him posting an informative
tweets in the next hour. Informative tweets are then classified into positive and negative
tone as in the previous subsection. In Panel B, the independent variable of interest maintains
the same sign as in Panel A. This indicates the positive link between media coverage of the
Mueller’s investigation and tweets with positive tone. We replicate the logit regressions
with negative tweets in Panel C. The coefficient of the independent variable of interest loses
its statistical significance. Overall, results from this table provide suggestive evidence that
tweets are used as a distraction strategy. In particular, when there is media coverage of
harmful topics, Trump is likely to post informative tweets, especially those with positive
sentiment.
25You can also read