The impact of drought on soil moisture trends across Brazilian biomes
←
→
Page content transcription
If your browser does not render page correctly, please read the page content below
Nat. Hazards Earth Syst. Sci., 21, 879–892, 2021
https://doi.org/10.5194/nhess-21-879-2021
© Author(s) 2021. This work is distributed under
the Creative Commons Attribution 4.0 License.

The impact of drought on soil moisture trends
across Brazilian biomes
Flavio Lopes Ribeiro1 , Mario Guevara2,a,b , Alma Vázquez-Lule2 , Ana Paula Cunha3 , Marcelo Zeri3 , and
Rodrigo Vargas2
1 Disaster Research Center, School of Public Policy and Administration, University of Delaware, Newark, DE, USA
2 Department  of Plant and Soil Sciences, University of Delaware, Newark, DE, USA
3 National Center for Monitoring and Early Warning of Natural Disasters (CEMADEN), São José dos Campos, SP, Brazil
a present address: University of California, Riverside, Department of Environmental Sciences,

900 University Ave., Riverside, CA 92521, USA
b present address: U.S. Salinity Laboratory, Agricultural Research Service, United States Department of Agriculture,

450 West Big Springs Rd., Riverside, CA 92507, USA

Correspondence: Flavio Lopes Ribeiro (flavio.psi@hotmail.com) and Mario Guevara (mguevara@ucr.edu)

Received: 30 May 2020 – Discussion started: 10 June 2020
Revised: 23 December 2020 – Accepted: 21 January 2021 – Published: 9 March 2021

Abstract. Over the past decade, Brazil has experienced se-        tem and develop customized strategies for adaptation to cli-
vere droughts across its territory, with important implications   mate change in each biome.
for soil moisture dynamics. Soil moisture variability has a
direct impact on agriculture, water security and ecosystem
services. Nevertheless, there is currently little information
on how soil moisture across different biomes responds to          1   Introduction
drought. In this study, we used satellite soil moisture data
from the European Space Agency, from 2009 to 2015, to an-         Drought is a natural and human-induced hazard common to
alyze differences in soil moisture responses to drought for       all climate zones in the world (Sheffield and Wood, 2008),
each biome of Brazil: Amazon, Atlantic Forest, Caatinga,          generally referred to as a sustained occurrence of below-
Cerrado, Pampa and Pantanal. We found an overall soil mois-       average water availability due to precipitation deficit and
ture decline of −0.5 % yr−1 (p < 0.01) at the national level.     soil moisture decline (Magalhães, 2016). Precipitation deficit
At the biome level, Caatinga presented the most severe soil       is the most studied driver of drought (Mishra and Singh,
moisture decline (−4.4 % yr−1 ), whereas the Atlantic Forest      2010; Smith, 2013; Villarreal et al., 2016) and has been
and Cerrado biomes showed no significant trend. The Ama-          furthering several drought indicators and models. However,
zon biome showed no trend but had a sharp reduction of            precipitation-based indicators are limited in the assessment
soil moisture from 2013 to 2015. In contrast, the Pampa and       of social and environmental responses to the lack of rain and
Pantanal biomes presented a positive trend (1.6 % yr−1 and        therefore not suitable for evaluating the impacts of drought
4.3 % yr−1 , respectively). These trends are consistent with      when used alone. On the other hand, drought indicators based
vegetation productivity trends across each biome. This infor-     on soil moisture are not only key to understanding the physi-
mation provides insights into drought risk reduction and soil     cal mechanisms of drought but also useful for assessing how
conservation activities to minimize the impact of drought in      soil moisture decline can alter vegetation water availabil-
the most vulnerable biomes. Furthermore, improving our un-        ity and, consequently, agricultural production and ecosystem
derstanding of soil moisture trends during periods of drought     services (Smith, 2013; NWS, 2006).
is crucial to enhance the national drought early warning sys-        When soil moisture declines below critical water stress
                                                                  thresholds, it reduces biomass production, soil respiration
                                                                  and the overall soil carbon balance (Bot and Benites, 2005;

Published by Copernicus Publications on behalf of the European Geosciences Union.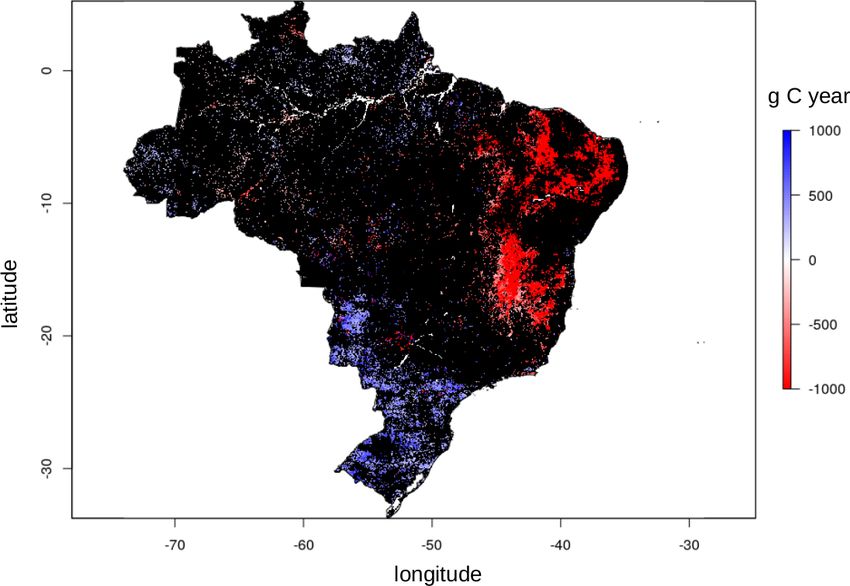
880                         F. Lopes Ribeiro et al.: The impact of drought on soil moisture trends across Brazilian biomes

Vargas et al., 2018). Low carbon in soils (due to lower biolog-
ical activity) reduces its structural integrity and increases the
risk of soil erosion, contributing to river silting, ineffective
runoff control and loss of soil nutrients (Al-Kaisi and Rattan,
2017). Soil moisture is also crucial for addressing the neg-
ative impacts of climate change in water and land resources
(Bossio, 2017). Indeed, temporal variability of soil moisture
in a given biome is an important variable for the character-
ization of the local climate (Legates et al., 2011) and a key
indicator of changes in the biome’s water cycle (Sheffield and
Wood, 2008; Rossato et al., 2017).
   In this study, we use satellite data from the European
Space Agency (ESA) to analyze the impact of drought on
soil moisture across all Brazilian biomes: Amazon, Atlantic
Forest, Caatinga, Cerrado, Pampa and Pantanal. Considering
that each biome has distinct climate, soil and vegetation char-
acteristics, we hypothesize that they would respond differ-
ently to drought conditions (e.g., positive, negative or non-
significant) and show up relevant information for drought
management at national and regional levels.
   In Brazil, most of the work on drought management has
been focused in the semiarid region, well known for its recur-
rent problems with droughts and water scarcity (Fig. 1) and
which predominates the Caatinga biome. However, droughts
have been reported all over Brazil, affecting all other biomes
as well. In the period selected for this study (i.e., 2009
to 2015), there was a high number of municipalities declaring
emergency and even public calamity due to drought across
the country (Cunha et al., 2019a), but the impacts on soil
moisture at the national scale and how each biome responds
to drought are still unknown.
   Due to climate change, extreme events such as drought are
expected to become more intense and recurrent in some re-
gions of Brazil. Therefore, integrating satellite soil moisture
data into early warning systems could contribute to more effi-
cient drought risk management and promote data-driven cli-
mate change adaptation.
   Nevertheless, studies on soil moisture variation have been
conducted at a stand scale due to challenges for measure-
ments across spatial and temporal scales (Legates et al.,
2011; Novick et al., 2016). As a consequence, the lack              Figure 1. A perspective of the Caatinga forest during the dry season
of soil moisture information could lead to inaccurate as-           at the ground level (a). A perspective of land use in the Caatinga
sessment of drought conditions, underestimation of drought          biome during the wet season at the landscape level (b). An example
impacts, and incomplete resilience and adaptation plans.            of human intervention affecting the river course that has an impact
As droughts become more frequent and intense, it is im-             on water availability across the region (c).
portant to enable monitoring of soil moisture trends and
communicate the results at different levels (e.g., municipal,
state, national and regional) and across different perspectives     the first layer of soil is expected to be very dynamic because
(e.g., environmental, social and economic). At present, the         of its interaction with the atmosphere and because deeper
most reliable source of soil moisture information at large          layers still represent an important water storage, especially
scales (i.e., global-to-continental scales) is satellite remote     in the Amazon and Cerrado biomes, soil moisture in the first
sensing (i.e., https://smap.jpl.nasa.gov/, last access: 14 Jan-     5 cm is still a good predictor of land and atmosphere inter-
uary 2021; http://www.esa-soilmoisture-cci.org/, last access:       actions. Analyzing a shallow soil layer can provide key in-
15 January 2021), which provides soil moisture estimates for        formation about the detection of soil aridity conditions that
the first 0–5 cm of soil depth (Liu et al., 2011). Even though      are directly related to the loss of soil biodiversity and, there-

Nat. Hazards Earth Syst. Sci., 21, 879–892, 2021                                      https://doi.org/10.5194/nhess-21-879-2021
F. Lopes Ribeiro et al.: The impact of drought on soil moisture trends across Brazilian biomes                                   881

fore, to soil productivity. Thus, soil moisture at the surface           The Amazon biome is mainly characterized by rainforest
is directly affected by drought conditions and could be also          areas (Overbeck et al., 2015). It represents 49.5 % of Brazil’s
used as an indicator (i.e., proxy) of the water contained at          total area, or 4 196 943 km2 (IBGE, 2019). It has an equa-
deeper layers. Since we cannot measure in situ soil moisture          torial climate, with temperatures between 22 and 28 ◦ C, and
at high spatial resolution due to logistical constraints (i.e., be-   has torrential rains distributed throughout the year. The ge-
cause it is expensive or time consuming), we propose the use          omorphology of the Amazon biome is quite diverse, pre-
of multiple satellite remote sensing sensors (e.g., from ESA          senting plateaus, plains and depressions. Soils are generally
or NASA) as an alternative to obtain drought-relevant infor-          clayey and iron-rich and have a high soil organic carbon con-
mation on soil moisture at the national scale. The study pe-          tent. The Amazon biome is well known for its biodiversity
riod (2009–2015) was marked by successive droughts across             and its large number of rivers and waterbodies, which ac-
Brazil, registered and confirmed by different monitoring in-          count for the world’s greatest surface green water reserves
struments such as the Integrated Drought Index (IDI), which           (IBGE, 2004).
combines the Standardized Precipitation Index (SPI) and the              The Atlantic Forest biome covers 13 % of the total area
Vegetation Health Index (VHI) (Cunha et al., 2019a, b), and           of Brazil (1 110 182 km2 ). It comprises an environmental
municipal emergency declarations all over the country.                heterogeneity that incorporates high elevations, valleys and
   The purpose of this study is to show the advantages and            plains. The Atlantic rainforest occupies the whole continen-
disadvantages of integrating satellite soil moisture observa-         tal Atlantic coast of Brazil. This biome has a subtropical cli-
tions into drought monitoring across Brazil on a biome basis.         mate in the south and a tropical climate in central and north-
We show the differential impact of drought on the soil mois-          eastern portions. The Atlantic rainforest is characterized by
ture of different biomes at a national scale (using Brazil as a       heavy rainfall influenced by its proximity to the ocean and
case study).                                                          winds that blow inward over the continent (IBGE, 2004). Al-
   The main limitations are that satellite measurements of soil       though it is just a small fraction of the size of the Amazon
moisture provide indirect estimates of soil moisture across           rainforest, the Atlantic Forest biome still harbors a range of
large areas of around > 25 km grids and that these estimates          biological diversity comparable to that of the Amazon biome
are representative only in the topsoil (e.g., 0–5 cm) and un-         (The Nature Conservancy, 2015), with high soil carbon re-
fortunately do not provide a direct metric of soil water stor-        serves (Guevara et al., 2018). The Atlantic Forest biome is
age. While soil moisture at the surface is a key indicator of         recognized as the most degraded biome of Brazil with only
soil and atmosphere interactions, topsoil moisture does not           12 % of the original biome preserved (SECOM, 2012).
account entirely for the water used by plants to grow. The               The Caatinga biome is the driest of Brazil and comprises
capacity of plants to grow can be measured also with satel-           an area of 844 453 km2 stretching over nine federal states and
lite information in the form of primary productivity estimates        covering nearly 10 % of the total area of Brazil (IBGE, 2019).
(Li and Xiao, 2019). Therefore, we also explore the corre-            A semiarid climate is predominant across this biome (BSh
spondence between satellite soil moisture and primary pro-            type) with an average annual rainfall below 800 mm (Alvares
ductivity trends for each biome in Brazil. Both soil mois-            et al., 2013), but high temperatures influence high potential
ture and vegetation productivity are ecosystem variables di-          evapotranspiration rates that exceed 2500 mm yr−1 (Campos,
rectly affected by drought conditions. Understanding how              2006). Overall, the Caatinga biome is characterized by re-
soil moisture and vegetation productivity in each biome is af-        duced water availability and a very limited storage capac-
fected by drought conditions from different perspectives (in          ity of rivers, which are mainly intermittent, with just a few
our case superficial soil moisture) is crucial to assessing their     exceptions that are perennial through streamflow regulating
resilience. It is also important to provide evidence-based ori-       reservoirs during the dry season (CENAD, 2014). Caatinga
entations to drought mitigation and soil conservation plans.          soils are generally shallow (0–50 cm), with a bedrock that is
                                                                      commonly exposed to the surface, limiting water infiltration
                                                                      processes and the recharge of local aquifers (Cirilo, 2008).
2     Methodology                                                        The Cerrado biome is the second largest of Brazil and is
                                                                      characterized by large savannahs (Overbeck et al., 2015) cov-
2.1    Study area
                                                                      ering 2 036 448 km2 and representing 23.3 % of the country
Brazil is the largest country in Latin America, with a total          (IBGE, 2019). It extends from the central south of Brazil
area of 8 456 510 km2 , and is located between 05◦ 100 N to           to the northern coastal strip, interposing between the Ama-
33◦ 440 S (IBGE, 2017). The continental dimension of the              zon, Pantanal, Atlantic Forest and Caatinga biomes (IBGE,
country implies a complex spatial heterogeneity of envi-              2004). The dominant climate in the Cerrado biome is warm
ronmental conditions resulting in six main biomes: Ama-               tropical subhumid, with only two distinct seasons, dry win-
zon, Atlantic Forest, Caatinga, Cerrado, Pampa and Pantanal           ters and wet summers with torrential rains (Overbeck et al.,
(Fig. 3a).                                                            2015). The annual precipitation in this region varies be-
                                                                      tween 600 and 2200 mm, where the bordering areas with the
                                                                      Caatinga biome are the driest and the bordering areas with

https://doi.org/10.5194/nhess-21-879-2021                                      Nat. Hazards Earth Syst. Sci., 21, 879–892, 2021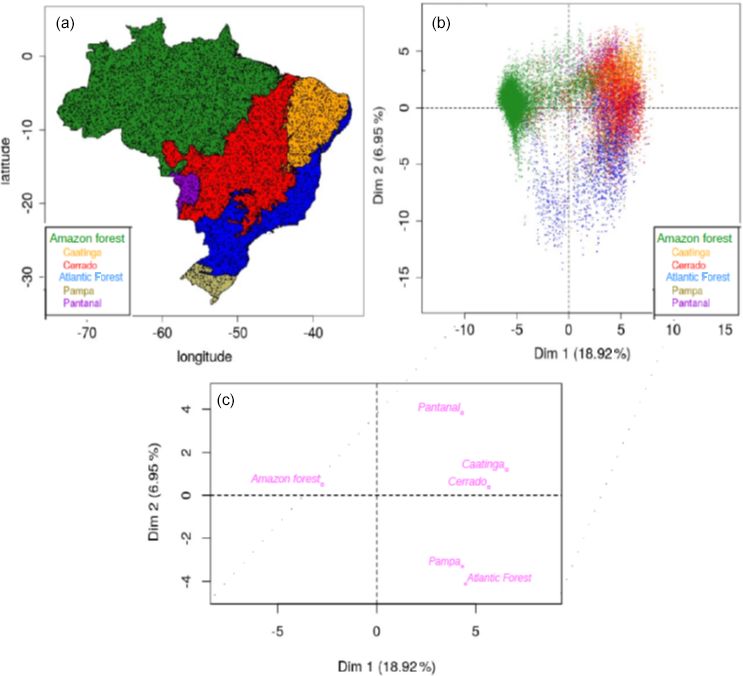
882                        F. Lopes Ribeiro et al.: The impact of drought on soil moisture trends across Brazilian biomes

the Amazon rainforest are the wettest. Soils are diverse and       biomes. PCA is an analysis where a group of potentially cor-
include a variety of dystrophic (low inherent fertility and/or     related variables are decomposed in orthogonal space and
strongly weathered profile), acidic and aluminum-rich con-         therefore uncorrelated principal components. PCA analysis
ditions. Currently, the Cerrado biome hosts the largest rural      is useful to reduce data dimensionality to avoid the potential
expansion in Brazil, resulting in environmental degradation,       effects of statistical redundancy (multicollinearity) in further
biodiversity loss, and soil erosion and limited water availabil-   interpretations. Here, we use the PCA as an exploratory tech-
ity. It is classified as the most endangered savannah on the       nique to visualize, characterize and interpret the environmen-
planet and one of the 34 global hotspots (Ioris et al., 2014).     tal variability of Brazil’s biome and assume that environmen-
   The Pampa biome is located at the extreme south of Brazil       tal differences in the biomes could support the hypothesis of
and covers 2.1 % of Brazil’s total area (176 496 km2 ). It is      different soil moisture responses to drought.
mainly characterized by grasslands and shrublands (Over-
beck et al., 2015). The region has a wet subtropical climate,      2.3   Municipal emergency declarations due to drought
characterized by a rainy climate throughout the whole year,              across Brazil
with hot summers and cold winters, where temperatures fall
below freezing (IBGE, 2004). The Pampa biome comprises             Municipal emergency declarations (MEDs) are administra-
an environmental set of different lithology types and produc-      tive tools to inform the federal government that the magni-
tive soils (e.g., carbon-rich), mainly under flat and smooth       tude of a disaster has surpassed local public capacities to re-
undulating terrain surfaces.                                       spond and manage the crisis. The recognition of MEDs by
   The Pantanal biome has the smallest territorial extension       the federal government is based on field visits (when pos-
of Brazil, covering 1.8 % (150.355 km2 ) of the country’s to-      sible) and technical analysis of social, economic and clima-
tal area (IBGE, 2004). It is located at the left margin of         tological data that can support the petition. In the case of
the Paraguay River and is shared by Brazil, Bolivia and            drought, data analysis is generally based on, but not limited
Paraguay.                                                          to, private agricultural losses, level of local reservoirs and
   The Pantanal biome is by a vast extent of poorly drained        precipitation data combined. Once the federal government
lowlands and experiences annual flooding from summer to            recognizes that there is indeed a disaster, it establishes a le-
fall months (January–May) (Assine and Soares, 2004). The           gal situation where federal funds can be used to assist the
climate of the Pantanal biome is hot and humid during the          affected population and recover essential services disrupted
summer and cold and dry in winter (Ioris et al., 2014). Pre-       by the disaster (National Secretary of Civil Defense and Pro-
cipitation varies from 1000 to 1400 mm yr−1 , and rains are        tection of Brazil, 2017).
predominant from November to April. Average annual tem-               To determine drought distribution across the six Brazilian
perature is 32 ◦ C, but the dry season (May to October) has        biomes, we retrieved official MEDs due to drought in Brazil
an average temperature of 21 ◦ C, and it is not uncommon           from 2009 to 2015. This information is public and can be ac-
to have > 100 d without rain (Ioris et al., 2014). In the last     cessed on the website of the Ministry of National Integration
2 decades, temperature in the Pantanal has consistently risen,     of Brazil. First, we downloaded the historical series of MEDs
and events more humid than normal and dryer than normal            in Brazil from 2009 to 2015. Then, we isolated the munici-
have both increased (Marengo et al., 2010).                        palities who declared emergency or public calamity due to
                                                                   drought from all other disasters. The last step was to cross
2.2   Environmental variability of Brazilian biomes                these data with the boundaries of the six Brazilian biomes
                                                                   and discover the intensity and distribution of drought in each
We used 1×1 km environmental gridded data to characterize          biome during the study period.
the environment variability of the biomes. Data were pro-
vided by http://worldgrids.org/ (last access: 13 August 208),      2.4   Soil moisture and primary productivity trends
an initiative of ISRIC – World Soil Information (International           across Brazil
Soil Reference and Information Centre). This dataset com-
piled information from: (1) digital terrain analysis to repre-     To analyze soil moisture trends during a period of succes-
sent topographic gradients, (2) gridded climatology products       sive droughts (2009–2015) across Brazilian biomes, we ac-
(e.g., precipitation and temperature), (3) remote sensing im-      quired remotely sensed soil moisture information from the
agery to represent land cover and vegetation spatial variabil-     European Space Agency (Liu et al., 2011). This soil moisture
ity, and (4) legacy soil or rock type maps. We used 110 layers     product has a daily temporal coverage from 1978 to 2016 and
derived from this dataset. A list of all available information     a spatial resolution of 0.25◦ (∼ 27 × 27 km grids). To repre-
contained in the worldgrids.org project is available in Reuter     sent vegetation primary productivity we use estimates from
and Hengl (2012). We used multivariate statistics in the form      the OCO-2-based (Orbiting Carbon Observatory 2) SIF prod-
of principal component analysis (PCA) to linearly decom-           uct GOSIF (global Orbiting Carbon Observatory 2 Solar-
pose the worldgrids.org dataset and identify relationships         Induced Fluorescence dataset; OCO-2 SIF) and linear re-
among the major environmental characteristics of Brazilian         lationships between SIF (solar-induced chlorophyll fluores-

Nat. Hazards Earth Syst. Sci., 21, 879–892, 2021                                    https://doi.org/10.5194/nhess-21-879-2021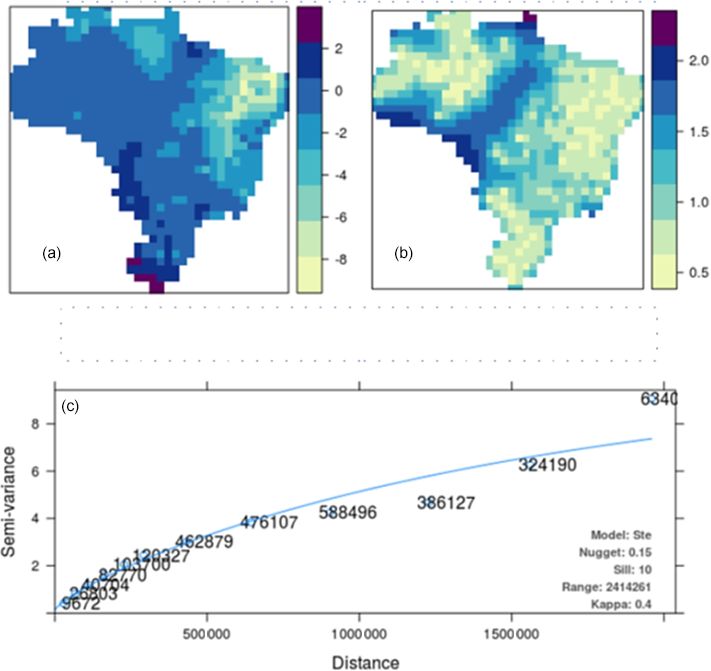
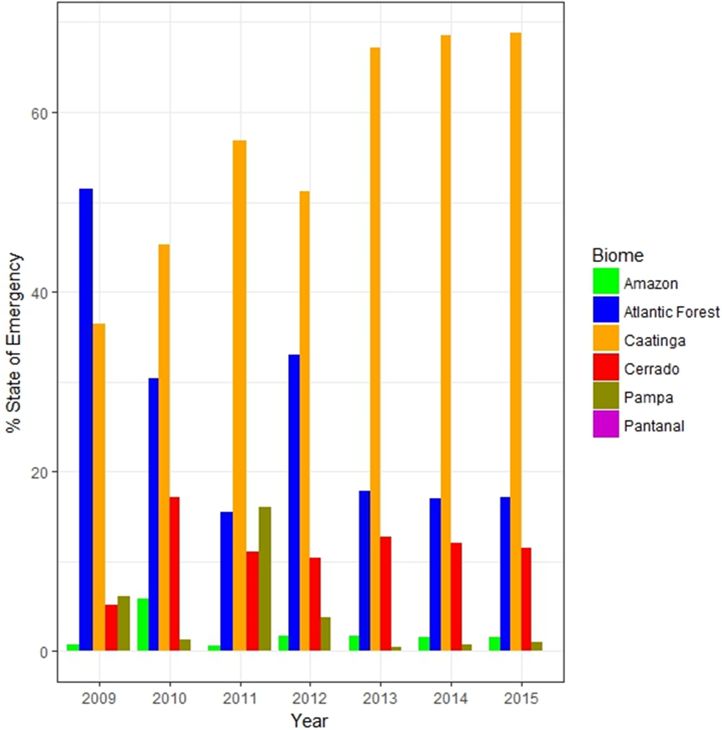
F. Lopes Ribeiro et al.: The impact of drought on soil moisture trends across Brazilian biomes                                  883

cence) and GPP (gross primary production) used by Li and
Xiao (2019) to map GPP globally at a 0.05◦ spatial resolution
and 8 d time step. We calculated monthly averages from soil
moisture and primary vegetation datasets for further statisti-
cal analysis using only information between 2009 and 2015.
All available information was harmonized into a geographi-
cal information system using the same projection system and
spatial integrity.

2.5   Data analysis

We based our statistical analysis on a regression matrix con-
taining 10 000 representative random spatial locations (e.g.,
latitude and longitude) across the biomes of Brazil (Fig. 3b),
which were selected using standard resampling techniques
(i.e., bootstrapping). Over 30 % of the area of every biome is
represented in the random selection. We randomize our sta-
tistical sampling with the ultimate goal of maximizing the
accuracy of the results. We used a representative sample for
improving the visualization of point clouds and a better un-
derstanding of differences on the five biomes in the statisti-
cal multivariate space. Finally, we extracted to these random      Figure 2. Percentage of municipalities declaring emergency or pub-
points the environmental data and the values of the available      lic calamity due to drought in Brazil from 2009 to 2015.
satellite soil moisture and primary productivity time series.
   To detect trends on satellite soil moisture and primary
productivity time series during the study period, we used          a geostatistical framework (Hiemstra et al., 2009; Llamas et
median-based linear models calculated for each point with          al., 2020). In contrast, the primary productivity dataset used
available satellite data. These non-parametric analyzes are        here has complete coverage across Brazil. We show both the
known as Theil–Sen regressions (Sen, 1968; Theil, 1992)            interpolated maps of soil moisture trends and the trend map
with repeated medians (Siegel, 1982). This method uses a           of the primary productivity of vegetation.
robust estimator for each point in time, where the slopes be-
tween it and the other points are calculated (resulting n − 1      3     Results and discussion
slopes), and then the median and the significance of the trend
are reported.                                                      3.1    Drought in Brazil from 2009 to 2015
   The satellite soil moisture source has intrinsic quality lim-
itations across areas where vegetation has more water than         This analysis of municipal emergency declarations (MEDs)
soil (McColl et al., 2017), including areas across the lower       confirmed that the period from 2009 to 2015 was, indeed,
Amazon watershed, the Pantanal or Pampa biomes. For these          marked by successive droughts countrywide (Fig. 2). During
areas we used the sparse points with available satellite soil      this period, Brazil had a total of 12 508 declarations of emer-
moisture information and generated predictions of soil mois-       gency or public calamity due to drought all over its territory
ture trends based on geostatistical analyses, such as vari-        (Ministry of National Integration of Brazil, 2018), which di-
ogram fitting and ordinary Kriging modeling. Ordinary Krig-        rectly affected 33 million people and caused economic losses
ing modeling assumes that the target variable (soil moisture       of around USD 6.5 billion (EM-DAT, 2018).
trends) is controlled by a random field (the main reason why          Proportionally, the Caatinga biome had the most MEDs
we base our analysis on a random-sampling strategy) that           per municipality, followed by the Atlantic Forest, Cerrado,
shows a quantifiable level of spatial structure and autocor-       Pampa and Amazon biomes, respectively (Fig. 2). The only
relation (Hiemstra et al., 2009). We performed an automatic        biome with no MEDs due to drought during this period is the
variogram analysis to assess the spatial structure and auto-       Pantanal biome, which is a natural wetland that covers only
correlation of satellite soil moisture records. For the vari-      1.8 % of the national territory (Overbeck et al., 2015).
ogram analysis we computed the relationships between the              When considering climatological data from the Inte-
distance of randomly distributed soil moisture observations        grated Drought Index (IDI), which combines the Standard-
and the accumulated variance of their respective values. We        ized Precipitation Index (SPI) and the Vegetation Health
used the aforementioned relationships to predict the satellite     Index (VHI), Cunha et al. (2019a, b) discovered that
soil moisture trend in areas where no data are available and       since 1962, when drought events started to be recorded in
also provided a spatially explicit measure of error following      Brazil, only between 2012 and 2014 droughts occurred con-

https://doi.org/10.5194/nhess-21-879-2021                                     Nat. Hazards Earth Syst. Sci., 21, 879–892, 2021
884 F. Lopes Ribeiro et al.: The impact of drought on soil moisture trends across Brazilian biomes
currently in the six biomes of the country. The IDI also 3.3 Drought assessment: soil moisture trends across
showed that the hydrological year of 2011/12 (October 2011 Brazilian biomes
to September 2012) was the driest of the historical series,
except in the southern region, where the Pampa biome is Our analysis of satellite soil moisture at the national level
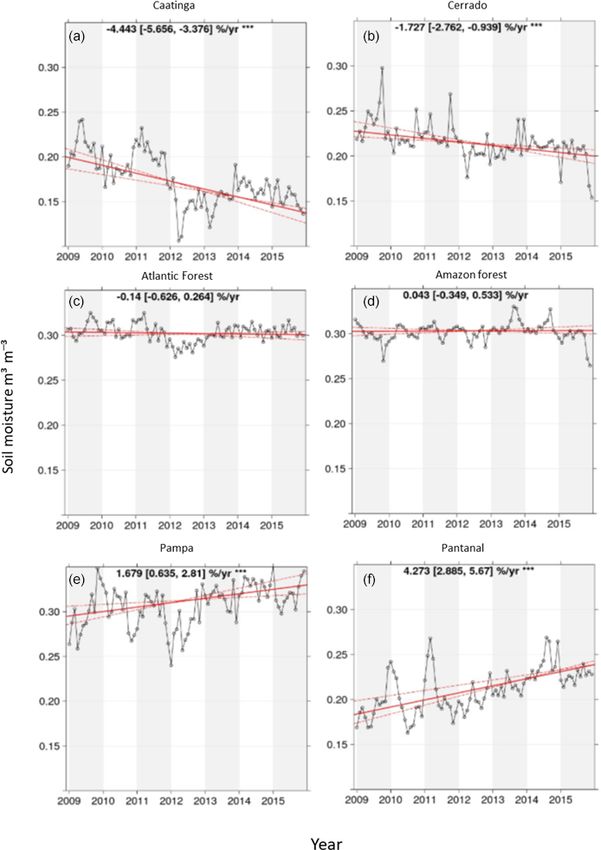
located. During the period of study (2009–2015), the most showed a soil moisture decline of −0.5 % yr−1 (p < 0.1) in
severe drought events occurred in the northeastern region Brazil from 2009 to 2015 (Fig. 4).
(where the Caatinga biome predominates), in the central- When considering variations of soil moisture per biome,
western region (where the Cerrado biome predominates) and our data suggest that the largest soil moisture decline in
in the southeastern region (where there is a mix of the Cer- Brazil was found in the Caatinga biome with a persistent neg-
rado and Atlantic Forest biomes). Even though the clima- ative trend – −4.4 % in soil moisture per year (p < 0.001) –
tological data from the IDI show some inconsistencies with from 2009 to 2015 (Fig. 5a). In contrast, the Amazon, Cer-
the MEDs per biome, in general terms, it reinforces that the rado and Atlantic Forest biomes showed no significant trend
study period was marked by simultaneous droughts across all on soil moisture. The Pampa and Pantanal biomes showed
biomes of Brazil. a significant increase in soil moisture of 1.6 % yr−1 and
4.3 % yr−1 (p < 0.001), respectively, during the same period
3.2 Environmental gridded information of Brazilian (Fig. 5e and f). Thus, the combination of environmental vari-
biomes ables and satellite soil moisture records was able to identify
drought-dominated areas such as the Caatinga and Cerrado
The environmental characterization of Brazilian biomes biomes from water-surplus-dominated areas, such as the Pan-
showed a clear differentiation of three major groups (Fig. 3a tanal and Pampa biomes. These results are also useful to pre-
and b). These results support the expectation that drought vent agricultural risk from water failure (decline or surplus)
would have a differential impact on soil moisture dynamics and monitor important ecosystem services of large and more
in each of the six biomes (see Sect. 3.3). This expectation is inaccessible areas such as the Amazon forest and the Cerrado
supported because each biome shows differences in the spa- biome (Fig. 3).
tial configuration of environmental soil moisture drivers, as A closer analysis of satellite soil moisture trend in the
revealed by the PCA analysis (Fig. 3b) as described below. Caatinga biome shows that this biome did not fully recover
From the 110 environmental layers of information we used from an accentuated soil moisture decrease in 2012 (Fig. 5a).
to represent the major environmental conditions across Brazil After 2012, there was a slight recovery of soil moisture
(these covariates are described in previous work, Guevara et in 2013, yet a negative trend remains in the following years,
al., 2018), at least 50 principal components were needed to most likely because the below-average annual precipitation
capture > 80 % of total variance. The first and second com- from 2013 to 2015 (Cunha et al., 2019a) coupled with hu-
ponent explained > 25 % of variability (Fig. 3b), and the man activities commonly found within the boundaries of this
variables that represented most of the variance in the first biome such as deforestation, unsustainable irrigation and wa-
and second components were the digital elevation model ter abstraction (Medeiros, 2012; Travassos and De Souza,
(r = 0.5) and the topographic wetness index (r = 0.31), re- 2014). As highlighted by Cunha et al. (2015) intense drought
spectively. These two variables are directly related to the spa- events can reduce the vegetation resiliency, rendering plants
tial variability of soil moisture dynamics as seen in other more vulnerable to a recurring disturbance. Furthermore, the
regional studies (Guevara and Vargas 2019). Across these vegetation can be durably affected by a drought if the drought
principal components (i.e., PC1 and PC2; PCs), we found is preceded by another dry year that could substantially re-
a clear separation of three major groups of data in the sta- duce gross primary productivity and other ecosystem pro-
tistical space (Fig. 3c). The Amazon biome forms the largest cesses (Vargas, 2012).
group of values, followed by another group composed mainly Consistent with previous studies (Zeri et al., 2018) pre-
of the Atlantic Forest and Pampa biomes. The Caatinga and cipitation data indicate that the years 2011, 2012, 2014 and
Cerrado biomes form a third larger group, and the remain- 2015 have been drier as compared to the previous decades.
ing Pantanal biome shows a close but independent variability Marengo et al. (2017) also confirmed that, from 2012
(Fig. 3c). These groups are located in different quadrants of to 2015, drought affected hundreds of cities and rural ar-
the plane between the first two PCs (Fig. 3c). Thus, these eas with devastating impacts on the agricultural production
differences could influence soil moisture response in these and water supply. Regarding human activities, data from the
major groups at the biome level. National Institute for Space Research (INPE, 2018) reveals
that 45 % of the Caatinga biome is degraded and that 7.2 %
of its soil is already exposed. In addition, the Caatinga has
been exposed to continuous land cover changes, and less
than 1 % of the region is a strictly protected area (Leal et al.,
2005; Kolker, 2013). Thus, our results (a) provide insights
into identifying geographical areas that could be preserved
Nat. Hazards Earth Syst. Sci., 21, 879–892, 2021 https://doi.org/10.5194/nhess-21-879-2021
F. Lopes Ribeiro et al.: The impact of drought on soil moisture trends across Brazilian biomes                                    885

Figure 3. (a) The six biomes of Brazil. (b) Plane of the first and second PCAs showing the orthogonal and environmental variability of
Brazil’s biomes and (c) clustering results showing the main values of each biome dataset and their proximity across the PC1 and PC2.

                                                                     vegetation and soils of the Caatinga biome are exposed to
                                                                     8–10 dry months every year (Santos et al., 2014), and more
                                                                     than 90 % of the Caatinga biome is non-forest vegetation.
                                                                     Just ∼ 20 % of the biome has native vegetation, which is
                                                                     better adapted to support drought events and store higher
                                                                     amounts of water (Santos et al., 2014; Overbeck et al., 2015).
                                                                     Tomasella et al. (2018), using NDVI (Normalized Differ-
                                                                     ence Vegetation Index) values for high density vegetation
                                                                     and bare soil, showed that recurrent droughts are accelerating
                                                                     the degradation and desertification processes in the Caatinga
                                                                     biome.
                                                                        The combination of these regional factors together with
                                                                     the effect of teleconnections such as the ENSO (El Niño–
                                                                     Southern Oscillation) and other land atmosphere interactions
Figure 4. Brazilian soil moisture trend from 2009 to 2015.           (Kouadio et al., 2012) make the Caatinga biome in Brazil the
                                                                     most vulnerable biome to the recurrent droughts and conse-
                                                                     quently, prolonged soil moisture deficit condition (Marengo
due to their capacity for providing blue and green water and         et al., 2017).
(b) could be part of a monitoring system for optimizing the             Therefore, we highlight the need to include urgent ac-
limited water inputs and supply in this semiarid ecosystem           tions such as reforestation and efficient use of underground
(i.e., for agricultural planning).                                   water into drought mitigation plans for this biome to re-
   Persistent and prolonged soil moisture decline could also         duce future soil moisture decline. It is noteworthily that this
negatively affect the Caatinga biome’s biodiversity, one of          biome is already presenting agricultural deficits and deserti-
the world’s plant biodiversity centers (Leal et al., 2005). The      fication areas due to natural and anthropogenic phenomena

https://doi.org/10.5194/nhess-21-879-2021                                      Nat. Hazards Earth Syst. Sci., 21, 879–892, 2021
886 F. Lopes Ribeiro et al.: The impact of drought on soil moisture trends across Brazilian biomes Figure 5. Soil moisture trends across Brazil. (a) Caatinga (n = 921), (b) Cerrado (n = 2410), (c) Atlantic Forest (n = 1394), (d) Amazon (n = 4819), (e) Pampa (n = 231) and (f) Pantanal (n = 179). The values in every graph show the slope percentages of changes. Red solid lines show the mean trend, and red dashed lines show the standard deviation trend. ∗∗∗ (p < 0.01). (Nascimento and Alves, 2008; Sheffield and Wood, 2008; sion and local desertification processes that influence low Medeiros, 2012; Travassos and De Souza, 2014). As an ex- agricultural productivity due to diminishing soil moisture ample, while studying the desertification process in part of and quality of the soil (Nascimento and Alves, 2008). the Caatinga biome, D’Souza et al. (2008) found high levels The Atlantic Forest biome did not show significant posi- of social, economic and technological vulnerabilities which tive or negative trends in soil moisture variation during the could be directly associated with removal of the natural studied period. It registered, however, the greatest ups and vegetation covering and forest fires for subsistence agricul- downs in soil moisture from 2009 to 2015, with high peaks ture. These human-induced changes on soil moisture in the (2009, 2011 and 2013) followed by abrupt declines in a rel- Caatinga biome are also related to the occurrence of soil ero- atively short time period. After the most intense period of Nat. Hazards Earth Syst. Sci., 21, 879–892, 2021 https://doi.org/10.5194/nhess-21-879-2021
F. Lopes Ribeiro et al.: The impact of drought on soil moisture trends across Brazilian biomes                                887

soil moisture decline in the Atlantic Forest biome (2009–             The Pantanal biome also showed a positive soil mois-
2012), this biome quickly bounced back to previous levels          ture trend of 4.3 % yr−1 (p < 0.001) from 2009 to 2015,
of soil moisture, showing capacity to recover from intense         the highest positive trend among all biomes. From 2009
soil moisture losses in less than 12 months.                       to 2011, there were two extreme events characterized by sud-
   The Amazon biome showed no significant trend of satellite       den soil moisture increases immediately followed by abrupt
soil moisture data during the analyzed period (Fig. 4d), prob-     soil moisture declines. After these two extreme events, a
ably due to data limitations (i.e., data gaps) associated with     more stable and consistent positive soil moisture trend was
a lack of satellite-derived information (see “Methodology”).       registered from 2011 to 2014. Even though there was a sub-
Field-based evidence collected by Anderson et al. (2018)           tle decline in the soil moisture by the end of 2014, this biome
showed a wide range of impacts of drought on the Amazon            kept an overall positive trend during 2015.
forest structure and functioning (e.g., widespread tree mor-          The Pantanal and Pampa biomes are both subhumid aeo-
tality and increased susceptibility to wildfires) in 2016 after    lian plains, which make them more susceptible to experienc-
the 2015 drought, which affected approximately 46 % of the         ing flood events covering a significant fraction of the land-
Brazilian Amazon biome. However, considering the size and          scape for months or even years (Kuppel et al., 2015). Even
differences in topography in the Amazon biome, the eastern         though our data seem congruent with inundations registered
and western areas of the Amazon rainforest may respond dif-        in the Pantanal biome in the beginning of 2011, when the
ferently to drought due to differences in climate conditions       soil moisture trend reached its highest point for the Pantanal
and therefore, different sensibility to soil moisture decline.     biome during the studied period, it did not capture a reduc-
The western portion of the Amazon biome shows higher               tion of 81 % of the total flooded area for the Pantanal biome
soil moisture values (and potentially positive soil moisture       in 2012, when there was a reduction of 18 % in annual pre-
trends) than the eastern region (Fig. 6a and b). This result       cipitation (Moraes et al., 2013). In contrast, our data showed
is consistent with previous findings describing differences in     a consistent positive trend throughout 2012, even though all
drought response from eastern and western portions of this         months of the wet season in 2012 had a decrease in precipi-
biome (Duffy et al., 2015), suggesting that soil moisture con-     tation ranging from −28.6 % in the beginning to −12.1 % in
servation plans and drought mitigation strategies in the Ama-      the end of the wet season (Moraes et al., 2013). These results
zon biome should consider the heterogeneity of the region          suggest that, although the analyzed period is characterized by
and the different soil moisture feedback from the eastern and      a sequence of dry spells across Brazil (Marengo et al, 2017),
western portions of this biome.                                    some areas such as the Pantanal region were able to accumu-
   The Pampa biome showed a positive trend of ∼ 1.6 % yr−1         late soil moisture during that time.
(p < 0.001) during the analyzed period (Fig. 5e) but with             Detecting an increase in soil moisture does not mean that
three distinct periods. The year 2009 registered a recovery        these biomes should receive less attention to drought and soil
period of a positive soil moisture trend followed by a steady      conservation plans. From 2009 to 2015, the Pampa biome al-
soil moisture decline until its lowest point in the beginning      ways had a representative municipality declaring emergency
of 2012. Then, this biome started a consistent recovery pro-       due to drought and has constantly reported economic losses
cess surpassing previous values of the soil moisture trend         in the agricultural sector. The Pantanal biome, during the
registered before 2013, showing great capacity to recover          same period, was not directly impacted by drought at the
soil moisture after periods of drought. Cunha et al. (2019a)       municipal level, but the highly positive soil moisture trend
showed that in 2012 most of the southern region of Brazil          deserves further study to understand how it impacts the local
presented drought conditions over an extensive area, with          ecosystem, as well as agricultural practices and cattle rais-
the highest intensity recorded in August 2012. This intense        ing with the ultimate goal of improving food security across
drought affected the water supply in the rural properties and      Brazil.
the agricultural and livestock production.                            Our results support our main hypothesis as we have found
   Even though the Pampa biome has more than 60 % of               evidence that each of the six Brazilian biomes registered dif-
its biome degraded, especially for cattle raising (Santos and      ferent soil moisture feedbacks to drought during the analyzed
Silva, 2012), our data show that it is gradually increasing soil   period (2009–2015). In practical terms, it means that drought
moisture even during a period of successive droughts across        response and mitigation plans, as well as soil conserva-
Brazil. Literature on soil moisture of the Pampa biome char-       tion strategies, should consider both differences among and
acterizes this biome as highly vulnerable to water and wind        within each biome of Brazil and concentrate efforts and re-
erosion (Roesch et al., 2009), making it susceptible to soil       sources on preserving or recovering the regions with greater
moisture decline (Duffy et al., 2015). On the other hand, ex-      susceptibility to lose soil moisture during periods of drought.
tended flat landscapes, like the Pampa biome, show low lat-        Confirming the value of satellite soil moisture signals moni-
eral water transport as a result of low surface runoff and slow    toring drought-related patterns, we observe the similar trends
groundwater fluxes, making this biome more suitable to ac-         of soil moisture and the primary productivity of vegetation
cumulating surface water for long periods of time (Kuppel et       across Brazil.
al., 2015).

https://doi.org/10.5194/nhess-21-879-2021                                   Nat. Hazards Earth Syst. Sci., 21, 879–892, 2021
888                         F. Lopes Ribeiro et al.: The impact of drought on soil moisture trends across Brazilian biomes

Figure 6. Geostatistical analysis (ordinary Kriging modeling with automatic variogram fitting) of satellite soil moisture across Brazil
from 2009 to 2015. (a) The trend prediction of soil moisture for 2009–2015. (b) The Kriging variance (error map). (c) Variogram fitting
parameters and spatial autocorrelation model (blue line) supporting the soil moisture prediction. The numbers around the blue line are the
pairs of points available for the interpolation at a specific distance (x axis).

3.4   Primary productivity trends across Brazil                        across the Amazon forest were less evident or not signifi-
                                                                       cant. Our results support the use of satellite soil moisture and
                                                                       primary productivity trends as accurate indicators of drought
We confirm the consistency of our results comparing trends             conditions across Brazilian biomes.
of satellite soil moisture with trends calculated using the
primary productivity (or GPP) datasets. Our results show
that all biomes experienced positive and negative trends of            4   Conclusion
vegetation productivity during the analyzed period of time
(Fig. 7). We observe that the major surface of negative trends         The results of this research reveal an important environmen-
of primary productivity of vegetation is across the Caatinga           tal vulnerability to drought across Brazil. From 2009 to 2015,
biome and its intersection with both the Cerrado and Atlantic          there was a national decline of soil moisture with a rate of
Forest biomes. The Pampa and Pantanal biomes are those                 0.5 % yr−1 . Among all six biomes, the Caatinga biome pre-
with higher surfaces of positive primary productivity trends           sented the most severe soil moisture decline (−4.4 % yr−1 ),
(Fig. 7).                                                              suggesting a need for immediate local soil and water con-
   These results are consistent with the soil moisture trends          servation activities. The Atlantic Forest and Cerrado biomes
described for each biome (Fig. 5). The Caatinga biome had              showed no significant soil moisture trends but should be
the highest soil moisture decline and highest primary produc-          closely monitored for their importance to national food
tivity decline. The Cerrado and Atlantic Forest biomes also            and water security and environmental balance. The Amazon
experienced decline in soil moisture and primary productiv-            biome also showed no soil moisture trend but had a sharp
ity. In contrast, the Pampa and Pantanal biomes experienced            reduction of soil moisture from 2013 to 2015. It is note-
an increase in soil moisture levels and increase in primary            worthy that soil moisture from eastern and western portions
productivity rates (Fig. 8). Changes in primary productivity           of the Amazon biome may respond differently to drought.

Nat. Hazards Earth Syst. Sci., 21, 879–892, 2021                                         https://doi.org/10.5194/nhess-21-879-2021
F. Lopes Ribeiro et al.: The impact of drought on soil moisture trends across Brazilian biomes 889
Figure 7. Trends of primary productivity of vegetation based on the GOSIF dataset between 2009 and 2015. Areas in black are non-
significant.
This study provides insights into the potential benefits of in-
tegrating satellite soil moisture data into drought monitoring
and early warning systems and soil conservation plans at na-
tional and local levels.
Code availability. All code is available at
https://doi.org/10.5281/zenodo.4587957 (Guevara et al., 2021).
Author contributions. FLR and MG conceived the presented idea.
FLR, MG, AVL and RV developed the theory and wrote the first
version of the paper. MG performed the data analysis. APC and
MZ verified the analytical methods and supervised the findings of
this work. All authors discussed the results and contributed to the
final version of the paper.
Figure 8. Primary productivity trends across Brazilian biomes
based on the GOSIF GPP product across the analyzed period of Competing interests. The authors declare that they have no conflict
time (2009–2015). of interest.
Acknowledgements. Flavio Lopes Ribeiro acknowledges individ-
The western portion of the Amazon biome shows potentially ual scholarship support from CNPq, the Science without Borders
more positive soil moisture trends than the eastern region. In program of the Brazilian federal government. Mario Guevara and
contrast, the Pampa and Pantanal biomes presented a positive Alma Vázquez-Lule acknowledge individual fellowship support
soil moisture trend (1.6 % yr−1 and 4.3 % yr−1 , respectively), from CONACyT. Rodrigo Vargas acknowledges support from the
which should also be constantly monitored considering the National Science Foundation (CIF21 DIBBs; grant no. 1724843).
susceptibility of these biomes to floods.
These results are consistent with primary productivity
trends (Fig. 8), supporting the effectiveness of satellite soil Review statement. This paper was edited by Paolo Tarolli and re-
moisture data to monitor drought impacts at a biome level. viewed by two anonymous referees.
https://doi.org/10.5194/nhess-21-879-2021 Nat. Hazards Earth Syst. Sci., 21, 879–892, 2021890 F. Lopes Ribeiro et al.: The impact of drought on soil moisture trends across Brazilian biomes
References Duffy, P. B., Brando, P., Asner, G. P., and Field, C. B.: Pro-
jections of future meteorological drought and wet periods in
the Amazon, P. Natl. Acad. Sci. USA, 112, 13172–13177,
Al-Kaisi, M. and Rattan, L.: Conservation Agriculture Sys- https://doi.org/10.1073/pnas.1421010112, 2015.
tems to Mitigate Climate Variability Effects on Soil Health, EM-DAT: The Emergency Events Database Université Catholique
in: Soil Health and Intensification of Agroecosytems, edited de Louvain (UCL) – CRED, D. Guha-Sapir, Brussels, Belgium,
by: Al-Kaisi, M. and Lowery, B., Academic Press, 79–107, available at: https://www.emdat.be/ (last access: 16 March 2020),
https://doi.org/10.1016/B978-0-12-805317-1.00004-X, 2017. 2018.
Alvares, C. A., Stape, J. L., Sentelhas, P. C., Gonçalves de Moraes, Guevara, M. and Vargas, R.: Downscaling satellite soil moisture
J. L., and Sparovek, G.: Köppen’s climate classification map for using geomorphometry and machine learning, PloS One, 14,
Brazil, Meteorol. Z., 22, 711–728, https://doi.org/10.1127/0941- e0219639, https://doi.org/10.1371/journal.pone.0219639, 2019.
2948/2013/0507, 2013. Guevara, M., Olmedo, G. F., Stell, E., Yigini, Y., Aguilar Duarte, Y.,
Anderson, L. O., Ribeiro Neto, G., Cunha, A. P., Fonseca, M. Arellano Hernández, C., Arévalo, G. E., Arroyo-Cruz, C. E., Bo-
G., Mendes de Moura, Y., Dalagnol, R., Wagner, F. H., and livar, A., Bunning, S., Bustamante Cañas, N., Cruz-Gaistardo, C.
Cruz de Aragão, L. E.: Vulnerability of Amazonian forests O., Davila, F., Dell Acqua, M., Encina, A., Figueredo Tacona,
to repeated droughts, P. T. Roy. Soc. B, 373, 20170411, H., Fontes, F., Hernández Herrera, J. A., Ibelles Navarro, A.
https://doi.org/10.1098/rstb.2017.0411, 2018. R., Loayza, V., Manueles, A. M., Mendoza Jara, F., Olivera,
Assine, M. L. and Soares, P. C.: Quaternary of the Pantanal, west- C., Osorio Hermosilla, R., Pereira, G., Prieto, P., Ramos, I. A.,
central Brazil, Quatern. Int., 114, 23–34, 2004. Rey Brina, J. C., Rivera, R., Rodríguez-Rodríguez, J., Roopnar-
Bossio, D.: Soil Management – A Foundational ine, R., Rosales Ibarra, A., Rosales Riveiro, K. A., Schulz, G.
Strategy for Conservation, The Nature Conser- A., Spence, A., Vasques, G. M., Vargas, R. R., and Vargas, R.:
vancy, available at: https://global.nature.org/content/ No silver bullet for digital soil mapping: country-specific soil or-
soil-management-a-foundational-strategy-for-conservation? ganic carbon estimates across Latin America, SOIL, 4, 173–193,
src=social.nature.facebook.main (last access: 22 May 2020), https://doi.org/10.5194/soil-4-173-2018, 2018.
2017. Guevara, M., Ribeiro, F., Vázquez-Lule, A., Cunha, A., Zeri, M.,
Bot, A. and Benites, J.: The importance of soil organic matter: key and Vargas, R.: Code for The Impact of Drought on Soil Mois-
to drought-resistant soil and sustained food production, Food and ture Trends across Brazilian Biomes (Version v1.0), Zenodo,
Agriculture Organization of the United Nations, Rome, 2005. https://doi.org/10.5281/zenodo.4587957, 2021.
Campos, J. N.: A gestão das águas e o desenvolvimento do Estado Hiemstra, P. H., Pebesma, E. J., Twenhöfel, C. J. W., and
do Ceará: uma perspectiva histórica, Ano IV, Num. 9, T & C Heuvelink, G. B. M.: Real-time automatic interpolation
Amazônia, 2006. of ambient gamma dose rates from the Dutch radioactiv-
CENAD – Centro Nacional de Gerenciamento de Desastres: ity monitoring network, Comput. Geosci., 35, 1711–1721,
Anuário Brasileiro de Desastres Naturais, Ministério da Inte- https://doi.org/10.1016/j.cageo.2008.10.011, 2009.
gração Nacional and Secretaria Nacional de Proteção e Defesa IBGE – Instituto Brasileiro de Geografia e Estatística: Mapa de
Civil, Brasília, DF, 2014. Biomas e de Vegetação, available at: https://ww2.ibge.gov.br/
Cirilo, J. A.: Public water resources policy for the semi-arid region, home/presidencia/noticias/21052004biomashtml.shtm (last ac-
Estududos Avançados. Revista USP, vol. 22, Universidade de São cess: 20 August 2018), 2004.
Paulo, São Paulo, SP, 61–82, ISSN 1806-9592, 2008. IBGE – Instituto Brasileiro de Geografia e Estatística: Pesquisas,
Cunha, A. P. M. A., Alvalá, Regina C. S., Nobre, C. A., and available at: https://cidades.ibge.gov.br/pesquisas (last access:
Carvalho, M. A.: Monitoring vegetative drought dynamics in 3 February 2020), 2017.
the Brazilian Semiarid Region, Agr. Forest Meteorol., 214–215, IBGE – Instituto Brasileiro de Geografia e Estatística: Biomas e
494–505, 2015. sistema costeiro-marinho do Brasil, Rio de Janeiro, 2019.
Cunha, A. P. M. A., Zeri, M., Deusdará Leal, K., Costa, L., INPE – National Institute of Spatial Research: INPE Nordeste
Cuartas, L. A., Marengo, J. A., Tomasella, J., Vieira, R. mapeia desmatamento da Caatinga, available at: http://
M., Barbosa, A. A., Cunningham, C., Cal Garcia, J. V., www.inpe.br/noticias/noticia.php?Cod_Noticia=3895, last ac-
Broedel, E., Alvalá, R., and Ribeiro-Neto, G.: Extreme Drought cess: 17 April 2018.
Events over Brazil from 2011 to 2019, Atmosphere, 10, 642 Ioris, A. A. R., Irigaray, C. T., and Girard, P.: Institutional re-
https://doi.org/10.3390/atmos10110642, 2019a. sponses to climate change: opportunities and barriers for adap-
Cunha, A. P. M. A., dos S. Alvalá, R. C., Cuartas, L. A., Marengo, tation in the Pantanal and the Upper Paraguay River Basin,
J. A., Marchezini, V., Leal, K. R. D., Tomasella, J., Saito, S. Climatic Change, 127, 139–151, https://doi.org/10.1007/s10584-
M., Zeri, M., Munoz, V. A., Ribeiro-Neto, G., Seluchi, M. E., 014-1134-z, 2014.
Cunningham, C., Costa, L. C. O., Zhang, R., and Moraes, O. L. Kolker, E.: In praise of open research measures, Nature, 498, 170,
L.: Brazilian Experience on the Development of Drought mon- https://doi.org/10.1038/498170b, 2013.
itoring and Impact Assessment Systems, United Nations Office Kouadio, Y. K., Servain, J., Machado, L. A. T., and Lentini,
for Disaster Risk Reduction – UNDRR, 2019, Contributing pa- C. A. D.: Heavy rainfall episodes in the eastern north-
per to Global Assessment Report on Disaster Risk Reduction – east brazil linked to large-scale ocean-atmosphere condi-
GAR 2019, Geneva, Switzerland, 2019b. tions in the tropical atlantic, Adv. Meteorol., 2012, 369567,
D’Souza, R., Fernandes, M. F., and Barbosa, M.: Vulnerabili- https://doi.org/10.1155/2012/369567, 2012.
dades, semi-aridez e desertificação: cenários de riscos no Cariri
Paraibano, OKARA, Geografia em debate, 2, 190–202, 2008.
Nat. Hazards Earth Syst. Sci., 21, 879–892, 2021 https://doi.org/10.5194/nhess-21-879-2021F. Lopes Ribeiro et al.: The impact of drought on soil moisture trends across Brazilian biomes 891 Kuppel, S., Houspanossian, J., Nosetto, M. D., and Jobbágy, E. Nascimento, S. and Alves, J.: Ecoclimatologia do Cariri Paraibano, G.: What does it take to flood the Pampas?: Lessons from a Revista Geográfica Acadêmica, 3, 28–41, 2008. decade of strong hydrological fluctuations: Floods and the wa- National Secretary of Civil Defense and Protection of Brazil: Re- ter cycle in the Pampas, Water Resour. Res., 51, 2937–2950, latório de Gestão: Exercício 2016, Ministério da Integração Na- https://doi.org/10.1002/2015WR016966, 2015. cional, Brasília, DF, Brazil, 2017. Leal, I. R., Da Silva, J. M. C., Tabarelli, M., and Lacher, T. Novick, K. A., Ficklin, D. L., Stoy, P. C., Williams, C. A., E.: Changing the Course of Biodiversity Conservation in the Bohrer, G., Oishi, A. C., and Phillips, R. P.: The increas- Caatinga of Northeastern Brazil, Conserv. Biol., 19, 701–706, ing importance of atmospheric demand for ecosystem wa- https://doi.org/10.1111/j.1523-1739.2005.00703.x, 2005. ter and carbon fluxes, Nat. Clim. Change, 6, 1023–1027, Legates, D. R., Mahmood, R., Levia, D. F., DeLiberty, T. L., Quir- https://doi.org/10.1038/nclimate3114, 2016. ing, S. M., Houser, C., and Nelson, F. E.: Soil moisture: A central NWS – National Weather Service: Drought: Public Fact and unifying theme in physical geography, Prog. Phys. Geogr„ Sheet, National Oceanic and Atmospheric Adminis- 35, 65–86, https://doi.org/10.1177/0309133310386514, 2011. tration, available at: https://www.esrl.noaa.gov/gmd/ Li, X. and Xiao, J.: A Global, 0.05-Degree Product of obop/mlo/educationcenter/students/brochuresanddiagrams/ Solar-Induced Chlorophyll Fluorescence Derived from OCO- noaapublications/DroughtFactSheet.pdf (last access: 12 Decem- 2, MODIS, and Reanalysis Data, Remote Sens., 11, 517, ber 2019), 2006. https://doi.org/10.3390/rs11050517, 2019. Overbeck, G. E., Vélez-Martin, E., Scarano, F. R., Lewinsohn, T. Liu, Y. Y., Parinussa, R. M., Dorigo, W. A., De Jeu, R. A. M., M., Fonseca, C. R., Meyer, S. T., and Pillar, V. D.: Conservation Wagner, W., van Dijk, A. I. J. M., McCabe, M. F., and Evans, in Brazil needs to include non-forest ecosystems, Divers. Dis- J. P.: Developing an improved soil moisture dataset by blending trib., 21, 1455–1460, https://doi.org/10.1111/ddi.12380, 2015. passive and active microwave satellite-based retrievals. Hydrol. Reuter, H. I. and Hengl, T.: Global Soil Information Earth Syst. Sci., 15, 425–436, https://doi.org/10.5194/hess-15- Facilities-Component Worldgrids.org, in: EGU Gen- 425-2011, 2011. eral Assembly Conference Abstracts, available at: Llamas, R. M., Guevara, M., Rorabaugh, D., Taufer, M., and https://www.researchgate.net/publication/233540147_Global_ Vargas, R.: Spatial Gap-Filling of ESA CCI Satellite- Soil_Information_Facilities-Component_Worldgrids_org (last Derived Soil Moisture Based on Geostatistical Tech- access: 9 September 2018), 2012. niques and Multiple Regression, Remote Sens., 12, 665, Roesch, L. F., Vieira, F., Pereira, V., Schünemann, A. L., https://doi.org/10.3390/rs12040665, 2020. Teixeira, I., Senna, A. J., and Stefenon, V. M.: The Magalhães, A.: Life and drought in Brazil. Drought in Brazil – Brazilian Pampa: A Fragile Biome, Diversity, 1, 182–198, Proactive Management and Policy, in: Drought and Water Cri- https://doi.org/10.3390/d1020182, 2009. sis., Wilhite, D., CRC Press, Boca Raton, FL, 1–19, 2016. Rossato, L., Marengo, J. A., de Angelis, C. F., Pires, L. B. Marengo, J., Tomasella, J., Alves, L., Soares, W., and Rodriguez, M., and Mendiondo, E. M.: Impact of soil moisture over D.: The drought of 2010 in the context of historical droughts Palmer Drought Severity Index and its future projections in in the Amazon region, Geophys. Res. Lett., 38, L12703, Brazil, Revista Brasileira de Recursos Hídricos (Brazilian Jour- https://doi.org/10.1029/2011GL047436, 2010. nal of Water Resources), 22, 1–16, https://doi.org/10.1590/2318- Marengo, J., Alves, L., Alvala, R., Cunha, A., Brito, S., and 0331.0117160045, 2017. Moraes, O.: Climatic characteristics of the 2010–2016 drought Santos, M. G., Oliveira, M. T., Figueiredo, K. V., Falcão, H. M., in the semiarid Northeast Brazil region, Anais da Academia Arruda, E. C. P., Almeida-Cortez, J., Sampaio, E., Ometto, Brasileira de Ciências (Annals of the Brazilian Academy J., Menezes, R., Oliveira, A., Pompelli, M., and Antonino, A. of Sciences), 90, 1973–1985, https://doi.org/10.1590/0001- C. D.: Caatinga, the Brazilian dry tropical forest: can it tol- 3765201720170206, 2017. erate climate changes?, Theor. Exp. Plant Phys., 26, 83–99, McColl, K. A., Alemohammad, S. H., Akbar, R., Konings, A. https://doi.org/10.1007/s40626-014-0008-0, 2014. G., Yueh, S., and Entekhabi, D.: The global distribution and Santos, S. and Silva, L. G.: Mapeamento por imagens dynamics of surface soil moisture, Nat. Geosci., 10, 100–104, de sensoriamento remoto evidencia o bioma Pampa https://doi.org/10.1038/ngeo2868, 2017. brasileiro sob ameaça, Boletim de Geografia, 29, 49–57, Medeiros, R. M.: Análise Hidroclimático do Município de Caba- https://doi.org/10.4025/bolgeogr.v29i2.12366, 2012. ceiras, PB, Revista Brasileira de Geografia Física, 17, 1174– SECOM – The Secretariat for Social Communication of the Pres- 1190, 2012. idency of Brazil: Biodiversity in Brazil, Secretariat for Social Ministry of National Integration of Brazil: Reconhecimentos Communication of the Presidency of the Federative Republic Realizados e Reconhecimentos Vigentes, available at: http:// of Brazil, in: United Nations Conference on Biological Diver- www.mi.gov.br/web/guest/reconhecimentos-realizados, last ac- sity (COP11), Hyderabad, India, 2012. cess: 24 March 2018. Sen, P. K.: Estimates of the Regression Coefficient Based Mishra, A. K. and Singh, V. P.: A review of on Kendall’s Tau, J. Am. Stat. Assoc., 63, 1379, drought concepts, J. Hydrol., 391, 202–216, https://doi.org/10.2307/2285891, 1968. https://doi.org/10.1016/j.jhydrol.2010.07.012, 2010. Sheffield, J. and Wood, E. F.: Global Trends and Variability in Moraes, C., Pereira, G., an dCardozo, F.: Avaliação precipitação e Soil Moisture and Drought Characteristics, 1950–2000, from sua influência sobre as áreas inundadas no Pantanal, in: Anais Observation-Driven Simulations of the Terrestrial Hydrologic XVI Simpósio Brasileiro de Sensoriamento Remoto – SBSR, Cycle, J. Climate, 21, 432–458, 2008. INPE, Foz do Iguaçu, PR, Brasil, 2013. https://doi.org/10.5194/nhess-21-879-2021 Nat. Hazards Earth Syst. Sci., 21, 879–892, 2021
You can also read