The soil organic carbon stabilization potential of old and new wheat cultivars: a 13CO2-labeling study
←
→
Page content transcription
If your browser does not render page correctly, please read the page content below

Biogeosciences, 17, 2971–2986, 2020
https://doi.org/10.5194/bg-17-2971-2020
© Author(s) 2020. This work is distributed under
the Creative Commons Attribution 4.0 License.

The soil organic carbon stabilization potential of old and
new wheat cultivars: a 13CO2-labeling study
Marijn Van de Broek1, , Shiva Ghiasi2, , Charlotte Decock1,3 , Andreas Hund4 , Samuel Abiven5 , Cordula Friedli4,5 ,
Roland A. Werner2 , and Johan Six1
1 SustainableAgroecosystems Group, Department of Environmental Systems Science, Swiss Federal Institute of Technology,
ETH Zürich, Zurich, Switzerland
2 Grassland Sciences Group, Department of Environmental Systems Science, Swiss Federal Institute of Technology,

ETH Zürich, Zurich, Switzerland
3 Department of Natural Resources Management and Environmental Sciences, California Polytechnic State University,

San Luis Obispo, California 93407, USA
4 Group of Crop Science, Department of Environmental Systems Science, Swiss Federal Institute of Technology,

ETH Zürich, Zurich, Switzerland
5 Department of Geography, University of Zürich, Zurich, Switzerland
 These authors contributed equally to this work.

Correspondence: Marijn Van de Broek (marijn.vandebroek@usys.ethz.ch)

Received: 24 December 2019 – Discussion started: 9 January 2020
Revised: 11 April 2020 – Accepted: 29 April 2020 – Published: 11 June 2020

Abstract. Over the past decades, average global wheat yields       SOC stocks. Further research is necessary to quantify the
have increased by about 250 %, mainly due to the cultiva-          long-term importance of this effect.
tion of high-yielding wheat cultivars. This selection process
not only affected aboveground parts of plants, but in some
cases also reduced root biomass, with potentially large con-
sequences for the amount of organic carbon (OC) transferred        1   Introduction
to the soil. To study the effect of wheat breeding for high-
                                                                   Soil management has a large influence on the size of the soil
yielding cultivars on subsoil OC dynamics, two old and two
                                                                   organic carbon (SOC) stock in managed arable soils. This
new wheat cultivars from the Swiss wheat breeding program
                                                                   is evident from the large decrease in SOC that is generally
were grown for one growing season in 1.5 m deep lysime-
                                                                   observed after soils under natural vegetation are converted
ters and pulse labeled with 13 CO2 to quantify the amount
                                                                   to arable land (Don et al., 2011; Guo and Gifford, 2002;
of assimilated carbon that was transferred belowground and
                                                                   Poeplau et al., 2011). As a consequence, the mineralization
can potentially be stabilized in the soil. The results show that
                                                                   of SOC and the loss of forest caused by land use change
although the old wheat cultivars with higher root biomass
                                                                   has contributed about 30 % to the increase in atmospheric
transferred more assimilated carbon belowground compared
                                                                   CO2 concentration since the onset of the industrial revolu-
to more recent cultivars, no significant differences in net rhi-
                                                                   tion (Le Quéré et al., 2018). Current contributions of the agri-
zodeposition were found between the different cultivars. As
                                                                   cultural sector to global warming have been estimated to be
a consequence, the long-term effect of wheat cultivar selec-
                                                                   about 11 % but are mostly in the form of N2 O and CH4 and
tion on soil organic carbon (SOC) stocks will depend on the
                                                                   not anymore as CO2 (Tubiello et al., 2015).
amount of root biomass that is stabilized in the soil. Our re-
                                                                      The rising awareness that there is potentially an opportu-
sults suggest that the process of wheat selection for high-
                                                                   nity to increase subsoil organic carbon (OC) stocks (Chen et
yielding cultivars resulted in lower amounts of belowground
                                                                   al., 2018) has led to the proposal that agricultural soils can be
carbon translocation, with potentially important effects on
                                                                   a sink of atmospheric CO2 by applying appropriate climate-

Published by Copernicus Publications on behalf of the European Geosciences Union.
2972               M. Van de Broek et al.: The soil organic carbon stabilization potential of old and new wheat cultivars

smart agricultural practices (Chenu et al., 2018; Minasny et         To overcome these difficulties, rates of C rhizodeposition
al., 2017; Paustian et al., 2016). Multiple management prac-      can be measured by labeling plants with 13 CO2 or 14 CO2
tices have been shown to increase the OC content of cul-          (Jones et al., 2009; Kuzyakov and Domanski, 2000) and sub-
tivated soils, including the application of organic amend-        sequently tracing the amount of photosynthetically assimi-
ments to soils (Sandén et al., 2018), increasing the amount       lated 13 C or 14 C label in the soil at the end of the growing
of crop residues returned to the field (Lehtinen et al., 2014)    season (Kong and Six, 2010, 2012). However, the continuous
and planting of cover crops (Kong and Six, 2010; Poeplau          application of 13 CO2 or 14 CO2 during the course of an entire
and Don, 2015).                                                   growing season to plants is often not feasible, as this requires
   In addition, growing crops with deeper roots and/or higher     the setup of open-top chambers while continuously supply-
root biomass has been put forward as a strategy to increase       ing the crops with the isotopic label, which comes at a high fi-
OC sequestration in arable soils (Kell, 2011), while deep         nancial cost. Therefore, plants are commonly labeled at fixed
rooting can also decrease the effect of drought in climates       time intervals during the growing season (repeated pulse la-
where deep soil water is available during the main cropping       beling). This results in reliable estimates of the partition-
season (Wasson et al., 2012). However, a direct or marker-        ing of assimilated carbon to different plant compartments,
assisted selection for root traits is very rare in conven-        as well as into the soil (Kong and Six, 2010; Kuzyakov and
tional breeding programs. Accordingly, we have very limited       Domanski, 2000; Sun et al., 2018).
knowledge on if and how breeders alter the root system and           In addition, assessing the magnitude of the carbon transfer
potentially affect belowground carbon cycling. One way to         from roots to the soil is not straightforward, particularly un-
evaluate the effect of breeder’s selection on root character-     der field conditions. While carbon inputs from crops to the
istics and subsoil carbon cycling is to compare old and new       soil are often derived from yield measurements (Keel et al.,
varieties of the same breeding program. For the Swiss wheat       2017; Kong et al., 2005; Taghizadeh-Toosi et al., 2016), these
breeding programs, the selection process reduced the mass         quantities are often poorly related to root biomass or the mag-
and depth of roots under well-watered conditions (Friedli et      nitude of root exudates (Hirte et al., 2018; Hu et al., 2018).
al., 2019), as has been found for other breeding programs         A better understanding of the factors controlling the rates of
(Aziz et al., 2017), but modern genotypes enhanced root al-       carbon rhizodeposition by different agricultural crops is thus
location to deep soil layers under drought. However, this pat-    necessary to assess how different crops affect SOC cycling
tern has not been observed consistently (Cholick et al., 1977;    and to provide SOC models with reliable rates of carbon in-
Feil, 1992; Lupton et al., 1974). To the best of our knowl-       puts to the soil.
edge, there is no information about the effect of breeding on        The present study addresses the following research ques-
changes in subsoil OC dynamics and root respiration.              tion: do wheat cultivars with shallow roots and lower root
   One reason for the lack of quantitative data about the ef-     biomass lead to less net carbon rhizodeposition compared to
fects of rooting depth on SOC sequestration is related to         wheat cultivars with deeper roots and higher root biomass?
difficulties in measuring the amount of carbon transferred        To address this question, four different bread wheat cultivars
from roots to the soil (gross rhizodeposition) and the pro-       from a century of Swiss wheat breeding (Fossati and Bra-
portion of carbon that is eventually stabilized there (net rhi-   bant, 2003; Friedli et al., 2019) were grown in large meso-
zodeposition), after a portion of gross rhizodeposits are lost    cosms, which allowed us to study the plant–soil system under
from the soil through microbial mineralization or leaching.       controlled conditions that closely resemble a field situation.
The fact that rhizodeposition occurs below the soil surface       We hypothesized that wheat cultivars with shallow roots and
greatly prevents direct observations of this “hidden half of      lower root biomass would result in less net carbon rhizode-
the hidden half” of the SOC cycle (Pausch and Kuzyakov,           position over the course of a growing season, compared to
2018). First of all, direct measurements of root exudation        cultivars with deeper roots and higher root biomass.
rates are hampered by the fact that rhizodeposits are used
by rhizosphere microorganisms within a couple of hours af-
ter they are released, resulting in very low concentrations of    2     Materials and methods
root carbon exudates in the soil (Kuzyakov, 2006). Second,
the release of carbon exudates by agricultural crops is not       2.1     Experimental setup
equally divided throughout the growing season but mainly
occurs in the first 1–2 months of the growing period and de-      2.1.1    ETH mesocosm platform
creases sharply thereafter (Gregory and Atwell, 1991; Keith
et al., 1986; Kuzyakov and Domanski, 2000; Pausch and             To assess the effect of wheat root characteristics on net
Kuzyakov, 2018; Swinnen et al., 1994). Third, measurements        rhizodeposition in a realistic soil environment under con-
of the effects of rhizodeposits on changes in SOC stocks are      trolled conditions, an experiment was set up at the meso-
further complicated by the priming effect, i.e., their positive   cosm platform of the Sustainable Agroecosystems Group at
effect on the mineralization of native SOC (Fontaine et al.,      the Research Station for Plant Sciences Lindau (ETH Zürich,
2007; de Graaff et al., 2009).                                    Switzerland). The platform was located inside a greenhouse

Biogeosciences, 17, 2971–2986, 2020                                                  https://doi.org/10.5194/bg-17-2971-2020
M. Van de Broek et al.: The soil organic carbon stabilization potential of old and new wheat cultivars                        2973

and consisted of 12 cylindrical lysimeters with a diameter         was increased to 12 ◦ C and night temperature was increased
of 0.5 m and a height of 1.5 m, constructed using 10 mm            to 10 ◦ C. During the last 4 d, daytime temperature was in-
wide polyethylene (Fig. S1 in the Supplement). The lysime-         creased to 16 ◦ C and night temperature to 12 ◦ C. The rela-
ters were equipped with probes installed at five different         tive humidity was maintained at 60 ± 10 % during the entire
depths (0.075, 0.30, 0.60, 0.90 and 1.20 m below the surface)      vernalization period. After vernalization, 70 seedlings were
to measure the volumetric moisture content at a temporal           transplanted to every lysimeter, corresponding to a plant den-
resolution of 30 min (ECH2 O EC-5, Decagon Devices, US)            sity of 387 plants m−2 . At the timing of transplanting, the
and to sample soil pore water (Prenart, Frederiksberg, Den-        plants were at the onset of tillering.
mark) and soil pore air (Membrana, Wuppertal, Germany).               The experimental setup consisted of a randomized com-
The lysimeters were filled with mechanically homogenized           plete block design. Each of the four wheat cultivars was
soil, collected from an agricultural field in Estavayer-le-Lac,    planted in three lysimeters, i.e., three replicates per cultivar,
Switzerland. The upper 0.15 m of the lysimeters was filled         resulting in a total of 12 lysimeters. These were placed in
with topsoil, collected from the A horizon, while the remain-      three blocks of four rows, where each wheat cultivar was
der (0.15–1.35 m depth) was filled with subsoil. The bottom        planted in one lysimeter in each block. The plants were
0.15 m of the lysimeters (1.35–1.50 m depth) consisted of          grown in the greenhouse for about 5 months, between 24 Au-
a layer of gravel (Blähton, Erik Schweizer, Switzerland) to        gust 2015 and 1 February 2016. Despite uneven maturing
facilitate drainage of soil water through the bottom of the        of plants within and between the lysimeters, all plants had
lysimeters. The top and subsoil had a sandy clay loam tex-         reached flowering stage at the time of harvest. Fertilizer was
ture with 21 % silt, 21 % clay, and 58 % sand, and top- and        applied to the soil lysimeters a first time on 5 October 2015,
subsoil pH values were 7.8 and 7.5, respectively. The OC           at a rate of 84 kg N ha−1 , 36 kg P2 O5 ha−1 , 48 kg K2 O ha−1
concentration of the top- and subsoil was 0.77 ± 0.01 % and        and 9 kg Mg ha−1 , and a second time on 4 December 2015, at
0.40 ± 0.01 %, respectively, with a C : N ratio of 6.9 and 5.0,    a rate of 56 kg N ha−1 , 24 kg P2 O5 ha−1 , 32 kg K2 O ha−1 and
respectively. No carbonates were detected in the soil.             6 kg Mg ha−1 . The lysimeters were watered manually twice
   At the top of each lysimeter, pneumatically activated           per week with a similar amount of water to keep soil moisture
chambers were placed, which were automatically closed              close to field capacity. Differences in the amount of water
when applying the 13 CO2 label (see Sect. 2.1.3). These            used by the different cultivars resulted in differences in the
chambers were made of stainless steel with fitted plexiglass       soil water content between the cultivars (Fig. S2). The tem-
panes and covered a rectangular area of 0.5 m×0.5 m with an        perature in the greenhouse was set to 20 ◦ C during the day
initial height of 0.1 m. Chamber heights were extended with        and 15 ◦ C during the night. During the experiment, the aver-
increasing plant height, using one or two height extensions        age temperature in the greenhouse was 16.9 ◦ C, with a mini-
of 0.5 m each (Fig. S1).                                           mum and maximum of 9.3 and 29.8 ◦ C respectively. The av-
                                                                   erage humidity was 63.7 %, with a minimum and maximum
2.1.2   Wheat cultivars and growth conditions                      of 35.3 % and 86.4 % respectively.

Four wheat (Triticum aestivum L.) cultivars from the Swiss         2.1.3   Repeated 13 C pulse labeling
wheat breeding program (Fossati and Brabant, 2003; Friedli
et al., 2019) with different breeding ages were selected:          In order to study carbon allocation within the atmosphere–
Mont-Calme 268 (introduced in 1926), Probus (1948), Zi-            plant–soil system, a 13 C-pulse-labeling approach was used.
nal (2003) and CH Claro (2007). Generally, more recent cul-        99 at. % 13 CO2 (Euriso-top, Saint-Aubin, France) was ap-
tivars of this program on average have more shallow roots          plied once per week (14:00 local time on Thursdays) by in-
and lower root biomass under well-watered conditions com-          jecting 15, 56 or 98 mL CO2 into each chamber depending on
pared to the older cultivars (Friedli et al., 2019). CH Claro      the chamber extension used, in order to yield a target 13 CO2
was selected as a modern variety with relatively deep root-        content of 58 at. %. A weekly labeling frequency has been
ing.                                                               shown to ensure a sufficient abundance of root-derived 13 C
   Before the wheat plants were transplanted to the lysime-        in the soil at the end of the experiment (Bromand et al., 2001;
ters, wheat seeds were germinated in a greenhouse for 2–           Kong and Six, 2010). After chamber closure, CO2 concen-
3 d on perforated antialgae foil laid over 2 mm moistened          tration in one chamber was monitored using a CO2 analyzer
fleece at a warm temperature (20 ◦ C during day and 18 ◦ C         (Li-820, LICOR, Lincoln, US). Throughout the experiment,
during night) and good light conditions. Next, the seedlings       CO2 concentrations were measured in the same chamber. Af-
were planted in containers filled with the same topsoil used       ter the CO2 concentration dropped below 200 ppm, another
to fill the lysimeters and transferred to a climate chamber        13 CO pulse was injected to yield a postlabel CO concen-
                                                                         2                                              2
for vernalization for 52 d (Baloch et al., 2003). First, the       tration of 570 ppm in the chamber headspace. The chamber
seedlings were kept 45 d at 4 ◦ C, with 8 h of light per day and   lids were kept closed for 2 h after label injection to achieve
a light intensity of 10 klx. During the 3 subsequent days, day-    sufficient uptake and then reopened to avoid condensation.
light intensity was increased to 36 klx, daytime temperature       On the same day of pulse labeling, all chambers were closed

https://doi.org/10.5194/bg-17-2971-2020                                                   Biogeosciences, 17, 2971–2986, 2020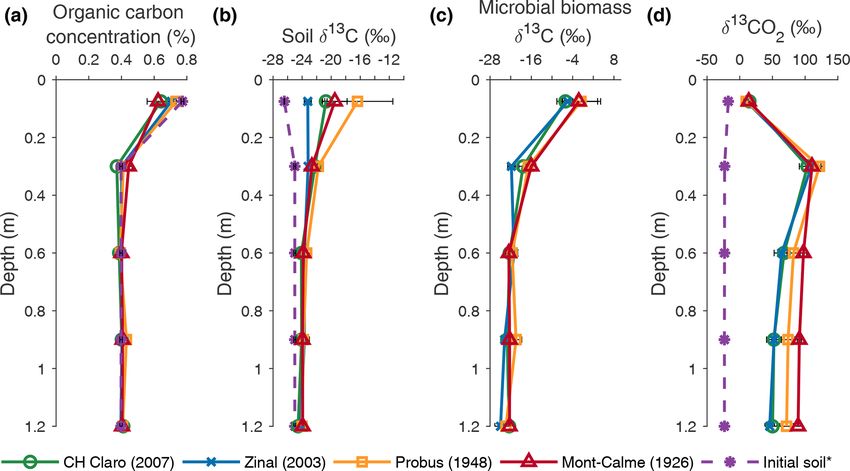
2974               M. Van de Broek et al.: The soil organic carbon stabilization potential of old and new wheat cultivars

overnight to recuperate 13 C lost through night respiration and   sampling. Two subsamples of 40 g were taken from each
allowed to be taken up by the plants in the morning before re-    sieved soil sample. One set was fumigated for 24 h using
opening the chambers.                                             chloroform. Next, total dissolved OC was extracted from
                                                                  each fumigated and nonfumigated subsample by shaking it
2.2     Measurements                                              in 200 mL 0.05 M K2 SO4 for 1 h, prior to filtering through a
                                                                  Whatman 42 filter paper. Total OC concentrations in K2 SO4
2.2.1    Belowground CO2 concentration and δ 13 CO2               extracts were determined using a CN analyzer (multi N/C
                                                                  2100S analyzer, Analytik Jena, Germany). To determine mi-
Soil gas sampling was performed once per week (Wednes-
                                                                  crobial biomass carbon per unit of dry soil, the gravimetric
days) by attaching a pre-evacuated 110 mL crimp serum vial
                                                                  soil water content was determined by drying about 10 g of
to a sampling port at each depth, leaving it equilibrating
                                                                  each soil sample at 105 ◦ C and subtracting the weights be-
overnight. For each sample, a 20 mL subsample was trans-
                                                                  fore and after drying. The carbon content of the soil micro-
ferred to a pre-evacuated Labco exetainer (12 mL) and used
                                                                  bial biomass was calculated according to Vance et al. (1987)
to determine the CO2 concentration. The CO2 concentra-
                                                                  as
tion of each sample was determined using a gas chromato-
graph equipped with a thermal conductivity detector (Bruker                    TOCF − TOCNF
                                                                  TOCMB =                   ,                                 (1)
456-GC, Germany). In addition, the δ 13 C value of CO2 was                         0.45
measured for CO2 samples collected along the depth pro-
files on the last sampling date, using a GasBench II modified     where TOCF and TOCNF are the total OC in fumigated and
as described by Zeeman et al. (2008) coupled to a Deltaplus       nonfumigated samples, respectively. The remainder of the fil-
XP isotope ratio mass spectrometer (IRMS, ThermoFisher,           tered samples was freeze-dried in order to analyze the δ 13 C
Germany). The standard deviation of the measurements was          value. The δ 13 C value of soil microbial biomass was calcu-
< 0.15 ‰.                                                         lated using mass balance according to Ruehr et al. (2009):

                                                                              δ 13 CF · CF − δ 13 CNF · CNF

2.2.2    Sampling and general soil analyses                       δ 13 CMB =                                  ,             (2)
                                                                                        CF − CNF
At the end of the experiment, the aboveground biomass of the
                                                                  where CF and CNF represent total organic carbon content of
wheat plants was harvested separately for each lysimeter and
                                                                  the fumigated and nonfumigated samples, respectively.
separated into leaves, ears and stems. Soil from the lysime-
ters was collected by destructive sampling to analyze bulk        2.2.4    Organic carbon concentration and isotopic
density, root biomass and other soil properties. The sampling              composition of plant material, soil organic carbon
was done layer by layer. After a soil layer had been sam-                  and microbes
pled, it was removed completely from the lysimeter and the
next layer was sampled. From each depth increment (0–0.15,        The OC concentration and isotopic composition (δ 13 C) of
0.15–0.45, 0.45–0.75, 0.75–1.05, 1.05–1.35 m depth), five         above- and belowground plant material; extracts from fumi-
soil cores were collected per lysimeter using a soil core sam-    gated and nonfumigated soil; and bulk soil were measured
pler (5.08 cm diameter, Giddings Machine Company Inc.,            by weighing 2, 4, 50, 50 and 100 mg, respectively, of each
Windsor, CO, US). Three of the five cores per lysimeter           sample into Sn capsules (9 mm × 5 mm Säntis, CH) for anal-
and depth increment were used for the determination of root       ysis with a Flash EA 1112 series elemental analyzer (Ther-
biomass based on a combination of buoyancy and sieving            moFisher, Germany) coupled to a Deltaplus XP IRMS via a
through a 530 µm sieve, using a custom-built root washing         ConFlo III (Brooks et al., 2003; Werner et al., 1999; Werner
station. The remaining two soil cores were sieved at 8 mm,        and Brand, 2001). The measurement precision (SD) of the
air-dried and stored for further analysis. Prior to air-drying,   quality control standards, tyrosine Tyr-Z1 and caffeine Caf-
the fresh weight and volume for each core was determined,         Z1, was 0.37 (‰) and 0.08 (‰), respectively, for above- and
and a subsample was taken for the determination of gravimet-      belowground plant material, microbes, and the soil samples.
ric soil moisture content. Bulk density was calculated based
on fresh weight, gravimetric moisture content and core vol-       2.3     Data processing
ume. Soil texture was measured using a particle size analyzer
(LS 13 320, Beckman Coulter, Indianapolis, USA). Prior to         2.3.1    Excess 13 C calculations
analysis 0.1 g of soil was shaken for 4 h with 4 mL of 10 %
sodium hexametaphosphate and sonicated for 1 min.                 The mass of 13 C label that was recovered in (i) the above-
                                                                  ground vegetation, (ii) roots of wheat plants and (iii) the soil
2.2.3    Soil microbial biomass                                   was calculated following Studer et al. (2014):

                                                                                      χ E 13 C · m (C) · M 13 C

Soil microbial biomass was extracted from soil samples that

                                                                    E 13
                                                                  m      C =                                           ,      (3)
had been frozen at −20 ◦ C for 6 months immediately after

                                                                               χ 12 C · M 12 C + χ 13 C · M 13 C

Biogeosciences, 17, 2971–2986, 2020                                                  https://doi.org/10.5194/bg-17-2971-2020
M. Van de Broek et al.: The soil organic carbon stabilization potential of old and new wheat cultivars                            2975

where mE 13 C is the mass of recovered 13 C label (g m−2 ),

                                                                     (0–0.45 m depth), as only for these layers all necessary data
χ E 13 C is the excess atom fraction (unitless, calculated fol-      to calculate net C rhizodeposition were available for the three
lowing Coplen, 2011),                                   −2
     12             13
                           m (C) is the total mass (g12m ) of13C,   replicates of every cultivar.
M C and M C are the molar                weight of  C and C
(g mol−1 ), respectively, and χ 12 C and χ 13 C are the 12 C         2.3.3     Subsoil CO2 production
and 13 C atom fraction (unitless), respectively.
   To calculate the excess atom fraction (χ E (13 C)) of the         Depth profiles of subsoil CO2 production in the lysimeters
soil compartment, the isotopic composition of the soil at            were calculated using the weekly measured depth profiles
the start of the experiment was used as the reference value          of CO2 concentration throughout the experiment. To assess
(−26.45 ± 0.04 ‰ for the topsoil, −25.01 ± 0.13 ‰ for the            the variability among the different lysimeters, these calcu-
subsoil). As all lysimeters were labeled with 13 CO2 , no con-       lations were performed separately for every lysimeter and
trol treatment for the wheat plants was present. Therefore, a        average CO2 production depth profiles were calculated for
δ 13 C reference value of −28 ‰ was assumed for the above-           each cultivar. Measurements of CO2 concentration, soil tem-
ground parts and roots of all wheat plants. The calculation of       perature and soil moisture content were performed at discrete
excess 13 C is very sensitive to variability in input parameter      depths (0.075, 0.30, 0.60, 0.90 and 1.20 m depth). Continu-
values, including the δ 13 C value of plant biomass and soil.        ous depth profiles of these variables at a vertical resolution of
Therefore, a sensitivity analysis was used to show that vary-        0.05 m were obtained using linear interpolation. Depth pro-
ing the initial δ 13 C value of the wheat plants with ±3 ‰, a        files of CO2 production were calculated using the discretized
typical range over which δ 13 C values can vary in the field be-     form of the mass balance equation of CO2 in a diffusive one-
cause of, e.g., precipitation (Kohn, 2010), led to changes in        dimensional medium, following Goffin et al. (2014):
calculated mE (13 C) on the order of ±1 % for aboveground                        1 (εi [CO2 ]i ) Ftopi − Fboti
biomass and ± 1 %–5 % for belowground biomass. The ef-               P (z)i =                   +              ,                    (5)
                                                                                       1t             1z
fect of the initial δ 13 C value of the biomass on the calculated
amount of recovered 13 C label in the wheat plants was thus          where P (z) is the CO2 production in layer i
limited. Calculations of the effect of wheat cultivar on below-      (µmol CO2 m−3 s−1 ) over time span 1t, t is the time
ground excess 13 C were only performed for the upper 0.45 m          (s), εi is the air-filled porosity in layer i (m3 m−3 ), [CO2 ]i is
of the lysimeters, as missing data for deeper soil layers pre-       the CO2 concentration of layer i (µmol CO2 m−3 ), Ftopi and
vented including these layers in the statistical analyses and        Fboti are the CO2 fluxes transported through the upper and
the majority of root biomass was present in the upper 0.45 m         lower boundaries of layer i (µmol CO2 m−2 s−1 ) during time
(Fig. 1).                                                            span 1t, respectively, and z is the depth (m). The vertical
                                                                     CO2 fluxes are calculated as (Goffin et al., 2014):
2.3.2   Net carbon rhizodeposition
                                                                                           [CO2 ]i−1 − [CO2 ]i
                                                                     Ftopi = −D s;i−1,i                         ,                   (6)
The absolute amount of carbon rhizodeposition for the dif-                                         1z
ferent depth segments in the lysimeters was calculated fol-                               [CO2 ]i − [CO2 ]i+1
                                                                     Fboti   = −D s;i,i+1                      ,                    (7)
lowing Janzen and Bruinsma (1989):                                                                 1z

                     χ E 13 C soil                                   where D s;i,j is the harmonic average of the effective diffu-

Rhizodeposition C = E 13          · Csoil ,            (4)          sivity coefficient (Ds ) between layers i and j , and 1z is the
                     χ     C root
                                                                     layer thickness. The effective diffusivity coefficient is calcu-
                                                                     lated using a formula appropriate for repacked soils (Mol-
where rhizodeposition C is expressed in grams per       kilo-       drup et al., 2000):
gram (g kg−1 ) for the considered layer; χ E 13 C soil and
χ E 13 C root are the excess 13 C atom fraction in the soil and

                                                                                     2.5
                                                                                    εi,t
roots respectively, calculated as described in Sect. 2.3.1; and      Ds;i = D0,t           ,                                        (8)
                                                                                    8i
Csoil is the OC concentration of the considered soil layer
(g kg−1 ). This approach assumes that the isotopic enrichment        where D0 is the gas diffusion coefficient of CO2 in free
of rhizodeposits and roots is equal. The absolute amount of          air over time span 1t (m2 s−1 ), εi is the air-filled porosity
carbon rhizodeposition for each soil layer was calculated by         of layer i over time span 1t (m3 m−3 ) and 8i is the to-
multiplying rhizodeposition C (g kg−1 ) with the carbon con-         tal soil porosity of layer i (m3 m−3 ). The total soil porosity
tent (kg) present in each of the respective layers. We note that     was calculated as 8i = 1 − ρi /ρp , where ρi is the soil bulk
data on the C concentration and δ 13 C value of root biomass         density (t m−3 ) and ρp is the particle density (2.65 t m−3 ).
could not be obtained from a number of soil layer below              Due to the large vertical variability in measured bulk density
0.45 m depth for certain cultivars, due to the limited root          depth profiles, a constant bulk density profile was assumed
biomass that could be retrieved. Therefore, net C rhizodepo-         for the subsoil (below 0.15 m depth), calculated as the av-
sition was only calculated for the two uppermost soil layers         erage of the measured bulk density values for these layers.

https://doi.org/10.5194/bg-17-2971-2020                                                        Biogeosciences, 17, 2971–2986, 2020
2976 M. Van de Broek et al.: The soil organic carbon stabilization potential of old and new wheat cultivars
The air-filled porosity over time span 1t was calculated as effects and blocks being treated as a random effect (lmer
the difference between the total porosity (m3 m−3 ) and the function in R; R Core Team, 2019). Next, a pair-wise com-
average measured water-filled pore space over time span 1t parison was used to check for statistically significant differ-
(m3 m−3 ). The latter was measured throughout the experi- ences between the cultivars (emmeans package in R). Below-
ment (see Sect. 2.1.1) and corrected based on differences be- ground biomass was log-transformed to increase normality
tween these measurements at the end of the experiment and and homogeneity of variances for the latter analysis. Uncer-
the measured volumetric water content of the sampled soil at tainties on reported variables are expressed as standard errors
the end of the experiment. For this purpose, different correc- (n = 3).
tion equations were used for (i) the upper soil layer (0–15 cm)
and (ii) all deeper layers combined.
The gas diffusion coefficient in free air was corrected for 3 Results
the individual lysimeters for variations in temperature and
3.1 Aboveground biomass
soil moisture throughout the experiment (Massman, 1998),
as The aboveground biomass produced at the end of the experi-
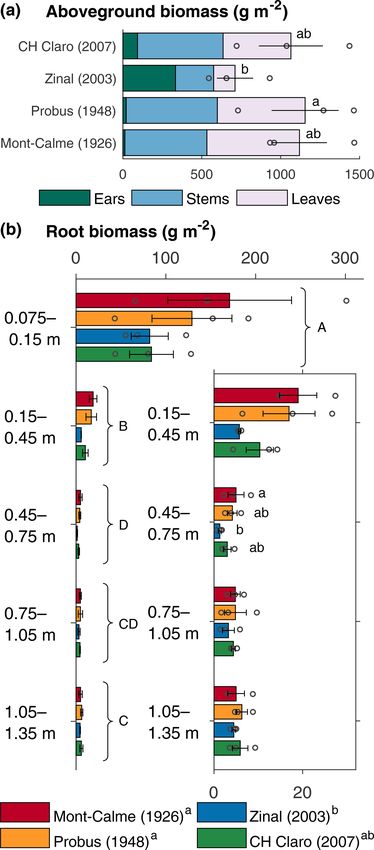
p0 T α ment was significantly different between Zinal and Probus,
D0 = D0,stp , (9) while the aboveground biomass of CH Claro and Mont-
p T0
Calme 268 was not significantly different from any other
where D0,stp is the gas diffusion coefficient for CO2 in free cultivar (Fig. 1, Table 1). The biomass of the ears was sig-
air under standard temperature (0 ◦ C) and pressure (1 atm) nificantly higher for Zinal, compared to CH Claro, Probus
(1.385 × 10⁻⁵ m2 s−1 ; Massman, 1998) and α is a coeffi- and Mont-Calme (Fig. 1, Table S1 in the Supplement). It is
cient (1.81; Massman, 1998). Semicontinuous measurements noted that these data should be interpreted with care, since
of soil temperature in every lysimeter were used to calculate not all plants reached maturity at the time of harvest and are
D0 values throughout the experiment, while a constant at- potentially not representative for the biomass of the ears of
mospheric pressure of 1 atm throughout the experiment was full-grown plants. No significant differences were found be-
assumed. tween the δ 13 C values of aboveground biomass of the dif-
To obtain depth profiles of the total amount of CO2 pro- ferent cultivars (Fig. 2). The high δ 13 C values of the above-
duced by the different wheat cultivars during the experiment ground biomass of all wheat cultivars (266 ‰ on average)
(expressed as g CO2 m−2 ), the calculated CO2 production showed that a substantial amount of the 13 CO2 tracer was
rates between all measurement days (P (z)) were summed incorporated by all wheat plants (Fig. 2).
for the time span of the experiment and converted to grams
of CO2 per square meter (g CO2 m−2 ) using the molecular 3.2 Belowground biomass
mass of CO2 (44.01 g mol−1 ). We applied the boundary con-
dition of the absence of a flux of CO2 at the bottom of the The average root biomass was highest in the topsoil and sig-
lysimeters. It is noted that these calculations do not make a nificantly lower in the subsoil layers of all four wheat culti-
distinction between the source of CO2 production, thereby vars (Fig. 1b). Root biomass of Zinal was significantly lower
combining both autotrophic and heterotrophic CO2 produc- compared to the root biomass of Probus and Mont-Calme
tion (total soil respiration). For more information about these 268, while the root biomass of CH Claro was not signif-
methods, reference is made to Goffin et al. (2014). icantly different from any of the other cultivars (Fig. 1b).
These differences were mostly present in the two uppermost
2.4 Statistics soil layers, while root biomass was not significantly differ-
ent between different cultivars at any depth, except for Zi-
To account for the three blocks in the randomized com- nal and Mont-Calme 268 between 0.45 and 0.75 m depth
plete block design, statistically significant differences be- (Fig. 1). The root : shoot ratio varied between 0.10±0.02 and
tween aboveground characteristics of different cultivars were 0.19 ± 0.08 and was not significantly different between the
checked using a two-way analysis of variance (ANOVA) different cultivars (Table 1).
without interactions (Dean et al., 2015), followed by a Tukey The depth profiles of the δ 13 C of root biomass were differ-
test, based on the values obtained for the individual repli- ent between the old and more recent wheat cultivars (Fig. 2).
cates (n = 3 for every cultivar) using a significance level In the two uppermost soil layers, no significant differences
of 0.05. This was done after checking for homogeneity of were detected between the δ 13 C values of root biomass of the
variance (Levene’s test) and normality (Shapiro–Wilk test) different cultivars. These differences could not be checked
using a confidence level of 0.05. These analyses were per- for statistical significance in deeper soil layers due to a lack
formed in MATLAB® . The effects of cultivar and depth on of sufficient recovered root biomass in each lysimeter. The
soil bulk density, belowground biomass, belowground C al- δ 13 C values of the roots of the old wheat cultivars showed
location and net C rhizodeposition were assessed using a lin- only limited variation with depth, with values between ca.
ear mixed-effects model, with cultivar and depth being fixed 150 ‰ and 200 ‰. In contrast, the δ 13 C values of the roots
Biogeosciences, 17, 2971–2986, 2020 https://doi.org/10.5194/bg-17-2971-2020M. Van de Broek et al.: The soil organic carbon stabilization potential of old and new wheat cultivars 2977
Table 1. Characteristics (± standard error, n = 3) of the biomass of the different wheat cultivars at the end of the experiment. Values that
share a letter in the same column are not significantly different.
Cultivar Aboveground biomass Root biomass Root : shoot ratio
(year of release) Biomass (g m−2 ) OC % Biomass (g m−2 ) OC %
CH Claro (2007) 1064 ± 207ab 40.5 ± 0.3ab 107 ± 28ab 38.7 ± 1.9a 0.10 ± 0.02a
Zinal (2003) 710 ± 114b 40.0 ± 0.14a 97 ± 20b 39.1 ± 1.1∗ 0.14 ± 0.01a
Probus (1948) 1154 ± 220a 41.9 ± 0.2b 161 ± 54a 38.1 ± 0.5a 0.13 ± 0.03a
Mont-Calme 268 (1926) 1119 ± 174ab 40.8 ± 0.4ab 205 ± 67a 36.8 ± 1.3a 0.19 ± 0.08a
∗ Was excluded from statistical analysis due to missing data.
of the more recent wheat cultivars were highest in the two up-
permost soil layers (0–45 cm) and showed an abrupt decrease
with depth in deeper soil layers.
3.3 Soil and soil organic carbon characteristics
The SOC concentration in the lysimeters was similar to the
OC concentration of the initial soil (Fig. 3a). A direct com-
parison between the SOC concentration before and after the
experiment could not be made, as no measurements of the
OC concentration of the soil in the lysimeters before the start
of the experiment could be made. However, the SOC concen-
tration measured at the different depths in the lysimeters was
similar to the OC concentration measured on the soil that was
used to fill the lysimeters (Fig. 3a). No statistically signifi-
cant differences in SOC concentration were found between
the different cultivars at any depth.
The SOC in the two uppermost soil layers (0–45 cm) of
all wheat cultivars was enriched in 13 C compared to the soil
that was used to fill the lysimeters (Fig. 3b). Although the
δ 13 C value of SOC was not significantly different at any
depth between any of the cultivars, the largest increase in
the δ 13 C value of topsoil OC was observed for Probus and
Mont-Calme 268 (Fig. 3b), indicating that the soil under the
old cultivars incorporated more of the 13 C label compared
to the more recent cultivars. The limited difference between
(i) the δ 13 C values of the soil used to fill the lysimeters
and (ii) the measurements at the end of the experiment be-
low a depth of 0.45 m indicates a lower amount of incor-
porated 13 C label in the subsoil. Similarly, the δ 13 C value
of topsoil microbial biomass was more positive compared to
deeper soil layers for all cultivars, indicating that microbes
utilized more substrate enriched in 13 C in the two upper-
most soil layers, compared to deeper soil layers (Fig. 3c).
Figure 1. Aboveground (a) and root (b) biomass of the different
wheat cultivars at the end of the experiment. Bars represent the av-
Statistically significant differences were only detected in the
erage per wheat cultivar, error bars show the standard error (n = 3) layer between 0.15 and 0.45 m depth, where the δ 13 C value
and circles show the individual data points. The inset in (b) shows of microbial biomass under Zinal was significantly lower
a detail of the subsoil root biomass. If statistically significant differ- compared to Mont-Calme 268. However, as the microbial
ences were present, these are indicated with letters, with variables biomass under Zinal was substantially higher compared to
sharing a letter not being significantly different. under Mont-Calme 268 in this layer (Fig. S3), this does not
necessarily imply that microbes under Mont-Calme 268 in-
corporated more excess 13 C compared to under Zinal. Depth
https://doi.org/10.5194/bg-17-2971-2020 Biogeosciences, 17, 2971–2986, 20202978 M. Van de Broek et al.: The soil organic carbon stabilization potential of old and new wheat cultivars
There was no significant effect of cultivar on the bulk den-
sity of the soil at the end of the experiment (F3,59 = 1.9,
p = 0.23), while there was a significant effect of depth on
bulk density (F4,59 = 19.4, p < 0.0005). The average bulk
density of all lysimeters was highest in the topsoil (1.67 ±
0.12 Mg m−3 ) and varied with depth (Fig. S4a). The gravi-
metric moisture content in the lysimeters at the end of the
experiment increased with depth for all cultivars, from ca
0.1 g g−1 in the top layer to ca. 0.15 g g−1 in the bottom
layer (Fig. S4b), and was only significantly different between
Mont-Calme 268 and Zinal in the uppermost soil layer. The
soil moisture content changed relatively little throughout the
experiment for all lysimeters, after an initial phase of de-
creasing soil moisture content at the onset of the experiment
(Fig. S2).
3.4 Excess 13 C and carbon rhizodeposition
The total amount of 13 C label that was present in the plant–
soil system at the end of the experiment, expressed as ex-
cess 13 C, differed significantly between different wheat cul-
tivars (Fig. 4a). When accounting for excess 13 C in above-
ground biomass and in the soil and roots down to a depth of
0.45 m, the lowest amount of 13 C label was found in the Zinal
lysimeters (1.19±0.11 g m−2 ), followed by CH Claro (1.64±
0.06 g m−2 ) and the older wheat cultivars (2.05 ± 0.09 g m−2
for Mont-Calme 268 and 2.01 ± 0.19 g m−2 for Probus),
with the majority of 13 C tracer in the aboveground biomass
(Fig. 4a). Despite these differences, the relative distribu-
tion of the assimilated 13 C between aboveground biomass,
roots and soil was similar between the different wheat cul-
tivars (Fig. 4b). On average, 80.7 ± 1.7 % of the assimilated
Figure 2. δ 13 C values of aboveground (a) and belowground (b) tracer ended up in aboveground biomass, 8.4 ± 1.5 % in root
biomass for the different wheat cultivars at the end of the exper- biomass and 10.9 ± 1.4 % in the soil. It is noted that root-
iment. Bars (a) and symbols (b) represent the average per wheat
respired 13 C label is not included in this analysis, which may
cultivar, error bars show the standard error (n = 3), and symbols
lead to an underestimation of the fraction of 13 C label that
without error bars indicate samples for which no three replicates
were available. Circles show the individual data points. If statisti- was allocated belowground.
cally significant differences were present for root biomass at the The total amount of net carbon rhizodeposition measured
same depth, these are indicated with letters, with variables sharing at the end of the experiment down to 0.45 m decreased
a letter not being significantly different and data points without error with depth for all wheat cultivars (Fig. 4c), with this dif-
bars being left out of the analyses. ference only being statistically significant for CH Claro.
The highest amount of net carbon rhizodeposition was ob-
served for Probus (108 ± 34 g C m−2 ), followed by CH Claro
profiles of microbial biomass carbon were relatively constant (97 ± 24 g C m−2 ), Mont-Calme (83 ± 29 g C m−2 ) and Zinal
(200–500 µg C g soil−1 ), with no consistent differences be- (62 ± 11 g C m−2 ). There was thus no clear relationship be-
tween different cultivars (Fig. S3). The δ 13 C values of soil tween the amount of net carbon rhizodeposition and year of
CO2 (δ 13 CO2 ) at the end of the experiment were similar for release of the wheat cultivars.
all wheat cultivars for the two uppermost layers (0–0.45 m)
(Fig. 3d). Deeper down the profile, the CO2 under the old 3.5 CO2 concentration and production
wheat cultivars was more enriched in 13 C compared to the
more recent cultivars, by an average of ca. 30 ‰. The only Throughout the experiment, the change in the CO2 concen-
statistically significant differences were detected in the low- tration of the two uppermost soil layers was limited, with
ermost layer, where the δ 13 C values of CO2 of Zinal and average values for the topsoil between 470 and 761 ppm
CH Claro were significantly lower compared to Mont-Calme for all cultivars (Fig. 5). Deeper down the lysimeters, rela-
268. tively constant CO2 concentrations were observed during the
Biogeosciences, 17, 2971–2986, 2020 https://doi.org/10.5194/bg-17-2971-2020M. Van de Broek et al.: The soil organic carbon stabilization potential of old and new wheat cultivars 2979 Figure 3. Depth profiles of organic carbon concentration (a), the δ 13 C value of organic carbon (b), the δ 13 C value of microbial biomass (c) and the δ 13 C value of soil CO2 (d), averaged per wheat cultivar at the end of the experiment. Error bars represent the standard error (n = 3). ∗ The initial soil indicates measurements performed on the soil that was used to fill the lysimeters prior to the experiments in (a) and (b) and measurements of the δ 13 CO2 depth profile at the beginning of the experiment in (d). Figure 4. Absolute (a) and relative (b) distribution of excess 13 C between aboveground biomass, root biomass and soil for the different wheat cultivars. Soil compartments are calculated down to 0.45 m depth. Panel (c) shows the total carbon rhizodeposition and root carbon for the upper two soil layers for the different wheat cultivars (0–0.45 m depth). Error bars represent the standard error (n = 3). In (a), letters indicate significant differences between the total amount of excess 13 C of the different cultivars. No significant differences in the amount of excess 13 C in aboveground biomass, root biomass or soil between the different cultivars were found. In (c), letters are provided when the total belowground C allocation differed between the different depth layers, which was only the case for CH Claro. https://doi.org/10.5194/bg-17-2971-2020 Biogeosciences, 17, 2971–2986, 2020
2980                M. Van de Broek et al.: The soil organic carbon stabilization potential of old and new wheat cultivars

                                                                      Figure 6. Depth profiles of calculated cumulative CO2 production
                                                                      (g CO2 m−2 per 0.05 m depth layer). Dots show the calculated pro-
                                                                      duction rates, thin lines show the calculated CO2 production for the
Figure 5. Changes in the CO2 concentration (ppm) in the lysimeters
                                                                      individual lysimeters and the thick lines show the average based on
throughout the experiment for the four wheat cultivars. The average
                                                                      three replicates (two for CH Claro).
CO2 concentration of three replicates are shown (n = 3). Dots indi-
cate the measured data points.
                                                                      4     Discussion
first 3 weeks of the experiment, ca. 5000–10 000 ppm. After           The aim of the present study was to assess differences in be-
3 weeks, subsoil CO2 concentrations abruptly increased and            lowground carbon transfer and net rhizodeposition by wheat
remained high throughout the experiment. These were sub-              cultivars with different root biomass and rooting depth. Our
stantially larger for the older cultivars (with maximum values        results show that although there are marked differences in
of ca. 30 000 ppm) compared to the younger cultivars (with            both the amount of carbon transferred belowground and the
maximum values ca. 24 000 ppm).                                       timing of belowground carbon transfer, there is no clear re-
   Despite these high CO2 concentrations in the subsoil, CO2          lationship between root characteristics and the amount of net
production was mainly taking place in the topsoil, with the           rhizodeposition. Therefore, the fate of root biomass might
highest rates of CO2 production between 0.10 and 0.20 m               determine the total amount of subsoil carbon stabilization in
depth for all cultivars (Fig. 6). For the young cultivars (Zinal      the long term.
and CH Claro), 95 % of CO2 was produced above a depth
of 0.3 m. In contrast, in older cultivars (Probus and Mont-           4.1    Plant biomass carbon dynamics and CO2
Calme 268) 95 % of CO2 was produced above a depth of                         production
0.55 and 0.6 m, respectively. Despite these observations, nei-
ther the calculated total amount of subsoil CO2 production            No consistent differences in total aboveground biomass be-
nor the depth above which 95 % of CO2 was produced was                tween old and new wheat cultivars were observed. The
significantly different between any of the cultivars.                 aboveground biomass values were at the high end of reported
                                                                      values for wheat plants in the field (Mathew et al., 2017),
                                                                      while the lack of consistent differences in the biomass of
                                                                      wheat cultivars released over a time span of multiple decades
                                                                      has generally been observed (Brancourt-Hulmel et al., 2003;
                                                                      Feil, 1992; Lupton et al., 1974; Wacker et al., 2002).

Biogeosciences, 17, 2971–2986, 2020                                                       https://doi.org/10.5194/bg-17-2971-2020
M. Van de Broek et al.: The soil organic carbon stabilization potential of old and new wheat cultivars 2981
The fraction of biomass in the grain-bearing ears was, old wheat cultivars (Fig. 6). Combined with the higher δ 13 C
however, much larger for the modern wheat cultivars (on av- values of subsoil CO2 of the lysimeters under the old wheat
erage 9 % and 47 % of total aboveground biomass for CH cultivars at the end of the experiment (Fig. 3d), this sug-
Claro and Zinal respectively) compared to the old wheat cul- gests that the roots of the old wheat cultivars respired CO2
tivars (on average 1 % and 2 % for Mont-Calme 268 and at greater depths compared to the recent wheat cultivars.
Probus respectively). While an increase in the fraction of The δ 13 C values of root biomass suggest that the temporal
biomass allocated to grains is generally observed in old ver- root carbon dynamics of the old and recent wheat cultivars
sus modern wheat cultivars (Brancourt-Hulmel et al., 2003; differed substantially (Fig. 2b). The root biomass of the old
Feil, 1992; Shearman et al., 2005), mostly as a consequence wheat cultivars had a high δ 13 C value at all measured depths,
of the introduction of reduced height genes (Tester and Lan- indicating that the 13 CO2 label was allocated to the roots at
gridge, 2010), the harvest index reported here for the old cul- all depths throughout the experiment. In contrast, the root
tivars might have been underestimated because older culti- biomass of the recent wheat cultivars was greatly enriched
vars were not yet fully mature at plant harvest. in 13 C in the top 0.45 m, while deeper roots were much less
The total root biomass of the older wheat cultivars was enriched in 13 C. This suggests that both old and more re-
substantially larger compared to the more recent cultivars, cent wheat cultivars grew roots down to depths of > 1 m in
although these differences were not consistently significant the beginning of the experiment (when the total amount of
between all modern and old varieties (Table 1). These differ- 13 C assimilated by the plants was limited), while only the
ences were mostly apparent in the top 0.45 m of the lysime- old cultivars kept on allocating carbon down to deep roots
ters (Fig. 1). It is not clear if the lack of statistically sig- (> 0.45 m) throughout the experiment (thus having assim-
nificant differences in the root biomass within the deeper ilated more 13 C over the period of root growth compared
soil layers was due to (i) inability to collect all fine roots to the more recent cultivars). The similar δ 13 C value of the
from the soil or (ii) actual differences in root biomass. These aboveground biomass of all wheat cultivars (Fig. 2a) suggests
results are in line with a recent study on the biomass of that the differences in δ 13 C values of the root biomass are
roots of different wheat cultivars of the Swiss wheat breed- unlikely to be caused by differences in the relative amount of
ing program, including the cultivars used in our experiment 13 CO assimilated by the plants, relative to unlabeled CO .
2 2
(Friedli et al., 2019). This study showed that, under well- Thus, these results suggest that old wheat cultivars allocate
watered conditions, older wheat cultivars had a substantially photosynthates down to their roots throughout a substantial
higher root biomass compared to the more recently released part of the plant growth phase, while this is not the case for
wheat cultivars. Similar results have been obtained for wheat more recent cultivars.
cultivars released in, e.g., Australia (Aziz et al., 2017) and
other countries around the world (Waines and Ehdaie, 2007). 4.2 Carbon allocation by wheat plants
The root : shoot ratios of the wheat cultivars in our study
(0.10 ± 0.2–0.19 ± 0.08, Table 1) were at the low end of re- The partitioning of the 13 C label was very similar between
ported values for wheat plants globally (Mathew et al., 2017) the different wheat cultivars (Fig. 4b). It is noted that the
but in line with reported values for wheat cultivars of the amount of rhizosphere-respired 13 CO2 could not be included
Swiss wheat breeding program, including the cultivars used in these calculations, although this typically accounts for
in our study (an average value of 0.14 for all cultivars studied ca. 7 %–14 % of assimilated carbon in crops, or 40 % of
by Friedli et al., 2019). total belowground C allocation (Kuzyakov and Domanski,
The maximum rooting depth was similar between the old 2000; Pausch and Kuzyakov, 2018). The fraction of assim-
and recent wheat cultivars (Fig. 1b). This is in contrast with ilated carbon that is transferred belowground reported here
the results from Friedli et al. (2019), who found that the older is therefore underestimated. The belowground transfer of ca.
wheat cultivars had deeper roots (the depth above which 95 % 20 % of assimilated C for all cultivars is in line with previ-
of roots were found (D95 ) was on average 101 cm) compared ous studies, which have reported fractions of similar magni-
to the more recent cultivars included in the present study (av- tude for wheat plants, when not accounting for rhizosphere
erage D95 of 85 cm). These differences might partly arise CO2 respiration: 18 %–25 % (Hirte et al., 2018), 18 % (as re-
from the different setup used in both studies. Both experi- viewed by Kuzyakov and Domanski, 2000), 15 % (Keith et
ments were carried out in a controlled greenhouse environ- al., 1986), 17 % (Gregory and Atwell, 1991) and 31 % (Sun
ment, but Friedli et al. (2019) used soil columns with a diam- et al., 2018). In contrast, reported values of the partitioning of
eter of 0.11 m, while in our study lysimeters with a diame- belowground translocated carbon by wheat plants to (i) roots
ter of 0.5 m were used. Additional information about subsoil and/or (ii) net rhizodeposition are much more variable, with
root dynamics could be obtained from the measured depth reported net rhizodeposition carbon as a percentage of to-
profiles of the CO2 concentration and 13 CO2 , with the lat- tal belowground carbon (root carbon and net rhizodeposition
ter only being measured in the last phase of the experiment. carbon combined) for wheat plants between 23 % (as sum-
The calculated depth profiles of CO2 production showed that marized by Kuzyakov and Domanski, 2000) and 72 % (Sun
CO2 was being produced down to greater depths under the et al., 2018). The results obtained here (68 %) are thus at
https://doi.org/10.5194/bg-17-2971-2020 Biogeosciences, 17, 2971–2986, 20202982 M. Van de Broek et al.: The soil organic carbon stabilization potential of old and new wheat cultivars
Table 2. Average belowground carbon allocation (net rhizodeposi- results in calculated values of total carbon rhizodeposition,
tion and root biomass combined) and net carbon rhizodeposition by down to a depth of 0.45 m, of 69–105 g m−2 for Mont-Calme
the different wheat cultivars, calculated down to a depth of 0.45 m 268, 88–138 g m−2 for Probus, 51–78 g m−2 for Zinal and
(variation is reported as the standard error, n = 3). No statistically 81–121 g m−2 for CH Claro, or uncertainties in the amount
significant differences in belowground C allocation or net C rhi- of carbon rhizodeposits between −18 % and +28 %. Further
zodeposition between any of the cultivars were detected.
research on the effect of the assumption of using root δ 13 C
values as a proxy for carbon rhizodeposits is thus necessary
Belowground Net C
to better quantify the effect on estimates of carbon sequestra-
C allocation rhizodeposition
tion.
(g m−2 ) (g m−2 )
CH Claro 131 ± 26 97 ± 24
Zinal 97 ± 14 62 ± 11 4.4 The effect of old and recent wheat cultivars on net
Probus 164 ± 38 108 ± 34 carbon rhizodeposition
Mont-Calme 268 154 ± 39 83 ± 29
Our results indicate that the old wheat cultivars, with deeper
active roots throughout the experiment and larger root
the high end of reported values. However, they were similar biomass, allocated more assimilated carbon belowground,
to results from a field study in Switzerland which used two although the differences were not statistically significant
modern Swiss wheat cultivars, among which was CH Claro (Fig. 4c, Table 2). However, we found no evidence that wheat
(58 %; Hirte et al., 2018). cultivars with larger root biomass lead to higher net carbon
rhizodeposition (Table 2). Our hypothesis, which stated that
4.3 Rates of net carbon rhizodeposition wheat cultivars with larger root biomass and deeper roots
would lead to larger amounts of net carbon rhizodeposition,
The total amount of carbon assimilated by the wheat cultivars could therefore not be confirmed.
that was transferred to roots and soil in the top 0.45 m at the The total amount of OC that will be stabilized in the soil
end of the experiment ranged between 97 ± 14 g m−2 (Zinal) by the studied wheat cultivars will therefore depend on the
and 164±38 g m−2 (Probus) (Table 2). It is noted that the to- long-term fate of the root biomass. The root biomass was
tal amount of belowground carbon translocation by the wheat higher for the old wheat cultivars, although these differences
plants is underestimated, as rhizosphere respiration could not were mainly limited to the upper 0.45 m of the soil. Due to
be included in our calculations. These numbers are in the the destructive sampling of vegetation and soil at the end of
range of reported values for wheat plants of 94–295 g m−2 the experiment, the fate of root biomass after harvest could
(as summarized by Keith et al., 1986) and the value reported not be assessed. Based on the results, one could therefore
by Kuzyakov and Domanski (2000) (150 g m−2 ), as well as hypothesize that the higher root biomass of old wheat cul-
the reported amount for two recent wheat cultivars of the tivars would lead to larger rates of carbon sequestration in
Swiss wheat breeding program (including CH Claro) of 110– the long term. Similarly, Mathew et al. (2017) suggested that
134 g m−2 (Hirte et al., 2018). growing grasses and maize plants would lead to larger SOC
In contrast to the total amount of carbon translocated be- stocks because these plants have the highest total and root
lowground, the amount of net carbon rhizodeposition was not biomass compared to growing crops with a lower biomass.
consistently different between the old and more recent wheat However, it is not straightforward to make predictions about
cultivars (62 ± 11–108 ± 34 g m−2 ) (Fig. 4, Table 2). These the amount of root biomass that will be stabilized in the soil
values are higher compared to values calculated by Pausch in the long term, as this depends on the efficiency with which
and Kuzyakov (2018) (18–34 g m−2 , depth unknown) and plant-derived biomass is incorporated in microbial biomass
Hirte et al. (2018) (63–73 g m−2 ; down to 0.75 m depth). (Cotrufo et al., 2013) and interactions between soil depth,
A large uncertainty associated with calculated values the microbial community composition and its substrate pref-
of subsoil carbon sequestration using isotopic labeling ap- erence (e.g., Kramer and Gleixner, 2008), among other fac-
proaches is related to the assumption that the isotopic en- tors. During the past century, there has been a continuing
richment of roots and rhizodeposits is similar (Eq. 4). This increase in the importance of wheat cultivars with smaller
simplification is made because of the difficulties in mea- root biomass (Fossati and Brabant, 2003; Friedli et al., 2019;
suring quantitative characteristics of rhizodeposits in a soil Waines and Ehdaie, 2007). This can have profound implica-
medium (Oburger and Jones, 2018) but leads to erroneous tions for OC stocks of soils under wheat cultivation, as rhi-
calculations of the amount of carbon rhizodeposition when zodeposition and root-derived carbon are the most important
this assumption is violated (Stevenel et al., 2019). To as- inputs of OC to the soil (Kong and Six, 2010). Testing the
sess the uncertainty of calculated values of subsoil carbon long-term effect of the gradual change in wheat cultivars on
sequestration, we calculated how these values differ when OC inputs to the soil would thus require experiments that run
the value of root δ 13 C is varied with ±25 % (Fig. S5). This over multiple growing seasons and allow the quantification
Biogeosciences, 17, 2971–2986, 2020 https://doi.org/10.5194/bg-17-2971-2020You can also read