The Impact of Dollar Store Expansion on Local Market Structure and Food Access
←
→
Page content transcription
If your browser does not render page correctly, please read the page content below
The Impact of Dollar Store Expansion on Local
             Market Structure and Food Access
           El Hadi Caoui                Brett Hollenbeck                 Matthew Osborne
            U of Toronto                UCLA Anderson                       U of Toronto

                                 Latest version: March 6, 2024∗
                                  First version: July 25, 2022

                                                 Abstract

           This paper studies the expansion of dollar store chains in the U.S. since 2008, which
       has generated public interest in their impact on retail markets and food accessibility.
       We show evidence that dollar store chains compete strongly with the grocery segment
       and find that their expansion has led to a large decline in the number of grocery
       stores and a significant reduction in fresh produce consumption for households with low
       income and high travel costs. We estimate a dynamic entry game of retail competition
       to understand the sources of dollar store success and use it to quantify the spatial
       reallocation of grocery retailers and the net impact on consumer-level outcomes.
       Keywords: retail industry, dollar store, food access, dynamic games
       JEL Classification: L13, D43, L51

   ∗
     Caoui: elhadi.caoui@rotman.utoronto.ca. Hollenbeck: brett.hollenbeck@anderson.ucla.edu. Osborne:
matthew.osborne@rotman.utoronto.ca. We are grateful to Emek Basker, Paul Ellickson, and Mathieu Mar-
coux for helpful discussions of this paper. We thank Victor Aguirregabiria, Hunt Allcott, Limin Fang, Paul
Grieco, Sylvia Hristakeva, Yao Luo, Chuck Weinberg and seminar and conference participants at the Univer-
sity of Toronto, UCLA, Rochester, UVA, Yale, JHU, UT Austin, U of Melbourne, Washington University of
Saint Louis, University of Iowa, Stanford GSB, Chicago Booth, IIOC, SICS, CEA, ISMS Marketing Science
Conference, ET Symposium, and the Food Access at Dollar Stores (FADS) Workshop for their helpful com-
ments and suggestions. The findings and conclusions in this paper have not been formally disseminated by
the U.S. Department of Agriculture (USDA) and should not be construed to represent any agency determi-
nation or policy. The analysis, findings, and conclusions expressed in this paper also should not be attributed
to Circana. This research was conducted in collaboration with USDA under a Third Party Agreement with
Circana. All estimates and analyses in this paper based on Circana, Inc. data are by the authors and not
by Circana, Inc.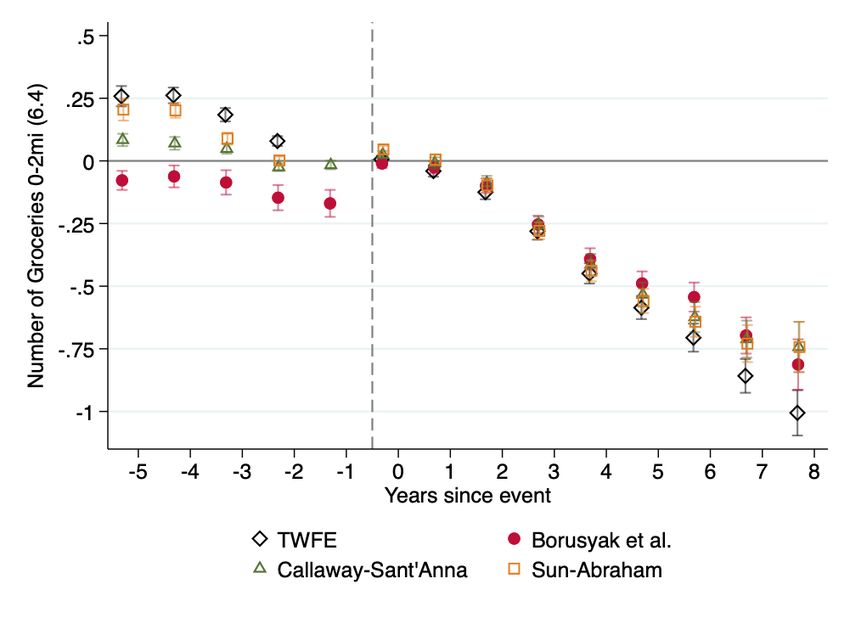
1       Introduction
The growth of large chain retailers over the past several decades has transformed the retail
sector in the United States, with implications for competition, labor markets, and aggregate
outcomes such as inflation and productivity. A more recent and less studied phenomenon
is the broad and dramatic rise of the dollar store retail format. Following previous waves
of growth by large retail chains, the three main dollar store chains (Dollar General, Dollar
Tree, and Family Dollar) have, in many ways, become the dominant mode of retailer in
many markets, impacting competition, affordability, convenience, and food accessibility for
a significant portion of the population.
    The distinguishing features of these chains are the use of single or limited price points,
particularly selling most goods for $1, and assortments consisting of small serving-size basic
consumables, clearance or irregular goods, and a lack of fresh produce. Beginning in the
1950s, these chains exhibited slow but steady growth over the decades that followed, es-
tablishing themselves primarily in small towns in rural areas. Following the 2008 recession,
several events combined to accelerate their growth. The recession itself may have made low-
price, small-format consumables more attractive for many by worsening household finances.
In 2007, Dollar General was bought out by a private equity firm who rationalized location
strategy, improved logistics, and set out on a new rapid growth plan. In 2015, the two
smaller chains, Dollar Tree and Family Dollar, responded by merging and accelerating their
own expansion plans in order to compete with Dollar General.
    Consequently, the growth of this format has been and continues to be exceptionally
rapid.1 During the period 2018-2021, roughly half of all retail stores that opened in the U.S.
were dollar stores. By 2021, there were more of these stores operating than all the Walmarts,
CVS, Walgreens, and Targets combined by a large margin.
    The expansion of dollar store chains has raised a number of policy issues: in particular,
many policymakers argue that the rapid entry of dollar store chains in their cities has either
forced out local retailers or deterred potential entry by competitors. One concern revolves
around the impact on neighborhood grocery stores, the exit of which may be especially
concerning to the extent it reduces access to produce and other perishable food items for
low-income residents, creating “food deserts.”2 These concerns and others have led many
    1
     The top three chains were collectively opening stores at the rate of 3.75 stores a day over the past decade
(authors’ calculations).
   2
     The USDA defines food deserts as census tracts that meet both low-income and low-access criteria
(Dutko et al. (2012)) including: (1) the poverty rate is greater than or equal to 20 percent or the median
family income does not exceed 80 percent statewide (rural/urban) or metro-area (urban) median family
income; (2) at least 500 people or 33 percent of the population is located more than 1 mile (urban) or 10
miles (rural) from the nearest supermarket or large grocery store. Other measures of access use different

                                                       1
localities to ban dollar store chains from entering or pass dispersal regulations limiting their
store density.3
Broadly speaking, the arguments for and against dollar store chains fall along these lines.
Proponents argue that they introduce additional choice into underserved retail markets and
that their strategy of entering in low-rent areas and opening multiple stores in the same
market results in greater convenience for customers who can make short trips for specific
items rather than long trips to the nearest big box store, which could be a large distance
away.
Opponents maintain that the aggressive entry strategy of dollar store chains has caused
the exit of local independent retailers and prevented the entry of other retailers. Even if
consumers value the convenience of the dollar stores, their strategy of offering basic con-
sumables and household products efficiently using a low fixed cost model and avoiding the
costly and complex provision of perishable food results in them capturing a large share of
nearby grocers’ profits. This could leave grocers unprofitable on the basis of food sales alone
and potentially lead to exit, reducing convenient access to fresh produce and exacerbating
nutritional inequality. Yet despite the extensive public and policy debate surrounding these
issues, the academic literature has yet to study these claims or the broader effects of dollar
store chain expansion.
In this paper, we provide new empirical evidence on the core issues in this policy debate.
Our primary research questions are the following: why has the dollar store retail model
been so successful and grown so rapidly? What has been the effect of dollar store expansion
on local retail markets? Downstream of market structure, what has been the effect on
consumer spending, particularly on fresh or perishable food? What would be the effect of
the proposed policies limiting dollar store growth, if implemented more widely? For each of
these questions, we go beyond average effects and analyze distributional impacts.
We leverage data from several sources. We track the number and type of retail stores,
including dollar stores, across the U.S. using the Supplemental Nutrition Assistance Program
(SNAP) Retailer panel, a yearly panel of SNAP-authorized retailers from 2008 to 2019. An
advantage of this dataset is that it covers small independent retail stores, which are typically
absent from other retail census used in the literature. We combine this with data on dollar
store distribution center locations and opening dates, as well as data from Nielsen TDLinx on
average per-store revenue. Finally, we match the data on store openings and closings to the
Circana (previously named IRI) Consumer Network panel, which contains household-level
thresholds (0.5 miles for urban and 20 miles for rural).
3
A partial list of cities that have banned dollar store entry or passed ordinances restricting the number of
dollar stores that may enter includes: Birmingham AL, Atlanta GA, New Orleans LA, Akron OH, Oklahoma
City OK, Tulsa OK, and Fort Worth TX. See https://ilsr.org/dollar-store-restrictions/
2data on all retail purchases for a large nationwide sample of consumers.
We first use an event study design to study the effects of dollar store entries on local
market structure. We control for market-level demographics and demographic trends, as
well as market-year fixed effects, and consistently find that dollar store entries are associated
with a significant decrease in the number of independent grocery stores.4 The effect size
is roughly the loss of one grocery store for every three dollar stores when measured in the
area 0-2 miles around the entry location. In the area 2-5 miles away, the effect size becomes
substantially smaller, suggesting the effects are local. The previous literature on the market
structure effects of retail chain expansion has shown that big box chains such as Walmart
do not compete intensely with local grocery stores due to vertical differentiation and their
spatial distribution (Ellickson and Grieco (2013)). Our results suggest that dollar stores’
vertical positioning and spatial pattern of entry, by contrast, have led to large negative
effects on grocery stores.
When studying how consumer shopping behavior changes with dollar store entry, we find
that households shift a share of their purchases away from grocery and convenience stores to
the dollar stores. Households also decrease their spending (and volumes purchased) on fresh
produce by modest but significant amounts (4% to 7.3%), an effect that is increasing in the
number of dollar store entries and acts in part through grocery store exits. This average effect
masks important heterogeneity across households: low-income households (annual income
less than $45,000) and households with high travel costs (proxied by vehicle access) experi-
ence large declines in fresh produce spending (around 15%) whereas high income households
(annual income above $70, 000) are not affected. This reduction in spending due to dollar
store entry explains between 13% and 27% of the difference in fresh produce spending be-
tween high and low income households. By contrast, we do not find evidence that dollar
stores lead to significant changes in spending on other food categories (e.g., canned produce,
dairy, meats).5
Next, we estimate a dynamic structural model of the entry and exit choices of dollar store
chains and their local competitors. The purpose of this model is twofold. First, it allows
us to account for general equilibrium effects from dollar store expansion. Indeed, while the
4
We follow the definition of “grocery stores,” which are distinct from “supermarkets and supercenters,”
used in the USDA SNAP panel. Grocery stores are primarily focused on selling food and consumable prod-
ucts, carry all four staple food categories, have annual revenue below $2m, and are generally independently
owned. Supermarkets/centers have annual revenue above $2m, carry all four staple food categories, are
part of a retail chain, and typically have ten or more checkout lanes with registers, bar code scanners, and
conveyor belts.
5
Our results complement earlier work on “food deserts,” such as Allcott et al. (2019), who find limited
impacts from grocery store entries on produce purchases of nearby households. We find consistent null results
on grocery store entries, but much larger (negative) impacts from grocery exits, suggesting an asymmetry
in how different changes to market structure impact consumer behavior.
3number of grocery stores may decrease in locations–defined as census tracts–near a dollar
store, new grocery entrants may subtitute to locations further away from the dollar store,
in a given market. The reduced-form analysis and event-study design provide suggestive
evidence for this subtitution effect, but they cannot provide a full picture of the spatial
reallocation of retail activity due to dollar store entry. Modeling the long-term spatial market
structure is therefore necessary to understand the net effects of this expansion. Second, the
model provides estimates of the size of dynamic entry and investment costs, as well as
the competitive effects between different store formats. This enables us to explore various
explanations for the success of the dollar store format.
In the structural analysis, we narrow our focus from the full national retail landscape to
small and medium-sized urban and rural markets. We focus on these markets because they
are central to the policy debate on dollar store entry restrictions: e.g., approximately 80
percent of Dollar General stores serve communities of 20,000 or fewer people. Moreover, the
relatively small number of retail players in these markets make them especially susceptible
to closure of existing stores and the associated reduction in food accessibility. Finally, when
accounting for retailers’ location choices, computational reasons limit the size of markets for
which we can solve for an equilibrium.
We model each store type’s entry and exit decisions as a dynamic oligopoly game following
Ericson and Pakes (1995) but with a spatial component along the lines of Seim (2006). The
key challenges in modeling this game in a tractable way are the complex nature of spatial
competition, which results in a high-dimensional game,6 and the dynamics that result from
the growth over time in dollar stores’ distribution networks, which reduces their fixed costs
of operating stores.
We take advantage of the fact that firms face a terminal choice when deciding whether
or not to exit, which generates a type of finite dependence (Arcidiacono and Miller (2011),
Arcidiacono and Miller (2019)). This property simplifies estimation of the game substantially
as it allows us to recover the firms’ value functions directly in terms of the period-ahead
probability of making the terminal choice. We leverage this property and estimate the
model using the linear IV strategy of Kalouptsidi et al. (2020). The latter paper combines
insights from the finite dependence approach and the GMM-Euler approach of Aguirregabiria
and Magesan (2018) to propose a method (ECCP) that circumvents integration over the
high-dimensional state space.7 As a methodological contribution, we extend the ECCP
6
For example, a market with four locations, three potential grocery stores, three potential convenience
store, and the three chains (which can open at most 2 stores per location) has a spatial market structure
with more than 650 million possible states.
7
Kalouptsidi et al. (2020) show how to incorporate serially correlated market-level unobserved heterogene-
ity in dynamic discrete choice problems, without having to specify the transition process for the market-level
4estimator from single-agent problems to dynamic games, highlighting and addressing an
important selection problem arising in games, and apply it in our setting with long-lived chain
entrants. This extension of the ECCP estimator is useful, more generally, because it simplifies
drastically the estimation of high-dimensional dynamic games with finite-dependence.
Our model estimation results provide a number of direct findings. Dollar store chains
have significantly lower costs of opening a new store than their independent rivals and are
substantially more profitable. Grocery and convenience stores suffer substantial losses when
located within 0-2mi of a dollar store. Estimates also point to strong demand cannibalization
within chains in the 0-2mi radius. Further, dollar stores benefit from scale economies when
locating stores in moderate proximity (2-5mi radius), through lower operating costs. The
growth in dollar stores’ network of distribution centers leads to a reduction in store operating
costs over our sample period. The results suggest that dollar stores are able to enter cheaply
and operate with low fixed costs (increasingly so over time) due to store-level economies of
density, a larger network of distribution centers, and not offering perishable produce. By
focusing sales on high-margin consumables, they are particularly harmful to nearby grocery
stores who are left selling mostly low-margin produce with high operating costs.
The model is used to evaluate how the retail landscape would evolve in the absence of
dollar store expansion, such as under proposed entry regulation policies. We quantify the
spatial reallocation of retail activity and cumulative reduction in the number of grocery and
convenience stores resulting from dollar store chain expansion across different market types,
as well as the impact on consumer outcomes that are central to the current policy debate,
e.g. travel costs and fresh produce spending. We find that, in the counterfactual scenario,
markets would experience a 54% increase in the number of grocery stores (e.g., on average
1.65 grocery stores per market as compared to just over 1 in the factual scenario) and a 47%
increase in the number of convenience stores.
We examine the distributional effects of these changes by controlling for market hetero-
geneity. The largest impacts on the number of grocery stores materialize in lower-income
markets, those with larger shares of minority populations, those with higher poverty rates,
and fewer households with access to a vehicle. Grocery store access improves substantially,
with the median distance to the nearest store falling from 2.4 miles to 1.5 miles. By con-
trast, dollar store access would change relatively little due to their widespread entry prior
to 2010. Finally, we combine our earlier reduced-form results on the impact of changes in
market structure on produce spending with the structural results on the net impact of dollar
variables. The latter is achieved by invoking rational expectations and replacing expected behavior with
observed (realized) behavior in the data. One benefit of this approach is that it does not require integrating
over the state space when evaluating period-ahead value functions.
5store expansion. We find that low-income markets would, on net, purchase 6-9% more fresh
produce in this counterfactual.
We do not explicitly weigh the various measures of consumer-level outcomes against each
other in a unified framework to attempt a calculation of consumer welfare. Doing so prop-
erly would require an additional structural model of both store and category-level spending
choices that incorporates travel costs and the long-run impacts of different nutritional choices.
It would also require store-level market share data which are typically not available for most
independent stores.
Related Literature. This paper contributes to three lines of research in economics.
The first is the study of the evolution of the U.S. discount retail sector. This literature
has focused on the impact of big box retailers (e.g., Walmart, K-Mart) and the supercenter
format on market structure and competition (Jia (2008), Zhu and Singh (2009), Basker and
Noel (2009), Igami (2011), Ellickson and Grieco (2013), Grieco (2014)), on labor markets
(Basker (2005)), and the role of chain and density economies (Holmes (2011), Ellickson et al.
(2013)). A key finding in this literature is that Walmart’s entry primarily impacted larger
chain retailers in the local area within two miles of entry (Ellickson and Grieco (2013)). Small
local retailers were not substantially harmed due to travel costs and horizontal and vertical
differentiation between firms. The dollar stores’ vertical positioning and spatial pattern of
entry, by contrast, suggest they could be direct competitors to small local retailers and have a
large impact on local retail markets as a result. The rise of the dollar store format, therefore,
has a distinctive impact on retail and raises unique policy questions.
Our findings are in line with recent and emergent work studying the dollar store format:
Feng et al. (2023) show that, despite their limited food assortments, dollar stores represent
a growing share of food purchases especially in small markets. Chenarides et al. (2021) find
that dollar store entry in a food desert area increases the likelihood that it remains a food
desert; Lopez et al. (2023) show that dollar store entry is associated with grocery store exit,
lower retail employment and sales, with these effects being larger in rural communities. In
concurrent work, Chenarides et al. (Forthcoming) study the impact of dollar store expansion
using a dynamic model of entry and data from Texas. They find that dollar stores benefit
supermarkets by displacing the competitive fringe of small independent retailers. Their ap-
proach differs from ours as they assume stationarity, model spatial differentiation as a choice
of market-level store density (rather than location choices), and do not consider households’
shopping behavior. Explicitly modelling firms’ location choices is important because dollar
store entry may lead to a spatial reallocation of grocery store activity: e.g., the number of
grocery stores may decrease near dollar stores but increase further away in a market. These
general equilibrium effects should be accounted for when assessing the net impact of this
6expansion. In subsequent work, Schneier et al. (2023) investigates the effects of the first dol-
lar store entry in a zipcode on prices paid and basket size. Cao (2022) studies the effect of
dollar stores’ entry in terms of increased retail variety and supply of private-label products.
Second, this paper is related to the study of consumers’ grocery shopping behavior and
food accessibility. There is an extensive literature studying nutritional inequality in the
U.S., with studies focusing on price-, access-, and nutrition education-based interventions
(Levi et al. (2019)). Studies of food access have focused on introduction of grocery stores
to markets designated as “food deserts,” with case studies around individual store entries
having found mixed results (Cummins et al. (2005), Cummins et al. (2014), Elbel et al.
(2015), Dubowitz et al. (2015), Liese et al. (2014), Rose and Richards (2004), Ver Ploeg
and Rahkovsky (2016), Weatherspoon et al. (2013).) Notably, Allcott et al. (2019) study a
large number of grocery store and supermarket entries and find they have only small effects
on the nutrition of nearby consumers and that nutritional inequality in the U.S. is largely
explained by demand factors rather than limited food access, with differences in access and
prices, explaining only about 10% of nutritional inequality. Levi et al. (2020) find that access
to grocery stores impacts fruit and vegetable spending by affecting shopping frequency, but
only among households with a low value of nutrition and at distances of less than 1 mile.
Hristakeva and Levine (2022) leverage hurricane-induced temporary grocery store closures
to detect supply-side effects and find that households affected by these closures shift the
location and nutritional value of their purchases for a substantial period of time even after
the grocery store has reopened. Byrne et al. (2022) study the effect of SNAP participation by
retailers on consumers’ shopping behavior and participating stores’ inventory and revenue.
They find that new SNAP retailers have a limited inventory of foods (e.g., no fresh produce)
and do not significantly impact SNAP-eligible households’ nutritional choices or prices paid
in the 6 months following adoption.
We contribute to this literature by studying large numbers of dollar store and grocery
store entry events, as well as large numbers of grocery store exits, to measure the impact
of these events on households’ shopping behavior, including spending on produce. We find
results consistent with previous research (e.g., Allcott et al. (2019)) that entry of a grocery
store or supermarket has a limited impact on shopping behavior and nutritional choices, but
we depart from this literature in that we find that the exit of existing grocery stores and
the entry of large numbers of dollar stores do have significant impacts on food purchases. If
consumers’ shopping behavior is characterized by inertia or habit persistence, as suggested
by the choice literature in marketing (Seetharaman et al. (1999), Dubé et al. (2010)), this
could generate asymmetric effects between grocery store openings and closings. Our results
are therefore consistent with other work (e.g. Dubois et al. (2014)) finding that the supply
7side has a meaningful impact on nutritional outcomes.
Finally, this paper is related to the literature using dynamic games to study the market
structure impacts of retail chains (Arcidiacono et al. (2016), Zheng (2016), Igami and Yang
(2016), Hollenbeck (2017), Beresteanu et al. (2019), Fang and Yang (2022)). We depart from
the existing literature in two ways. First, we account for the fact that over the sample period,
dollar store chains have been growing their networks of distribution centers; incorporating
this dynamic aspect of the industry is clearly important to better match observed entry
patterns. Second, most previous dynamic game studies (Zheng (2016) being an exception)
abstract from the spatial nature of retail competition. Because retail location choices are
crucial in shaping the competitive environment (Ellickson et al. (2020)), we model firms’
entry decisions into spatially differentiated locations as in Seim (2006) and Datta and Sudhir
(2013).
The rest of the paper proceeds as follows: Section 2 describes the data and institutional
details and provides descriptive statistics. Section 3 presents reduced-form static and dy-
namic event study results for the impact of dollar store entry on local market structure and
consumers’ shopping behavior. Section 4 introduces the dynamic entry and exit game. Sec-
tion 5 discusses our market definition and the identification and estimation of the dynamic
game. Section 6 shows the estimation results. Section 7 presents the counterfactual analysis.
Section 8 concludes.
2 Industry Background, Data, and Descriptive Statis-
tics
In this section, we describe the history and nature of the dollar store chains, present our
data sources, and provide some descriptive statistics on the industry.
Dollar General originated the dollar store concept in 1955, selling a wide selection of
low-cost basic goods at a single $1 price point. The format became popular and a number of
competing variety retailers adopted it, including Family Dollar, founded in 1959. Through
decades of steady growth and consolidation among competing chains, by the 2000s there
remained three major dollar store chains: Dollar General, Family Dollar, and Dollar Tree.
These chains distinguish themselves from other retailers by offering low prices in the form
of a single price point or a limited number of round number price points.
Unlike other discount retailers like Aldi, they do not achieve their discounts by offering
small selections and a large share of private labels. Instead, they offer moderately sized
8selections and a mix of major brand products and private labels.8 The stores are built in the
8,000-12,000 sq ft range and carry 10,000-12,000 SKUs. They also save costs by employing
few employees and not offering fresh produce. They primarily sell basic consumables in small
formats, seasonal products, and irregular or outdated products off-loaded by major brands.
Another distinguishing feature is their market entry strategy, with a focus on small and low
income markets under-served by big box retailers. We discuss these markets in greater detail
below.
The dollar store chains have grown rapidly over the past several decades, particularly so
after the recession of 2008. By 2021, Family Dollar operated roughly 7,100 stores, Dollar
General operated 18,000 stores, and Dollar Tree owned 4,350 stores. The combined nearly
30,000 stores are substantially more than the number of Wal-Marts (5,300 stores), Targets
(1,900 stores), CVS (9,900 stores), and Walgreens (9,300 stores) combined and is signifi-
cantly larger than the number of Subway restaurants (21,000 restaurants), the largest U.S.
restaurant chain and is similar to the number of Starbucks locations worldwide. The three
chains earned a combined $47 billion in revenue in 2019.
In 2015, the two smaller chains, Dollar Tree and Family Dollar, merged citing several
potential complementarities between the two businesses: e.g., targeting broader ranges of
customers, optimizing their combined real estate portfolio, exploiting synergies in sourcing,
procurement, and distribution networks.9 Nonetheless, integration of the two chains has been
slow over the following years: the two chains have continued to be run independently, both
from a store operations and supply chain perspective. For example, store support centers
were not consolidated by 2019, and distribution networks were largely run independently
until 2020 (Dollar Tree (2018) and Figure A6).10 This motivates our treatment of the two
chains as separate over our sample period ending in 2019.
Data: We combine several data sources to study dollar store expansion and the effects on
consumers and local market structure.
The first is the SNAP Retailer panel, a yearly panel of SNAP-authorized retailers from
2008 to 2019. This dataset contains information on over 400,000 U.S. retailers including
their chain affiliation and store type, as well as small independent retailers. The SNAP
retailer panel contains any store that accepts SNAP benefits. In addition to dollar stores,
this includes convenience stores, combination stores (stores selling a combination of general
8
For instance, private labels represented 12% of Dollar General’s merchandise mix (Shih et al. (2019)).
Hristakeva (2022) shows how retailers can strategically leverage assortment choices to capture preferential
contracts from their suppliers.
9
“Dollar Tree completes acquisition of Family Dollar.” Dollar Tree, Press Release, July 6, 2015.
10
In 2020, two new distribution centers were opened serving both banners, e.g., Ocala, FL, and Rosenberg,
TX.
9merchandise and food products), grocery stores, drugstores, gas stations, supermarkets, and
supercenters. We use the store type variable provided in the SNAP Retailer panel (rather
than the store name) to classify stores by type (e.g., dollar, grocery, convenience store).
Table 1 shows store counts by type in the SNAP panel. As far as we know, the SNAP
retailer data is novel in the economics literature.11 The primary benefits of this public data
source are that it is an annual measure and contains nearly the full universe of retailers in
this industry. Crucially for this study, the panel includes small independent stores, which
are typically absent from other retail census data used in the literature.
A drawback of this dataset is that entry into the SNAP program may not necessarily
indicate the start of operation of a physical store. In particular, as the SNAP program
debuted in 2008, there may have been delays in stores joining the program for the first few
years. We alleviate this concern in two ways. For chains, we can compare store counts in the
SNAP panel against publicly disclosed store counts in chains’ annual reports to investors. We
do not find any significant discrepancies between the two sources. For independent stores,
this approach is not possible: instead, we drop the first few years in the sample and restrict
our analysis to the period from 2010 to 2019.
Table 1: Number of SNAP retailers by type (all U.S.)
Store type Number of stores
Grocer 65,240
Supermarket/center 51,695
Small retail 283,140
Combination Grocery/Other 78,174
Convenience Store 204,966
Note: Combination grocery/Other includes dollar
stores and drug stores. Convenience stores include gas
stations.
We also compile data from the Circana Consumer Network panel, which we complement
with the Circana MedProfiler dataset.12 The Consumer Network data contains household-
level panels on all retail purchases for a nationwide sample of consumers. The MedProfiler
data contain nutritional information for food purchases (e.g., sugar, sodium) and consumer
health metrics (e.g., BMI). We observe the census tract a household resides in, which is
11
The dataset has been used in the geography literature studying retail proximity (e.g., Shannon et al.
(2018)).
12
The Circana Consumer Network household panel data come from the National Consumer Panel (NCP),
a joint venture between Circana and Nielsen to collect consumer data to provide consumer and marketing
insights. For more backgorund about the history and applications of scanner data in economics research, see
Dubois et al. (2022).
10more precise than other scanner datasets (e.g. Nielsen Homescan provides the household’s
zipcode). This allows us to conduct our analysis at a more granular geographic level and
construct more precise measures of retail proximity. Although the household scanner data
is standard in the IO literature, we include informative summary statistics of spending by
retail channel and food category in Table A2 of the Appendix.13 These statistics show that
spending at dollar stores is relatively low compared to other retail channels (e.g., supermar-
kets, supercenters). The largest expenditure share at dollar stores is for soda, snacks, candy,
and crackers; whereas fresh produce spending is close to zero.14
Finally, we collect market-level data on demographic characteristics from the Census
and ACS at the census tract level. This allows us to study how market characteristics and
consumer demographics affect dollar stores and other retailers’ entry behavior and profits.
We also collect data on distribution centers of dollar store chains over time, namely the
locations and opening dates for the three major chains.
Figure 1 shows the total number of stores at the national level over the period 2010-
2019. The total number of stores operated by the three major dollar store chains increases
by 12,870 during this period. This increase is the net effect of 14,554 store entry events
and 1,684 store exit events. The number of independent retail stores also increases, with
this growth driven by convenience stores (71,010 store entries and 42,363 store exits). The
number of grocery stores falls by 13% from its high in 2012.
We present the evolution of dollar store chains’ distribution centers over time, in Figure
A5 of the Appendix. Between 2000 and 2020, the number of distribution centers increases
substantially from 14 to 42. This leads to a decrease in the average distance between a
market and a distribution center, which falls by roughly 125 miles for Dollar General and
slightly smaller amounts for the other two chains.15 The locations of these in 2019 are shown
in Figure A6.
We use demographic information from the Census and the Circana Consumer Network
to document consumer heterogeneity across locations with varying dollar store densities.
Table 2 shows summary statistics of census demographic information for the locations entered
13
We note that the “Grocery” retail channel in the Circana data includes both grocery stores and super-
markets. In this paper, when studying the impact on market structure, we distinguish between independent
grocery stores and supermarket chains.
14
Studies have compared household scanner data with data from other sources (e.g., Consumer Expenditure
Survey, FoodAPS, and supermarket chains’ own databases) to assess differences in reporting, see for instance
Einav et al. (2010) for Nielsen Homescan and Sweitzer et al. (2017) for Circana Consumer Network. These
studies find discrepancies in reported prices and consistently lower expenditures in the household scanner
datasets, especially for unpackaged and random weight products. Therefore, our measures of annual spending
likely underestimate the true value. To alleviate this problem, we perform robustness checks in our reduced
form analysis by imposing a minimum number of weeks a household reports spending.
15
We provide details about the market definition used in Section 5.1.
11Figure 1: Store counts by firm type
70000
Store counts
50000
30000
2010 2012 2014 2016 2018
Year
Convenience Dollar Grocery
by dollar store chains prior to 2010, during the 2010-2019 period, and locations never entered.
A location is defined at the Census Tract level. Dollar store entry occurs in locations that
have significantly lower incomes per capita and rents than other locations, and a significantly
higher share of the population that is black or below the poverty line. Entered locations are
also significantly closer to distribution centers than non-entered locations.16
Finally, we characterize the household types that display a revealed preference for the
dollar store format. First, we compare the demographics of households with a large spending
share at the dollar store channel (top 95th percentile and above) post-dollar store entry to
households with no spending at the dollar store channel post-entry. This comparison is only
among households in locations with dollar store entries and is shown in Table 3. Comparing
columns 1 and 2 shows that these two groups differ on several dimensions: households with
high dollar store spending shares are significantly more likely to be low income, with a female
household head, from a minority group, unmarried, unemployed, and without access to a
vehicle. The latter group also spends less on fresh produce and at the grocery retail channel.
Second, to isolate preferences that are not merely due to dollar store proximity, we
identify households with high dollar store spending who have no dollar stores within 2 miles.
16
The patterns that emerge using the Census or ACS data are consistent with household demographics in
the Circana Consumer Network panel. Table A3 in Appendix E shows that households experiencing many
dollar stores entries have lower (household) income, are more likely to have a female household head, without
children, and are less likely to be white, married, employed, with access to a vehicle.
12Table 2: Market Summary Statistics
(1) (2) (3)
Pre-2010 Entry Only 2010-2019 Entry Never Entered
N 9778 12872 50378
Mean Population 4689.9 4962.8 4263.9
(2193.5) (2566.1) (2295.8)
Mean Income 22686.3 23538.8 31315.2
(7520.7) (8178.7) (16696.5)
Mean Residential Rents 753.9 785.9 1064.8
(252.6) (275.4) (455.8)
Mean Share White .738 .739 .713
(.24) (.253) (.254)
Mean Share Black .166 .162 .127
(.225) (.234) (.210)
Mean Share in Poverty .176 .165 .136
(.108) (.106) (.118)
Share HH w/ Vehicle Access .911 .917 .904
(.084) (.091) (.135)
Mean Distance to DG DC 157.8 171.8 227.9
(134.1) (142.5) (292.9)
Mean Distance to DT DC 188.2 191.4 189.5
(111.2) (119.7) (239.8)
Mean Distance to FD DC 190.1 207.2 275.2
(124.2) (126.1) (296.3)
Notes: Unit of observation is the Census Tract. Means are computed using 2019 data. Standard
deviation across tracts appears in parentheses below each row.
All else equal, these households are willing to travel longer distances to shop at this store
format and may, therefore, benefit from entry as it reduces their travel costs. To implement
this comparison, we select the sample of households with no dollar stores within 2 miles
and regress their dollar store spending per year on household demographics (age, income,
education, race, household size, marital status, occupation, and weekly hours worked), their
retail environment (number of stores by format within 2 miles and from 2 to 5 miles of
the household), and the survey year. Controlling for the retail environment is important
because low-income households with no dollar stores within 2 miles may also lack access to
other retailers (grocery and supermarkets).
We find that the main dimensions of heterogeneity are race and household income. Figure
2 shows the estimated coefficients for income and race. Low income households and black
households have significantly higher spending at dollar stores, even when such stores are
located far from the household.
13Table 3: Demographics of Circana panelists experiencing at least one dollar store entry over
the sample period
By DS Spending Share Post-DS Entry
Variable No Spending High Spending (Top 5%) ∆ (t-stat)
Income (000s) 75.08 (45.68) 41.02 (32.38) 96.6
Low-Income (100k) 0.22 (0.42) 0.04 (0.20) 71.7
Years education 15.13 (2.18) 13.91 (2.08) 57.5
No female head 0.17 (0.38) 0.14 (0.34) 9.6
No male head 0.24 (0.42) 0.42 (0.49) -36.9
With children 0.17 (0.37) 0.12 (0.33) 13.8
Age 57.00 (13.10) 59.47 (11.41) -20.8
Household Size 2.21 (1.22) 2.00 (1.17) 17.8
White 0.83 (0.37) 0.65 (0.48) 38.1
Black 0.08 (0.26) 0.26 (0.44) -44.1
Married 0.60 (0.49) 0.45 (0.50) 30.3
Employed 0.57 (0.50) 0.41 (0.49) 32.3
No vehicle 0.04 (0.20) 0.10 (0.30) -8.5
Pre-Entry Fresh Produce Spending 142.10 (140.42) 66.64 (69.54) 88.2
Pre-Entry GS Channel Spending 1929.54 (1434.27) 1186.75 (965.85) 69.6
Pre-Entry DS Channel Spending 2.20 (24.76) 223.87 (267.30) -88.7
Observations 63,535 11,452
Note: The unit of observation is the household-year, for the subsample of households who experience at
least one dollar store entry within 2 miles over the sample period. The table shows mean values and standard
errors are in parenthesis. Columns (High Spending) shows households with a share of spending at the dollar
channel in the 95th percentile or above (9% of total spending). For households with two household heads,
we use the mean of age, employment hours, educational attainment for male and female household heads.
Household Income is available in 12 bins. Mean income is computed by taking the mid-range of each bin.
The top bin (>$100k) is coded as $150,000.
3 Reduced Form Analysis
3.1 Effects on Market Structure
In this section, we present evidence on the impact of dollar store chain entry on local retail
markets. Our goal is to evaluate whether or not dollar store chain entry leads to decreases in
the number of local independent retailers. We use our data containing the annual universe
of retailers and study the period of rapid expansion of dollar store chains between 2010 and
2019.
During this time period, we observe 14,554 dollar store chain entries. To study the local
effects of these entries, we break markets into locations defined as Census tracts. For each
location, we obtain its population-weighted centroid and define distance bands around each
location using radii of 0-2mi, 2-5mi, and 5-10mi (see Ellickson and Grieco (2013) for a similar
approach). Our main outcome of interest is the number of independent grocery stores.
Our identification strategy for measuring the effects of dollar store chain entry on these
outcomes is to use tract-level fixed effects to account for time-invariant unobserved market
1440
DS Spending Relative to Bin 1 (Mean: $24.1)
20
DS Spending Relative to White (Mean: $23.6)
20
15
0
10
-20
0 5
-40
2 3 4 5 6 7 8 9 10 11 12
Household Income Bin Black Asian Other
Figure 2: These figures show the estimated coefficients on income and race in the regression
of dollar store spending on household demographics and their retail environment. Results
are for the subsample of households with no dollar stores within 2 miles. Year fixed effects
are included. For household income, the first bin corresponds to income less than $10, 000,
bin 7 corresponds to income in the range $35, 000 to $45, 000, bin 10 to income in the range
$60, 000 to $70, 000, the highest bin corresponds to income greater than $100, 000 per year.
Standard errors are clustered at the household level.
characteristics and county-year fixed effects to account for time-varying trends at the mar-
ket level. We also incorporate time-varying demographic variables at the census tract level.
These are intended to control for local trends in population or income associated with eco-
nomic shocks. We include population, median income, and level of residential rents as well
as the annual growth rate in each of these variables. We also include a time-varying measure
of overall business activity by constructing the total number of active businesses (excluding
grocery and dollar stores) at the tract-year level, which we label “business density.” We
include both the level and annual growth rate in business density as additional controls.
We estimate effects using the following specification:
Ylbt = δDSlt + βXlbt + λl + αmt + lbt (1)
where λl and αmt represent location and county-time fixed effects, and the objects of interest
δ are the coefficients on the number of dollar store chain entry events in location l in period
t. The outcome variable Ylbt is the number of independent grocery stores at distance band
b around the entry location l in period t. We also define Xlbt , the local demographics
(including growth rates), at this level. To capture potential non-linear effects of changes in
market structure, we include DSlt as a categorical variable.
In Table 4 we show results for different specifications of controls and fixed effects where
15the outcome variable is the number of independent grocery stores in location l. We find
that, once location fixed effects or demographic controls are included, there is a consistent
negative effect on the number of independent local grocery stores that is increasing in the
number of dollar store entries. This effect is small for a single dollar store entry, but increases
to -.32 for two entries, and a decrease of more than 1 grocery stores in locations with 3+
entries.
Table 4: Effects of DS Entry (0-2mi) on Number of Grocery Stores
(1) (2) (3) (4) (5)
All Markets All Markets All Markets All Markets All Markets
First DS Entry 3.148∗∗∗ -0.391∗∗∗ -0.109∗∗∗ -0.0717∗∗∗ -0.0705∗∗∗
(0.0612) (0.0439) (0.0147) (0.0137) (0.0160)
Two DS Entries 6.925∗∗∗ 0.0282 -0.557∗∗∗ -0.323∗∗∗ -0.307∗∗∗
(0.124) (0.0877) (0.0300) (0.0267) (0.0289)
Three+ DS Entries 12.49∗∗∗ 1.378∗∗∗ -1.716∗∗∗ -1.036∗∗∗ -0.976∗∗∗
(0.253) (0.174) (0.0636) (0.0512) (0.0521)
Year FE Yes Yes Yes Yes Yes
Demographic Controls Yes Yes Yes Yes
Business Density Yes
Census Tract FE Yes Yes Yes
Market × Year FE Yes Yes
Observations 706,730 560,612 559,846 557,635 453,657
F-stat 1433.6 1561.8 128.1 87.3 89.6
Adjusted R2 0.072 0.59 0.98 0.98 0.98
Mean Pre-Entry 2.71 2.71 2.71 2.71 2.71
Notes: Unit of observation is the location-year. Standard errors (in parenthesis) clustered at the location
level. Controls for time-varying local demographics (income, population, residential rents, and the one-
year percent change in each) and business density are included.
Table 5 shows how these effects vary by the distance from the entry location. We study
regions defined by radii of 0-2mi, 2-5mi, and 5-10mi from the entry location.17 The results
show a substantial fall in the number of grocery stores in the 2-mile radius around where the
dollar store entry occurs. In the area 2-5 miles from the dollar store entry, there is a smaller
but still significant effect when there are more than one entrant, and in the area 5-10 miles
away there are no detectable negative effects of dollar store entry.
Three conclusions follow from these results. First, the negative effect of dollar store
entry on grocery stores that we find is not spuriously driven by larger market-level or regional
economic shocks. Second, shopping patterns for dollar stores and independent grocery stores
seem to take place primarily over fairly small distances. The spatial patterns (Table 5) are
17
Each demographic variable is calculated for the region where effects are being measured.
16also consistent with new grocery stores substituting to locations further away from dollar
stores. This spatial reallocation of grocery store activity due to dollar store entry motivates
the structural model introduced in Section 4. Third, in the local area in which a dollar store
entry takes place the effects on grocery stores is increasing in the number of dollar stores
that enter.
Table 5: Effect of DS Entry (by distance band) on Number of Grocery Stores
(1) (2) (3)
0-2m 2-5m 5-10m
First DS Entry -0.0705∗∗∗ -0.108∗∗∗ 0.0293
(0.0160) (0.0184) (0.0180)
Two DS Entries -0.307∗∗∗ -0.224∗∗∗ 0.0578
(0.0289) (0.0332) (0.0347)
Three+ DS Entries -0.976∗∗∗ -0.509∗∗∗ 0.286∗∗∗
(0.0521) (0.0581) (0.0614)
Demographic Controls Yes Yes Yes
Business Density Yes Yes Yes
Census Tract FE Yes Yes Yes
Market*Year FE Yes Yes Yes
Observations 453,657 307,321 263,488
F-stat 89.6 29.9 14.2
Adjusted R2 0.98 0.99 0.99
Mean Pre-Entry 2.72 3.97 6.28
Notes: Unit of observation is the location-year. Standard er-
rors (in parenthesis) clustered at the location level. Time and
location fixed effects are included. Controls for time-varying
local demographics (income, population, residential rents, and
the one-year percent change in each) and business density are
included, each is calculated for the radius area corresponding to
the dependent variable.
Next, we perform an event study analysis to visualize these results over the years before
an after the dollar store chain entry occurs. In this specification, we estimate the model
X
Ylbt = δτ El,t−τ + βXlbt + λl + αmt + lbt (2)
τ
where Elt denote a dummy for whether a dollar store entry has occurred in location l by
period t. This differs from the specification in equation (1) in that now the coefficients on
dollar store entry are subscripted by τ , the difference in years measured relative to the entry
date. This allows for both dynamic policy effects, such as a delay in the effect on local
markets as the dollar store’s sales ramp up, and for detecting the presence of pre-trends in
17grocery store activity prior to dollar store entry. For this analysis, we also focus only on
a binary dummy for whether or not an entry occurs, rather than the number of entries as
used above. The omitted category is τ = −1 so that all cumulative effects are relative to
the period before entry.
This design is essentially a Difference-in-Difference with two-way fixed effects (TWFE)
and a staggered roll-out of treatment. This type of empirical design has been shown to have
the potential for biased results (Goodman-Bacon (2021), Sun and Abraham (2021)). Con-
sequently, we present results based on heterogeneity-robust estimators, e.g., Callaway and
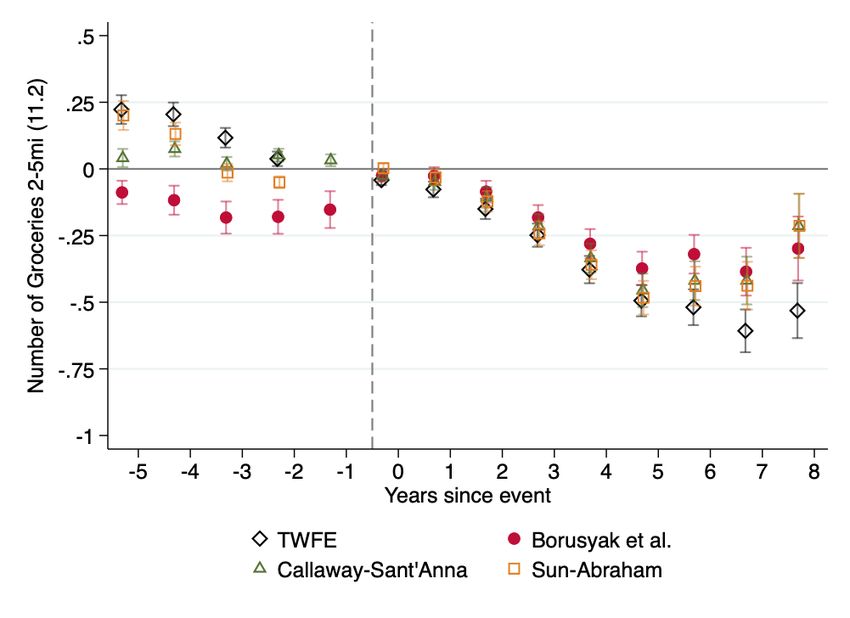
Sant’Anna (2021).18 We plot the results in Figure 3 in the manner suggested by Freyalden-
hoven et al. (2021), with confidence intervals adjusted for multiple hypothesis testing. The
left panel shows the effects of dollar store entry on the number of grocery stores in the 0-2mi
radius and the right panel shows effects in the 2-5mi radius. In both panels, we detect no
pre-trend in the number of grocery stores, followed by a clear downward trend after the
time of dollar store entry. Several years after the initial dollar store entry, the effect on the
number of grocery stores grows quite large.
Figure 3: The effects of dollar store entry on local independent grocery stores measured in
the 0-2 mile radius around entry (left panel) and in the 2-5 mile radius around entry (right
panel). Results are from an event study analysis using a heterogeneity-robust estimator
proposed by Callaway and Sant’Anna (2021). Confidence bands show the uniform sup-t
confidence intervals adjusted for multiple hypothesis testing.
18
In Figure A2 of Appendix E, we present results from the TWFE implementation as well as several other
heterogeneity-robust estimators based on imputation (Borusyak et al. (2021)) and manual aggregation (Sun
and Abraham (2021)) that have been suggested in the literature and they provide consistent results.
183.2 Effects on Consumers’ Shopping Behavior
This section studies how dollar store entry and grocery store exit affects households’ shopping
behavior. We exploit variation in local supply within household in an event study framework,
as in Allcott et al. (2019). We begin by analyzing how the changes in market structure
highlighted in the previous section affect aggregate food spending. Next, we show that the
adverse impact of dollar store entry on the number of grocery stores is reflected in spending
and trip diversion from the grocery to the dollar store retail channel. Finally, we examine
how the above market structure changes translate into spending on various food categories
and the nutritional value of households’ shopping baskets. We aim attention at spending
and volume of purchases of fresh produce, specifically, because access to this particular food
group has been at the center of the dollar store policy debate.
In this section, the unit of analysis is the household–year. We again consider both static
and dynamic (event study design) specifications. Let DSbct denote the number of dollar store
entries that have occurred within distance band b (e.g., 0-2mi, 2-5mi) from census tract c
by period t. Let Xit denote time-varying household characteristics (e.g., age, education,
employment, marital status). Let Yict denote the outcome variable for household i living in
census tract c in period t. We consider the following static specification
Yict = δDSbct + βXit + γi + ηt + ict (3)
where γi and ηt are household and time fixed effects.
As the effects we estimate are likely persistent and heterogeneous over time, we also
consider a dynamic specification in an event study framework. Let Ebct denote a dummy for
whether a dollar store entry has occurred within distance band b (e.g., 0-2mi, 2-5mi) from
census tract c by period t. We consider the following dynamic specification
X
Yict = δτ Ebc,t−τ + βXit + γi + ηt + ict (4)
τ
Spending and number of trips by retail channel. Table 6 shows the effect of dollar
store entry (within 2 miles of the household) on spending and the number of yearly trips
by retail channel.19 The results indicate that dollar stores divert spending away primarily
from the grocery and convenience retail channels, but not from supercenters or club stores.
Entry is associated with an increased number of trips to the dollar channel, from 4.8 to 5.5
19
Retail channels, as defined by Circana, correspond to broad retail categories. The “Grocery” channel
includes both supermarkets and grocery stores but excludes supercenters and club stores. Other smaller
retail categories (in terms of spending share), not shown in Table 6, include farmers’ markets, military
commissaries, and bulk food stores which also see sales diversion to dollar stores.
19Table 6: Effect of DS Entry (0-2mi) on Spending and Number of Trips by Retail Channel
Spending by Channel Trips by Channel
(1) (2) (3) (4) (5) (6) (7) (8) (9)
Aggregate Grocery Dollar SC/Club Conv Grocery Dollar SC/Club Conv
First DS Entry -30.82∗∗∗ -20.85∗∗∗ 5.063∗∗∗ -5.612 -0.991∗ -0.913∗∗∗ 0.670∗∗∗ -0.141 -0.162∗∗∗
(6.590) (5.048) (0.493) (3.845) (0.413) (0.169) (0.0509) (0.102) (0.0478)
Two DS Entries -6.746 -8.324 5.949∗∗∗ -1.104 0.108 -0.888∗∗ 1.060∗∗∗ 0.416∗ -0.158
(12.28) (9.946) (0.952) (7.219) (0.702) (0.339) (0.100) (0.201) (0.0989)
Three+ DS Entries 40.52 30.05 10.48∗∗∗ -7.074 -2.105 -0.450 1.572∗∗∗ 1.269∗∗∗ -0.539∗∗
(21.03) (16.79) (1.644) (11.19) (1.409) (0.625) (0.187) (0.338) (0.184)
Observations 570,689 570,689 570,689 570,689 570,689 570,689 570,689 570,689 570,689
F-stat 838.8 426.7 4.14 928.2 2.24 48.0 6.84 674.5 2.79
R2 0.83 0.84 0.77 0.84 0.68 0.84 0.81 0.84 0.75
Adjusted R2 0.79 0.80 0.71 0.80 0.61 0.81 0.76 0.80 0.70
Mean Pre-Entry 2917.3 1768.3 32.3 777.2 14.6 57.8 4.85 22.4 2.16
Notes: Unit of observation is the household-year. Standard errors (in parenthesis) clustered at the household level. Year and
household fixed effects are included. Controls for time-varying household demographics (income, education, age, household size,
marital status, occupation, weekly hours worked) are included. Results are shown for all panelists in the sample. The first column
shows aggregate spending. SC/Club stands for the Supercenter and Club store channel. Conv stands for the convenience store
channel.
trips following one entry and 5.8 following two entries. The impact of entry on the number
of grocery and convenience trips is negative and significant.
Spending on fresh produce and dollar store entry.
Next, we turn to the effect on fresh produce spending, a key outcome of interest for policy-
makers. Table 7 shows the effect of dollar store entry within 2mi and from 2 to 5mi of the
household on fresh produce spending. Overall, we find a negative and significant effect of
entry within 2mi of the household on produce spending across samples. The magnitude of
the effect increases with the number of dollar store entries but is overall modest in size.
We investigate the heterogeneity in this effect by household characteristics. Figure 4
shows the coefficients on dollar store entry for the balanced panel (column (2) of Table 7)
interacted with household income (in 12 bins, top panel) and vehicle access (bottom panel).
The results indicate that the negative effect of dollar store entry on fresh produce spending
is mainly driven by lower-income households (income up to $45, 000 or bins 1 to 7). For
this group, a single dollar store entry reduces spending by 2.3% to 13.8%, two entries reduce
spending by 5.1% to 25.8%, and three or more entries reduce spending by 7.24% to 30.44%
depending on the household income bin. Moreover, households without vehicle access (a
proxy for travel costs) experience a significantly larger decline in their fresh produce spending
following one and two entries, although this group is small.
To put these effects into a broader perspective, we compute the difference in fresh produce
spending between low and high-income households, controlling for household size, age, and
year indicators. We compare households with annual income below $45, 000 to households
20You can also read