Pandemic leaves its initial marks on the office market - Credit ...
←
→
Page content transcription
If your browser does not render page correctly, please read the page content below
Investment Solutions & Products
         Swiss Economics

         Pandemic leaves its initial
         marks on the office market
         Swiss office property market 2022 | December 2021

Market developments                   2060 scenario                   Regional markets
Office market holds up well           Home working slows space        Large and mid-size centers
                                      requirements only temporarily
Page 9                                Page 10                         Page 13
Imprint

          Publisher: Credit Suisse AG, Investment Solutions & Products

          Nannette Hechler-Fayd'herbe
          Head of Global Economics & Research
          +41 44 333 17 06
          nannette.hechler-fayd'herbe@credit-suisse.com

          Fredy Hasenmaile
          Head Real Estate Economics
          +41 44 333 89 17
          fredy.hasenmaile@credit-suisse.com

          Authors

          Fredy Hasenmaile | +41 44 333 89 17 | fredy.hasenmaile@credit-suisse.com
          Dr. Kerstin Hansen | +41 44 334 16 55 | kerstin.hansen@credit-suisse.com

          Contribution

          Fabian Diergardt
          Alexander Lohse
          Thomas Rieder
          Dr. Fabian Waltert

          Copy deadline

          03 December 2021

          Publication series

          Swiss Issues Immobilien

          Visit our website at

          www.credit-suisse.com/realestatestudy

          Cover photo

          Building: Spoom Luzern-Kriens, «Matteo», Kriens

          Owner: CSA Real Estate Switzerland, eine Anlagegruppe der Credit Suisse An-
          lagestiftung

          Source: Credit Suisse AG

©
          Copyright

          The publication may be quoted providing that it is cited as the source.
          Copyright © 2021 Credit Suisse Group AG and/or its affiliated companies.
          All rights reserved.

                                                   Swiss office property market 2022 | December 2021   2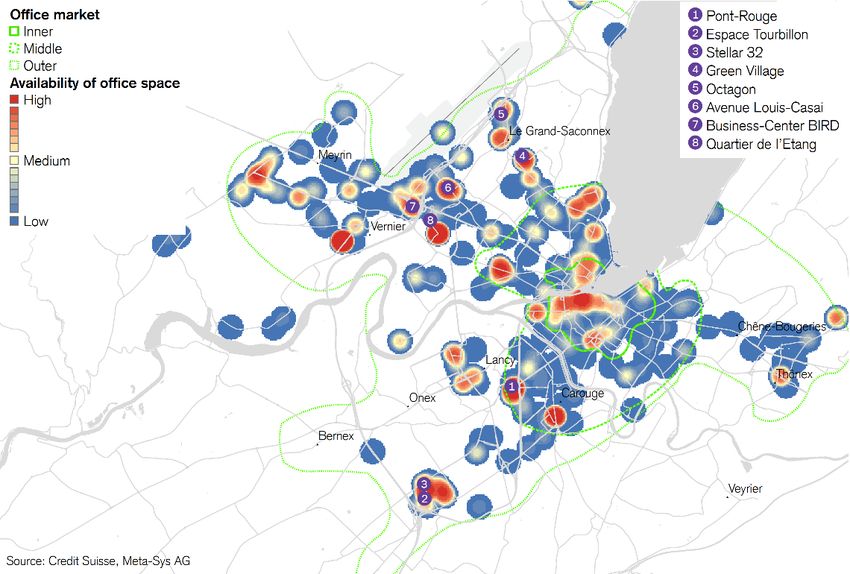
Contents

Management summary – Swiss office property market                                     4
Pandemic leaves its initial marks                                                      4

Demand in the Swiss office property market                                            5
Hesitant demand                                                                        5

Supply in the Swiss office property market                                            7
Supply of space back on the rise                                                       7
Restrained building activity                                                           8

Market developments in the Swiss office property market                               9
Office market holds up well                                                            9

Demand for office space – 2060 scenario                                             10
Home working slows space requirements only temporarily                               10

Regional office property markets                                                    13
Large and mid-sized centers                                                          13
Zurich                                                                               14
Geneva                                                                               16
Bern                                                                                 18
Basel                                                                                20
Lausanne                                                                             22

                                                         Swiss office property market 2022 | December 2021   3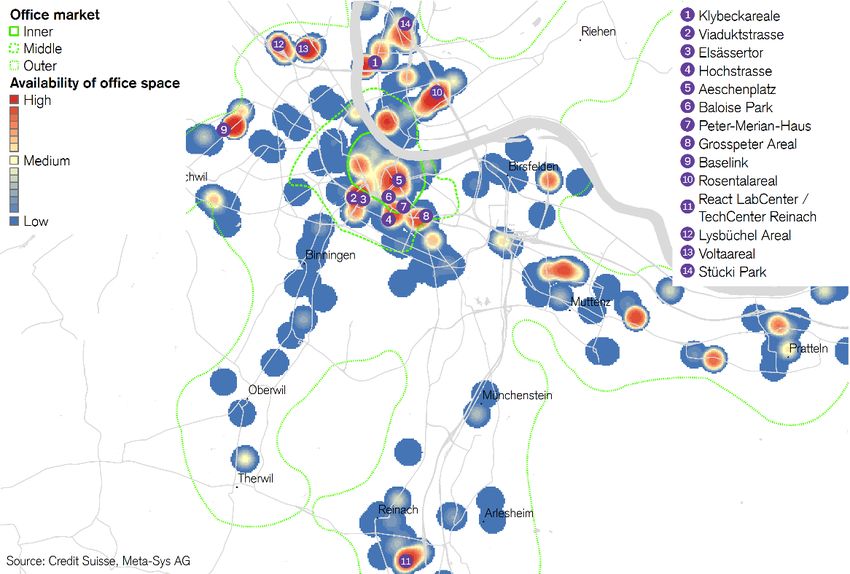
Management summary – Swiss office property market

Pandemic leaves its initial marks
                         Switzerland’s office property market cannot avoid the repercussions of the pandemic.
                         Although the rise in the supply of space has been less pronounced than feared as de-
                         mand has held up better than expected, the home working trend should still leave its
                         mark on the office property market over the next few quarters. By contrast, the trans-
                         formation of the working world promises a rosy future for modern office properties.

Sluggish demand for      In the wake of the dynamic economic recovery, the number of employed persons is also once
office space             again rising powerfully. But despite positive employment trends – particularly in the office-based
                         sectors – demand for office space is proving sluggish. As a result of the uncertainty over future
                         office needs, many tenants are taking their time to rent new premises.

Supply of space          Viewed in isolation, we continue to expect a future of increasingly hybrid working models and
rising again – but not   more home working (compared to before the pandemic) to result in a decline in office space of
as strongly as           around 15%. The initial impact of this development on the market can already be seen, as the
anticipated              supply of space is currently rising, prompting an increase in the supply rate over the last year from
                         5.5% to 5.8%. That said, demand for office space has not been that weak, particularly when
                         compared to many foreign markets, with the market recording a number of rental contract exten-
                         sions and even a few new tenancy agreements. So far, there has been virtually no sign of any
                         structural changes. Ultimately, the current uncertainty also means that only a handful of tenants
                         are actively relinquishing premises or deciding not to extend their contracts.

Investors planning       Office property market investors have also been showing greater restraint. According to building
less office space        permit data, future Swiss office property construction activity should remain some 17% below the
                         long-term average. This is specifically true of the large centers. While on the one hand this cau-
                         tious stance of investors is reflected in a certain hesitancy in demand, on the other it should help
                         prevent any excessive imbalances building up over the next few quarters.

Supply side              The advertised supply of space is increasing not just in Switzerland’s five large office property
determining individual   markets, but also in the mid-sized and small centers, as well as in the rest of the country. In abso-
market situation         lute terms, the increase in supply in the large centers is strongest in the wider conurbation sur-
                         rounding the city center (outer business district). In percentage terms, by contrast, supply has
                         risen most strongly in the inner city. Sub-markets that have seen a particularly high volume of con-
                         struction approvals in recent years have also been more heavily affected. Increased construction
                         activity in Basel, for example, has contributed significantly to the sharp rise in the supply of space.
                         Lausanne has absorbed a high level of construction activity relatively well so far, whereas the sup-
                         ply rate in Geneva, which currently stands at 12%, is unlikely to come down that quickly. The
                         strongest-performing office property market is currently Zurich, where planning activity has been
                         below the long-term average for years.

Vacancies rising         Overall, the office property market is holding up well, even if vacancies and pressure on rental
again, rents coming      prices are once again on the rise. Across the country as a whole, vacancies have risen by 13%,
under pressure           more or less wiping out the slight declines seen over the last two years. However, the slight de-
                         cline in rental prices by 0.1% does not tell the whole story. Particularly at locations outside of the
                         inner city, landlords have increasingly been forced to offer incentives in order to be able to attract
                         tenants in the first place.

Outlook subdued in       Despite strengthening employment growth, the absorption of space is likely to continue to be diffi-
medium term, rosy in     cult and below normal levels, particularly for large premises or those sited on the urban periphery.
long term                A further increase in the supply of space is therefore possible, particularly as there have only been
                         a few cases so far of companies giving up larger premises or downsizing due to the pandemic,
                         even though such plans are being hatched. On the other hand, there is also likely to be a certain
                         amount of pent-up demand. Over a horizon of several years, we are expecting a stagnation in the
                         requirement for office space. Looking further ahead, by contrast, the transformation in the work-
                         ing world is likely to result in a greater need for office space (digitalization effect), thereby giving
                         landlords the prospect of strongly rising long-term demand.

                                                                      Swiss office property market 2022 | December 2021        4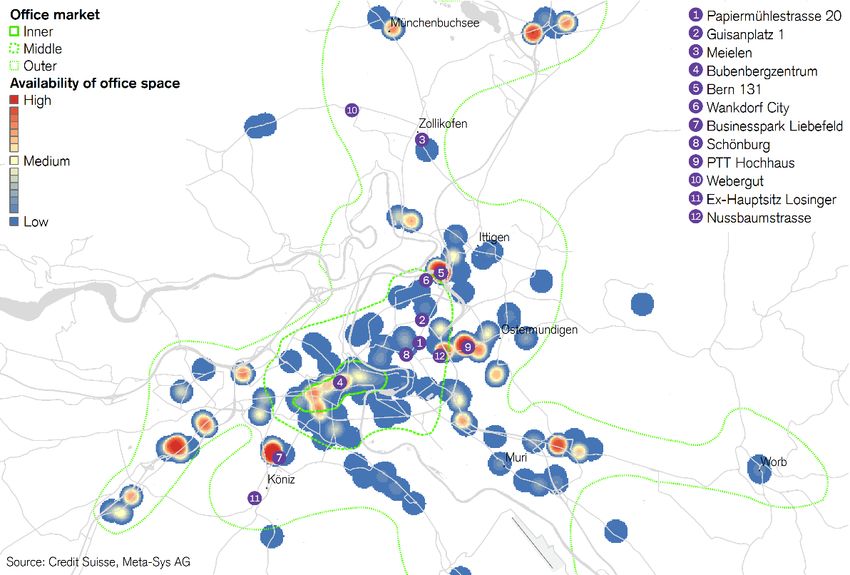
Demand in the Swiss office property market
Hesitant demand
The Swiss economy continues to recover well from the unprecedented pandemic-re-
lated slump of the previous year, even if the recovery is losing some momentum. Due to
persistent uncertainties, the upward trend in demand for office property – which broadly
speaking has held up well – is lagging economic development generally.
Recovery of the econ- The recovery of the Swiss economy from the coronavirus-related slump continues apace. While
omy in the summer of the second wave of COVID-19 and the associated restrictions acted as a major drag on the recov-
2021… ery at the start of the year, Swiss economic output has now climbed back to pre-crisis levels. Ac-
cordingly, by the second quarter of 2021 only the US and Sweden had recovered more strongly
from their pandemic-related economic slumps. We are expecting Swiss gross domestic product
(GDP) to rise by 4.0% this year.
… has slightly but not A further decline in unemployment and short-time working should act as a prop for consumer
seriously slowed… spending next year too. Accordingly, the Purchasing Managers Index (PMI) for manufacturing,
which is a reliable leading indicator, currently stands at 65 points, well above the growth threshold
of 50 points. However, a slight weakening of optimism as a result of supply bottlenecks and fears
over inflation is now evident in the PMI (Fig. 1). Given the combination of rising coronavirus case
numbers and a comparatively low vaccination rate, it may be some time yet before the pandemic is
fully under control. In particular, this means ongoing restrictions and only a slow recovery for cater-
ing, certain areas of the leisure industry, and international tourism. Our forecast for the Swiss
economy and 2022 remains positive, with GDP growth of 2.5%, even though the pace of growth
can be expected to slow compared to this year.
… but continues Generally speaking, the crisis has left less of a mark on the labor market in Switzerland than else-
unabated in the labor where, this being attributable to fiscal measures generally and compensation for short-time work-
market ing in particular. Despite the pronounced economic slump, the Swiss unemployment rate peaked
at just 3.7% in January 2021. Between then and the end of the third quarter it fell steadily to
2.5%, despite short-time working likewise being scaled back considerably. Overall employment,
which declined by 0.3% last year, then went on to record a year-on-year rise of 1.1% by the end
of the third quarter of 2021 (Fig. 2).
Office-based But the employment growth rate of 1.1% (+45,000 jobs) over the last 12 months has not been
industries less evenly distributed across sectors (Fig. 2). In particular, sectors with a traditionally high proportion
affected by the of office workers have come through the pandemic relatively unscathed because they were able to
pandemic switch to home working. The strongest growth in employment numbers can be seen in social ser-
vices (+4.3%), architects/engineers (+2.7%), and IT (+3.0%).
Fig. 1: GDP growth and PMI leading indicator Fig. 2: Employment growth by sector
Annual GDP growth rates and trend growth of purchasing managers index (PMI) Annual growth (per end Q2) of selected service providers on a full-time basis
10% 75 6%
Annual growth 2020 − 2021
8% 70 Average growth 2016 − 2021
4%
6% 65
2%
4% 60
2% 55 0%
0% 50
-2%
-2% 45
Retailing
Social services
IT
Public administration
Teaching
Healthcare
Secondary sector (total)
Banking
Automotive
Wholesaling
Architects/engineers
Tertiary sector (total)
Hotels & catering
Telecommunication
Corporate services
Total
Transport/logistics
Insurers
-4% 40
-6% 35
Real-term GDP growth rate
-8% 30
PMI trend (rhs)
-10% 25
2001 2003 2005 2007 2009 2011 2013 2015 2017 2019 2021
Source: State Secretariat for Economic Affairs, procure.ch, Credit Suisse Source: Federal Statistical Office, Credit Suisse Last data point: Q3/2021
Last data point: 11/2021
Swiss office property market 2022 | December 2021 5
The office-based sector recorded a 1.8% increase in employment overall thanks to much more
dynamic employment growth than the economy as a whole. Among the worst-hit sectors during
the pandemic, wholesale and retailing recorded the severest declines in employment. At the other
end of the spectrum, corporate services recorded the highest increase in headcount (+17,000).
Decoupling of labor The traditionally close correlation between growth in office employment and demand for office
market trend from space has been partly eliminated by the pandemic. Despite relatively robust development of office
demand for office employment, many of the sources of demand for rental space have been sitting on the sidelines.
space Space absorption is proving difficult not least because mastering the pandemic is taking a long
time, and the home working trend is becoming more entrenched as a result. According to a sur-
vey carried out by Deloitte, the proportion of workers based at home for at least half a day a week
has doubled from 24% in 2018 to almost 50% in the most recent data as a result of the pan-
demic. Mobility data shows that workplaces generally were still around 15% less frequented at the
end of the third quarter of 2021 (Fig. 3). This is likely to be primarily attributable to office workers
opting for a mix of office presence and home working.
Home office trend will In the longer term, demand for space is likely to suffer from the likelihood of an increasing number
leave a lasting mark of companies allowing their employees to work partly from home, even after COVID-19. We still
consider our forecast made last year – that the stimulus given to home working by the pandemic
should reduce demand for office space by some 15% in the medium term – to be a decent ball-
park figure. By contrast, the process of digitalization, which has likewise received a boost from the
pandemic, is likely to drive a counter-trend, as an increasing number of working activities can now
be executed with a computer and screen (cf. our special focus on page 10). Viewed in totality,
therefore, demand for office space is likely to trend sideways over the coming years.
Demand less hesitant But even if there is great uncertainty among many office tenants over the future need for office
than supposed space, rental contract extensions and new agreements – particularly for workforce concentration
purposes – are nonetheless being signed in the market. Despite numerous half-empty office
buildings, demand for office property is therefore not as weak as many people believe. So far,
there has been virtually no sign of structural change in the market. Ultimately, the current uncer-
tainty also means that only a handful of tenants are actively relinquishing premises or deciding not
to extend their contracts. What is apparent, however, is a widespread tenant preference for high
quality premises, which is why office property demand is much more vibrant in the inner city than
on the urban periphery.
Demand trend Furthermore, as the world continues its slow journey back to normalization, the key role played by
pointing upward, but a central office for communication and interaction within the company is becoming increasingly ap-
still weak parent. This is particularly true of innovation. In time, the disadvantages of home working are likely
to become more evident, with the attendant likelihood that the office will again be a more valued
environment. Overall, we are expecting additional demand this year to reduce by around
260,000 m², whereas next year it should recover to a growth of around 360,000 m² (Fig. 4).
Fig. 3: Swiss mobility data Fig. 4: Surplus demand for office space
Moving seven-day average; 0 = reference value prior to pandemic Estimated additional demand compared to prior-year quarter in 1,000 m²;
forecasts for Q4 2021 and for 2022
Retail and leisure Shops for everyday needs Manufacturing Construction Trading
Stations & bus/tram stops Workplaces
Residential areas Transportation Hotels & catering IT/communication
40
Financial services Corporate services Health/public services
20 2’000 Other Total
Forecast
1’500
0
1’000
-20
500
-40
0
-60
-500
-80
-1’000
2005
2006
2007
2008
2009
2010
2011
2012
2013
2014
2015
2016
2017
2018
2019
2020
2021
2022
-100
02/20 04/20 06/20 08/20 10/20 12/20 02/21 04/21 06/21 08/21 10/21
Source: Google Last data point: 31.10.2021 Source: Credit Suisse, Federal Statistical Office Last data point: Q3/2021
Swiss office property market 2022 | December 2021 6Supply in the Swiss office property market
Supply of space back on the rise
The volume of Swiss office space being advertised is currently on the rise once again,
although more modestly than in other countries. Hesitant demand is prompting an in-
crease in supply in all sub-markets, without exception. We are therefore expecting the
marketing of office premises to remain difficult over the next few quarters.
Supply of office The robust demand for office space evident prior to the pandemic did not reverse the long-term
space on the rise trend of rising supply in Switzerland, but it did at least halt it temporarily. The demand weakness
again – but more triggered by the pandemic ended this brief phase of consolidation, and the volume of office space
modestly than in being advertised is now rising once again (Fig. 6). Over the last year, the supply rate has risen
other countries from 5.5% to 5.8%. This increase in available space in Switzerland is quite modest when com-
pared to certain foreign markets such as those of the US or UK. Premises therefore continue to
be absorbed by the market, primarily for reasons of location optimization, but also to consolidate a
company workforce at a single location.
Broad-based increase All sub-markets are contributing to this increase in space. The advertised supply of space is in-
in supply creasing not just in Switzerland’s five large office property markets, but also in the mid-sized and
small centers, as well as in the rest of the country (Fig. 5). In absolute terms, the increase in sup-
ply in the office markets of the large centers is strongest in the wider conurbation surrounding the
city center (outer business district). In percentage terms, by contrast, supply has risen most
strongly in the inner city. Sub-markets in which high volumes of new space are coming onto the
market are particularly affected by this increase. For example, the anticipated expansion of space
in Basel is a key driver of the rise in the supply of space in the inner city.
Space increasingly Given the current restraint of tenants, who are often postponing the decision to rent additional
being advertised premises, landlords are becoming reluctant to advertise vacant or soon-to-be vacant space on the
outside of real estate big real estate search engines. The proportion of space only being advertised through brokers or
search engines individual property websites has roughly doubled over the last year. This may be interpreted as a
response to the weak absorption of office space.
Outlook mixed Despite strengthening employment growth, the absorption of space is likely to continue to be diffi-
cult and below normal levels. A further increase in the supply of space is therefore possible, par-
ticularly as there have only been a few cases so far of companies giving up larger premises or
downsizing due to the pandemic. Such plans do exist, however. On the other hand, there is also
likely to be a certain amount of pent-up demand. We are expecting the supply of space to rise in
particular for large premises as well as premises based on the urban periphery.
Fig. 5: Supply of office space in Switzerland Fig. 6: Supply of office space in the large centers
Total of quarterly (online) advertised space (existing stock and newbuilds), in m² Total of quarterly (online) advertised space (existing stock and newbuilds), in m²
1’400’000 Major centers outer business district 2’500’000 Major centers central business district (CBD)
Major centers middle business district Major centers middle business district
1’200’000 Major centers central business district (CBD) Major centers outer business district
Outside major centers 2’000’000 Total supply
1’000’000
1’500’000
800’000
600’000
1’000’000
400’000
500’000
200’000
0 0
2006 2008 2010 2012 2014 2016 2018 2020 2006 2008 2010 2012 2014 2016 2018 2020
Source: Credit Suisse, Meta-Sys AG Last data point: Q2/2021 Source: Credit Suisse, Meta-Sys AG Last data point: Q2/2021
Swiss office property market 2022 | December 2021 7Supply in the Swiss office property market
Restrained building activity
According to building permit data, future Swiss construction activity in respect of office
property should remain well below the long-term average. This is particularly true of the
large centers, despite differences from city to city.
Construction activity The pandemic has greatly accelerated the transition to new ways of working and modern working
shaping current practices. The uncertainty that this has induced for companies’ future office space needs has
market situation weakened demand. In this situation, it is the supply side that automatically becomes the point of
focus, and with new premises increasingly adding to the available market supply, this could rapidly
lead to imbalances in regional markets.
Investors showing Over the last 12 months, the investment volume of building permit issuance for office space
restraint amounted to some CHF 1,598 mn (Fig. 7). This is well below the most recent peak recorded last
November, and as much as 17% below the long-term average since 1995. As a consequence,
investors have become rather more circumspect about investing in office construction projects,
and have been delaying the launch of new projects until uncertainties over their future need for
space subside. By contrast, planning application volumes have increased, with special effects be-
ing the primary cause here. For example, an increasing number of data centers or other special
properties that will include office space are currently being planned. A planning application for a
new police station for Canton Bern in Niederwangen has recently been submitted, for example. In
a long-term comparison, the figure of CHF 363 million for building permit issuance in connection
with office renovations over the last 12 months is very low. Replacement newbuilds are typically
preferred over renovations at the moment.
Low construction The relatively intact market situation in the Zurich office property market has a strong correlation
activity in majority with the well below-average level of construction activity. In Figure 8 we have selected average
of major centers approved investment volumes over the last five years as a measure of the expansion of office
space supply, as many projects are only started when the expiry of the building permit looms after
a few years. By contrast, the significant expansion of office space in Basel makes it clear why the
advertised supply of space in this city on the Rhine has been rising continuously to the point where
the supply rate now stands at 8.8%. A comparison of Geneva and Lausanne yields interesting re-
sults: whereas in the former it has mainly been weakening demand that has seen the supply of
space rise to 12.3%, the latter has benefited from relatively robust demand despite higher con-
struction activity, with the result that the supply of space has expanded much less sharply here.
Overall, the pipeline in the majority of large and mid-sized centers is only three-quarters full. This
restraint on the part of investors is likely to be one reason why no dramatic imbalances are likely to
build up in most office markets over the next few quarters.
Fig. 7: Planned expansion of office space Fig. 8: Expansion and supply in the large and mid-sized centers
Building permits and planning applications, moving 12-month total, in CHF mn. Circle size: existing office space; expansion (y-axis): building permits over last five
years compared to long-term average; supply rate as % of existing space in 2018
4,500 New construction permits New construction applications Expected expansion
Conversion permits Conversion applications 100%
4,000
New construction permits, average Conversion permits, average
3,500 75%
Neuchâtel
50% Basel
3,000 Schaffhausen
Lugano
2,500 25% Chur Lausanne
Thun Olten
2,000 0% Geneva
Solothurn
Winterthur Bern Zug
1,500 -25%
Sion Biel
1,000 -50%
Fribourg Aarau
500 -75% Baden
St. Gallen
Lucerne Supply rate
0 -100%
2005 2007 2009 2011 2013 2015 2017 2019 2021 0% 1% 2% 3% 4% 5% 6% 7% 8% 9% 10% 11% 12% 13%
Source: Baublatt, Credit Suisse Last data point: 09/2021 Source: Credit Suisse, Meta-Sys AG, Baublatt Last data point: 09/2021
Swiss office property market 2022 | December 2021 8Market developments in the Swiss office property market
Office market holds up well
The pandemic-related weakness of demand has been feeding through into rising supply
rates and vacancies. Moreover, rental prices are coming under pressure. Compared to
foreign markets, however, the Swiss office market is holding up better than expected.
Repercussions of Whereas both the volume of advertised office space and official vacancy figures surged in the
pandemic have been wake of the coronavirus pandemic in London and New York, the situation in Switzerland has so
manageable so far far remained manageable. The supply of space has admittedly risen in Switzerland too, as have
overall vacancies, but the dislocations have so far been much less pronounced than originally
feared. Overall, the officially measured vacancy rate for Switzerland – which covers around 44%
of the market – has risen by a modest 13%. This development has had the effect of almost com-
pletely reversing the decline in vacancies recorded in the two prior years (Fig. 9).
Vacancy rates on the Although vacancies have risen by 18% in the city of Zurich, they are still at their third-lowest level
rise once again of the last 20 years. Within the city limits of Bern, where the office space conversion trend is al-
ready widespread, vacancies actually declined by a third. A similar picture can be found in Canton
Geneva, where the current vacancy level remains close to the all-time high recorded two years
ago. By contrast, vacancies have risen sharply in the urban centers where construction activity has
been most vibrant. Vacancies have more than doubled in both the city of Basel and the Lausanne
region, whereas the increase in Canton Basel-Country has amounted to less than a third.
Rental prices still Rental prices have been giving out conflicting signals: as per mid-2021 these had declined slightly
trending sideways year-on-year by 0.1%, but had on average risen by 1.3% every year over the preceding decade.
Declines were recorded by both the Bern region (–1.2%) and the city of Zurich (–0.6%). How-
ever, initial contractual rents probably paint an incomplete picture. Specifically, it must be assumed
that incentives are increasingly being granted – particularly at locations outside of the inner city –
in order to be able to attract tenants in the first place.
Subdued outlook On the one hand, powerful employment growth and eventually declining COVID-19 infection rates
can be expected to invigorate the demand for office space over the next few quarters. On the
other hand, we are expecting to see a certain amount of space rationalization when rental con-
tracts expire, particularly in the case of large companies. Going forward, it therefore looks only
reasonable to expect a lower need for space per employee. In other words, the marketing of office
property can be expected to remain difficult. Despite the economic recovery, we expect supply
and vacancies to remain stubbornly high, along with a further slight decline in rental prices.
Fig. 9: Office vacancies Fig. 10: Regional office rents
Vacant office space as per June 1, in thousand m² Hedonic rental price index on the basis of signed contracts, index: 2005 = 100
City of Zurich Canton of Geneva* 160 City of Zurich
Canton of Basel-Stadt Canton of Basel-Landschaft City of Geneva
City of Bern Canton of Neuchâtel City of Lausanne
700 150
Basel region
600 Bern region
140 Rest of Switzerland
500
130
400
120
300
110
200
100 100
0 90
1996 1998 2000 2002 2004 2006 2008 2010 2012 2014 2016 2018 2020 2005 2007 2009 2011 2013 2015 2017 2019 2021
* Figure for Canton Geneva from 2020 interpolated due to lack of data. Source: Wüest Partner, Credit Suisse Last data point: Q2/2021
Source: Various govt. statistical sources, Credit Suisse
Last data point: 06/2021
Swiss office property market 2022 | December 2021 9Demand for office space – 2060 scenario
Home working slows space
requirements only temporarily
Employment growth between now and 2060 is unlikely to be sufficient in itself to com-
pensate for the decline in demand for office space as a result of home working. How-
ever, the parallel trend of strong digitalization will transform many types of work into of-
fice-based activity, which should in turn generate significant additional long-term de-
mand for office space.
Contrary trends with Over the last few years, a combination of employment growth and the increasing tertiarization and
unclear digitalization of the labor market has created a significant additional number of office jobs in Swit-
repercussions for zerland, thereby fueling demand for office space. At the same time, the proportion of office-based
office property employees able to work at least partly from home was growing by around one percentage point a
demand year even before the pandemic. COVID-19 has accelerated – or at least confirmed – both these
trends. Due to strict social distancing requirements during the pandemic, even companies that had
adopted a conservative approach to this issue were suddenly forced to allow home working. In ad-
dition, it has emerged that sectors with a high degree of digitalization coped with the crisis better,
as the transition to home working was much easier for their employees. According to surveys this
transformation is set to last, as many companies are keen to offer their workforce hybrid working
models in the future too. All in all, therefore, we are looking at two contrary trends shaping the key
parameters of demand for office space. This begs the question of how the future development of
employment – taking into account the three trends of tertiarization, digitalization, and home work-
ing – will feed through into demand for space.
Basis: forecasts for In order to forecast the development of office employment and the resulting demand for office
employment up to space over the very long term, we have used the Swiss Economic Scenarios for 2060 as drawn
2060 up by Ecoplan and KPMG on behalf of the Swiss Office for Spatial Development and the State
Secretariat for Economic Affairs (SECO)1. Based on these calculations, employment in Switzer-
land is expected to increase 10% in total by 2060, and there will also be a significant shift in em-
ployment proportions for certain sectors of the economy (Fig. 11). The sector set to enjoy the
greatest employment growth is mining at 58%, although given the minimal size of the sector this
will barely affect overall employment (+0.06 percentage points). By contrast, the growth in em-
ployment in the healthcare and social services sector (almost 50%) should contribute some
6.35 percentage points to overall growth. The greatest declines in employment can be expected in
manufacturing (–2.27 percentage points), much of which will be attributable to automation.
Fig. 11: Employment growth up to 2060 by sector Fig. 12: Sectoral contributions to the 6% increase in office space
In %, 2019 to 2060 In percentage points, 2019 to 2060
Mining Health & social services
Health & social services Automotive trading
Education/teaching Education/teaching
Other services Finance & insurance
Automotive trading Public administration
Public administration Construction
Construction Other services
Finance & insurance Real estate & housing
Private households Art & entertainment
Total Mining
Real estate & housing Private households
Art & entertainment
Water utilities Water utilities
Energy utilities Energy utilities
Agriculture & forestry Agriculture & forestry
Transport & storage Hotels & catering
Manufacturing Transport & storage
Other commercial services Other commercial services
Freelance / scientific / tech. IT & communication
Hotels & catering Manufacturing
IT & communication Freelance / scientific / tech.
-40% -20% 0% 20% 40% 60% -4% -3% -2% -1% 0% 1% 2% 3% 4%
Source: Ecoplan, KPMG, Credit Suisse Source: Ecoplan, KPMG, Swiss Federal Statistical Office, Credit Suisse
1
This is based on a scenario that assumes a shift toward high-tech industries as well as growing environmental awareness,
but without making any explicit assumptions in respect of spatial effects. The latter arise endogenously from our modeling
process. Due to the exceptional situation caused by COVID-19, 2019 was taken as the base year.
Swiss office property market 2022 | December 2021 10Forecast for office The sector-specific repercussions of the employment forecasts for the office property market de-
space demand pend heavily on the size of each industry and its proportion of office workers. Assuming that all
disregarding trends other parameters remain the same, the employment growth figure of 10% translates into an in-
crease in office space of around 6%. At just under 4 percentage points in each case, the growth
in both automotive sales and healthcare & social services makes a significant contribution to over-
all growth in Swiss office space, compensating for the space likely to be freed up in manufacturing
(–2%), the IT and communications industry (–2%), as well as freelance, scientific, and technical
services (–3%) (Fig. 12).
Office employment The employment forecasts were drawn up not just for the individual sectors of the economy, but
set to decline most also for the individual MS regions. This makes it possible to estimate how demand for office space
strongly in the south might develop in the individual regions (Fig. 13). Declines can be expected in Graubünden, Ticino,
and the Jura in particular, and could be most pronounced of all in the regions of Schanfigg (–
31%), Mendrisio (–29%), Prättigau (–24%), and Lugano (–23%). In Lugano, for example, the
decline in demand for space is related to lower employment in the consultancy and IT industries.
By contrast, demand for office space is set to increase in Cantons Geneva, Vaud, and Zurich, as
well as in their neighboring cantons. The greatest employment-related rise in demand for office
space is expected in the Fricktal region (+23%), where the local pharmaceutical industry is ex-
pected to grow strongly.
Approximation of In order to incorporate the effects of the strong base trends of digitalization and home working into
home working and our forecasts, we have modelled the growing proportion of office jobs per sector in the wake of
digitalization effects digitalization. In addition, as already mentioned in the “Demand” section, we are sticking with our
assumption that home working will cause a 15% decline in demand for office space by 2030. The
reduction in space that this entails for each sector is determined by two factors: the weighting of
each industry as a source of demand for office space, and the feasibility of home working in this
industry2.
Home working – Without taking into account other effects, the 15% decline in demand for space attributable to
when viewed in home working is equivalent to an overall space reduction of 8.4 mn m2 by 2030. The greatest
isolation – to trigger a percentage declines are likely to be found in the finance/insurance area (–26%) and IT/communi-
10% decline in space cations (–24%), whereas the home working effect is least noticeable in the primary sector. When
by 2060 viewed regionally, it is the cities with a generally high density of office jobs that are most affected
by this development, due to differing regional economic structures. For example, the cities of Zur-
ich, Bern, Lugano, and Basel contribute around one percentage point each to the total decline in
space of 10% by 2060.
Fig. 13: Regional office space growth due to development of em- Fig. 14: Regional office space growth due to development of em-
ployment ployment and the home working trend
Change in %, MS regions, 2019 to 2060 Change in %, MS regions, 2019 to 2060
> 20% > 20%
10 – 20% 10 – 20%
5 – 10% 5 – 10%
-5 – 5% -5 – 5%
-10 – -5% -10 – -5%
-20 – -10% -20 – -10%
< -20% < -20%
Source: Ecoplan, KPMG, Swiss Federal Statistical Office, Credit Suisse Source: Ecoplan, KPMG, Swiss Federal Statistical Office, Credit Suisse, Rut-
zer & Niggli, 2020
Digitalization leads to While home working will reduce demand for space, the increasing digitalization of all forms of life
more office jobs and work will increase the proportion of office workers in all sectors, thereby generating significant
long-term demand for additional space. For example, this has become apparent in recent years in
manufacturing, where more basic activities have been taken over by machines at the same time as
2
Based on data produced by Christian Rutzer and Matthias Niggli (2020): “Corona-Lockdown und Homeoffice in der
Schweiz” [“Coronavirus lockdown and home working in Switzerland”], Center for International Economics and Business
(CIEB), University of Basel.
Swiss office property market 2022 | December 2021 11new office jobs have been created, e.g. for the programming, management, and monitoring of the
machines.
Assumption: The future development of sector-specific proportions of office workers will depend heavily on
proportion of office- technological progress, and can hardly be forecasted precisely over a time horizon of 40 years. In
based workforce to order to highlight the impact of possible repercussions, specific assumptions have nonetheless
rise by between 5 and been made about the potential for – and the tempo of – further digitalization in the individual sec-
23 percentage points, tors, which are then modeled using rising proportions of office jobs for each sector. For example,
depending on sector office workers already accounted for some 90% of the workforce in financial/insurance services
back in 2019, hence there is only limited potential for this to increase. By contrast, given the in-
creasing implementation of digital health concepts in the healthcare sector and rapid progress in
connection with autonomous vehicles in the transportation area, we are predicting a more signifi-
cant increase of up to 23 percentage points in the proportion of office-based workforce in these
sectors by 2060.
Growing proportion of Between 2000 and 2019, the average proportion of office-based employees in Switzerland rose
office-based from 34% to 45%. According to our model, this should increase further to 60% by 2060. In this
workforce could scenario, the number of office workers would increase by 42% in total. Viewed on its own (i.e.
hugely increase disregarding the impact of home working), this would mean a rise in demand for office space of
demand for space 42%. This gives us three significant drivers of the future need for office space by 2060: total em-
ployment growth (+10%), a partial shift of workers from the office to the home (demand for
space: –15% by 2030), and a growing proportion of office-based workers (office-based ratio:
+15 percentage points). When all three developments are taken together, the resulting additional
requirement for office space in Switzerland amounts to 23%. The sectors with the greatest contri-
bution to this rise in demand are automotive trading, healthcare & social services (+8 percentage
points in each case), as well as education/teaching (+4 percentage points) (Fig. 15.)
Fig. 15: Sectoral contributions to the long-term 23 % growth in of- Fig. 16: Growth in office space by 2060 by scenario
fice space, including home working and digitalization trends
In percentage points, 2019 to 2060 In percentage points, 2019 to 2060
Health & social services 50%
Automotive trading
Education/teaching 40%
Construction
Other services
Public administration 30%
Transport & storage
Hotels & catering 20% 42%
Manufacturing
Agriculture & forestry
Art & entertainment 10% 23%
Real estate & housing
Other commercial services 6%
0%
Mining -10%
Water utilities
Private households -10%
Energy utilities
Finance & insurance -20%
IT & communication Employment growthEmployment growth Employment growth Employment growth
Freelance / scientific / tech.
+ home working + digitalization + home working
-6% -4% -2% 0% 2% 4% 6% 8% 10% + digitalization
Source: Ecoplan, KPMG, Bundesamt für Statistik, Rutzer & Niggli, Credit Source: Ecoplan, KPMG, Bundesamt für Statistik, Rutzer & Niggli, Credit
Suisse Suisse
Conclusion: Effects of When considering the above results, it should be borne in mind that the analysis rests on various
home working will be assumptions, and a time horizon of 40 years inevitably entails many uncertainties. Rather than
more than offset by providing precise predictions, the results are intended to highlight the potential influences of con-
contrary trends trary trends. The assessment reveals that – in addition to the already evident negative repercus-
sions of home working for the office space market – there are other drivers with the potential to
offset or even outstrip the effects of home working in the longer term. Although the home working
trend can be expected to reduce the need for space tangibly over the next few years, as soon as
the new relationship between home working and an office presence has found its natural equilib-
rium in individual companies, the strong digitalization trend will become the key driver and stimu-
late demand for office space (Fig. 16). It is not growth in employment per se that will be the
greatest driver of demand for office space, but the way in which the working world changes as
greater automation and digitalization feed through into an ever-greater proportion of office-based
activities.
Swiss office property market 2022 | December 2021 12Regional office property markets
Large and mid-sized centers
In addition to the table below covering the office markets of the large and mid-sized
centers, the following pages explore the situation in the large centers in greater detail.
Overview of regional Figure 17 provides an overview of Switzerland’s key office property markets. 65% of existing
office property Swiss office space is accounted for by these 21 office space markets. For the most part, supply is
markets concentrated in Switzerland’s five largest conurbations, which in 2021 accounted for some 63%
of all available office space in the Swiss market. Together with the largest mid-sized centers listed
below, these accounted for 80% of available space. At 5.8% of existing space, the supply rate for
Switzerland as a whole has recorded a further slight year-on-year rise. The expansion of space
going forward is likely to be very low in the large centers in particular (–21% below the long-term
average), whereas it is only just below the long-term average in the mid-sized centers (–14%).
Fig. 17: Total and advertised space in the largest office property markets
Advertised vacant space (existing premises and newbuilds) in m², 2021; total space as per end 20183, space-weighted average rents
(net) 2021 in CHF/m²; expansion: building permits of last five years compared with long-term average
Inventory of Space Supply Average
Major centers Expansion
office space available rate rents
Zurich 10’547’050 759’853 7.2% 296
Geneva 4’239’056 523’457 12.3% 393
Bern 3’484’515 210’843 6.1% 214
Basel 3’232’916 283’796 8.8% 244
Lausanne 2’699’624 220’211 8.2% 253
Mid-sized centers
Lucerne 1’568’346 68’083 4.3% 199
Zug 1’395’595 120’870 8.7% 231
St. Gallen 1’328’225 33’839 2.5% 217
Lugano 1’159’161 74’705 6.4% 222
Winterthur 864’358 38’048 4.4% 203
Fribourg 646’354 8’154 1.3% 207
Aarau 612’199 23’513 3.8% 203
Biel 543’148 23’329 4.3% 149
Neuchâtel 500’656 21’822 4.4% 164
Baden 499’603 50’257 10.1% 224
Solothurn 463’045 5’517 1.2% 164
Sion 433’215 6’990 1.6% 170
Chur 399’549 17’434 4.4% 184
Schaffhausen 391’872 16’184 4.1% 147
Olten 384’498 22’688 5.9% 151
Thun 375’670 11’490 3.1% 199
Switzerland 55’006’668 3’162’896 5.8% 257
Source: Credit Suisse, Meta-Sys AG, Baublatt
Note on available office space and supply rate:
We define the supply rate as the total of all office space advertised for rental in a quarter, insofar as office use is clearly
suitable as well as quantifiable, divided by the total office space in the area in question. The point in time at which the
space will be available is irrelevant to us here, as the market is only influenced by the current amount of space being
offered. When compiling the data, we rely on all publicly accessible offers on the internet for any given quarter. These
offers are not just restricted to real estate websites, but also include other publicly available sources (e.g. individual
websites). In terms of geography, the supply rates each refer to the entire office space market of a large or mid-sized
urban center. The map illustrations of the large urban centers on the following pages provide information about any rel-
evant expansions, which we demarcate at hectare grid level.
3
Due to the delayed publication of the employment statistics in 2019, our extrapolations of existing space are based on
2018 figures. The supply rates therefore relate to prior-year data, which means the decimal places of the figures given are
somewhat inflated.
Swiss office property market 2022 | December 2021 13Zurich
Fig. 18: Density of available office space
Office space marketed on the internet (existing stock and newbuilds) in m² per hectare as per Q2 2021
Supply of space rises The supply of office space in the Zurich real estate market has risen by just 3.5%, despite uncer-
only modestly tainty over the coronavirus crisis. In keeping with the strength of the office market economy, which
persisted right up until the onset of the pandemic, a considerable amount of space has clearly
been absorbed. Moreover, given their uncertainty over future space requirements, many tenants
have decided against relinquishing office space too hastily. Within the city limits, the supply of
space is concentrated in city district 1, which is home to a very dense cluster of office buildings
(Fig. 18). In the central business district (CBD), just 3.3% of all office space is currently on the
market – far less than the 7.2% for the office market as a whole when the surrounding urban mu-
nicipalities are taken into account.
Rental successes and Other areas within the city limits where plenty of office space is being advertised include Altstetten
failures occurring and Zurich North. However, there have been various recent letting successes in Altstetten, as well
side by side as along Thurgauerstrasse in Zurich North, where many office buildings have been waiting for ten-
ants for years. In the huge Ambassador House, just under 2,500 m2 of the original 38,000 m2 is
still available; in the former Contraves building at Schaffhauserstrasse 550 the equivalent figure is
just 27 m2. That said, letting successes are anything but a given, with other office premises on the
same streets still waiting for tenants, in some cases for years. Even outstandingly located areas
close to Oerlikon Station, such as the still unfinished Franklinturm and virtually new existing prem-
ises such as in the Next11 office building – which world football’s governing body FIFA is about to
vacate after only a short tenancy – are not finding tenants overnight.
Outer business Overall, advertised office space has only increased outside of the city, in the outer business dis-
district: trict. Here the supply rate has increased from 11.6% the previous year to 12.9% most recently
Supply dominated by (Fig. 19). The dark-red shading in Figure 18 shows the dozen or so hotspots with more than
large premises 10,000 m² of available office space. These include the former SAP building in Regensdorf, which
is looking for a new tenant after the relocation of the German software group to the Circle quarter,
and the innovative JED business park on the site of the former NZZ printworks in Schlieren. The
above-average number of large-scale premises is partly attributable to the highly successful letting
of office premises in the Circle quarter. This has freed up plenty of space at other locations that
will take some time to be re-let.
Swiss office property market 2022 | December 2021 14Middle business In the middle business district, the supply of space has declined 6.3% year-on-year to 5.5% fol-
district: Decline in lowing various letting successes – such as in the popular Binz district and the award-winning
supply of space YOND development in Albisrieden – and only a limited amount of new space coming onto the
market. The growing number of co-working spaces may have also contributed to the fall in the
supply of space. When offices are converted into co-working spaces, a certain amount of square
meterage is lost. However, as these premises are unlikely to be 100% occupied, the supply of
space tends to be underestimated. This is probably also true of the CBD. So far, conversions have
only reduced the supply of space in Zurich to a very limited degree. For example, the Mobimo of-
fice building at the bottom of the Friesenberg quarter has been converted into apartments, and a
whole floor in the Baslerpark has been converted into co-living lofts.
Central business There are very few premises available at the heart of the Zurich office market. Notable exceptions
district: Supply include premises in the high-rise “Hochhaus zur Schanzenbrücke”, which UBS vacated with a view
pretty scarce to concentrating its workforce in a small number of buildings. A number of large companies are
pursuing a similar location strategy, and not just in Zurich, as they look to save costs and exploit
the innovative synergies of having large numbers of employees working in the same building.
While certain sectors are reducing their space footprint, others are stepping into the breach. In the
middle of the CBD, for example, Microsoft is expanding its premises in order to develop its “Mixed
Reality & AI Lab – Zurich”. Other big tech companies are also securing premises at the heart of
the city: According to various sources, Google is about to move into the Schaderhaus on General-
Guisan-Quai, while just a stone’s throw away Amazon is set to join the mainly insurance-domi-
nated roster of tenants at Mythenquai 10. Major premises offering 2,000 m2 or more are therefore
relatively scarce in the CBD, which testifies to the strong appeal of Zurich’s inner city.
Vacancies once again Office vacancy levels within the city limits have now risen again after six years of decline. The main
on the rise after six- contributor here is the Seebach quarter, where vacancies have more than doubled. By contrast,
year downward vacancies have fallen sharply in Seefeld and Altstetten, while in the CBD they are virtually un-
trajectory changed on the previous year. As prospective tenants clearly favor high-quality premises in good
locations, we anticipate only a modest increase in vacancies within the city limits over the next few
quarters. As things stand, the vacancy situation is most acute in the wider urban area of the city,
where no such relevant data is gathered. Our monitoring of advertised space (Fig. 19), which in-
corporates not just advertising portals but also the advertising of real estate brokers and individual
property websites, shows that the supply of space in the outer business district continues to rise
despite the decline in construction activity, and now amounts to some 430,000 m2.
Increase in available Zurich’s office market benefits from the fact that construction investment (as gauged through
space set to slow planning applications) was well below the long-term average between 2015 and 2019, as well as
going forward since the start of this year (Fig. 20). The decline in vacancy levels and the supply of space in
2018 and 2019 triggered a number of new investment projects, which (after a short time lag)
brought approved construction volumes back in line with their long-term average in 2020. How-
ever, pandemic-inspired uncertainty then saw many investment ambitions quickly evaporate;
hence approved construction volumes have recently fallen well below their long-term average once
again. The weak expansion of existing office space is a major reason why both the supply of
space and vacancies have risen only modestly. Given the weak pipeline, this is likely to remain the
case going forward.
Fig. 19: Supply of available office space Fig. 20: Construction approval volumes for office space
Total of quarterly advertised space (existing stock and newbuilds), in m2 12-month total and long-term average for Zurich market, in CHF mn
900'000 Zurich central business district (CBD) 1’000 Zurich office market
Zurich middle business district
800'000 Zurich outer business district 900 City of Zurich
Zurich
700'000 800 Average Zurich office market
700
600'000
600
500'000
500
400'000
400
300'000
300
200'000
200
100'000 100
0 0
2006 2008 2010 2012 2014 2016 2018 2020 2000 2003 2006 2009 2012 2015 2018 2021
Source: Meta-Sys, Credit Suisse Last data point: Q2/2021 Source: Baublatt, Credit Suisse Last data point: 09/2021
Swiss office property market 2022 | December 2021 15Geneva
Fig. 21: Density of available office space
Office space marketed on the internet (existing stock and newbuilds) in m² per hectare as per Q2 2021
Further rise in supply The supply of space in Geneva’s office property market – the problem child of the wider Swiss
of space in Geneva market in recent years – appeared to have peaked in 2019. The volume of advertised space then
office property declined, but uncertainties in the wake of the coronavirus pandemic have resulted in a further rise
market in supply of space (Fig. 22). The supply rate of the overall office market in Geneva rose from
11.5% last year to 12.3% most recently. This is primarily attributable to a sharp increase in supply
in the wider office market, either due to a significant amount of space coming onto the market
(Pont-Rouge), or the expansion of space in connection with the opening of the Leman Express
resulting in vacancies elsewhere. At the heart of the Geneva office property market, a shrinking of
supply testifies to intact demand, mainly for premises with less than 1000 m². One contributory
factor here is the stabilization of the Geneva financial center in recent years. Although the number
of banking personnel continues to decline, the same is not true of the more broad-based financial
intermediary sector. Many office tenants are exploiting the greater breadth of choice to seek out
premises in the city center. In the central business district (CBD), the supply rate has therefore
declined from 7.4% to 7.1%. That said, the various supply hotspots on the map (Fig. 21) make it
clear that oversupply remains a widespread problem in Geneva’s office property market.
Decline in supply of In the central business district (CBD), the supply of available space is primarily concentrated on
space at the heart the left bank of the Rhône. A high supply density can also be discerned in Sécheron, where vari-
of the city ous buildings have vacant premises close to the station. In the middle business district, the new
Pont-Rouge business quarter is developing dynamically. This is the first large-scale building phase
of the city’s significant Praille-Acacias-Vernets (PAV) development project. The new business dis-
trict right next to Lancy-Pont-Rouge station comprises six buildings offering total space of around
110,000 m², of which just under 95,000 m² is office space. More than a half of this space is al-
ready let. Due to these letting successes, the two largest building complexes are already in the
construction phase and being advertised. The Pension Fund of Canton Geneva has stepped in as
an investor in Esplanade 3, where it also intends to concentrate its workforce. The addition of new
space at the Pont-Rouge location is one reason why the supply rate of the middle business district
has risen to 9.5%, whereas last year it was actually lower than the CBD supply rate.
Letting successes in The volume of advertised space has remained constant in Geneva’s outer business district – in
outer business contrast to developments in Switzerland’s other major office markets. Among other things, this is
district attributable to letting successes in the Plan-les-Ouates quarter. Of the five buildings in the Espace
Tourbillon complex, Swiss Prime Site has sold a further building to the Hans Wilsdorf Foundation,
Swiss office property market 2022 | December 2021 16thereby reducing the supply of available space. Another contributor to the reduction in supply is
the letting of more than 11,000 m² in Stellar 32 – which was completed in 2020 – to a Japanese
pharma company. However, there are still various premises requiring tenants, as is clear from Fig-
ure 21. The other vacant space hotspots are almost all clustered in the northern part of the office
market, close to Geneva airport. For example, the Green Village project in Grand-Saconnex, right
at the heart of the international part of Geneva, is taking shape. The first office building currently
under construction (Kyoto) already has tenants in place for its lower floors. The premises of the
next building (Stockholm) are also now being advertised.
Newbuilds put To the north of this area, right by the airport, the Ensemble Octagon previously occupied by US
pressure on existing chemical giant Dupont is positioning itself as a new incubator and innovation campus for start-ups.
stock Further premises in existing buildings are being advertised on the Avenue Louis-Casai, the main
axis between the airport and city center. Further to the west, a significant volume of space still
awaits tenants in the imposing BIRD business center. On the other side of the freeway Geneva’s
largest current building site can be found – the Quartier de l’Etang. This will be home to an entire
district with 870 apartments and numerous offices. No less than 44,000 m² of office space is
currently being advertised in four office buildings. Not least due to these newbuilds, the supply
rate in Geneva’s outer business district is stuck at a high 20.5%.
Vacancy rate now Canton Geneva did not publish vacancy figures last year due to poor data quality, but its Statistical
below all-time peak Office now estimates the volume of vacant office space to be in the region of 191,000 m². This
may be short of the peak of 235,000 m² recorded in 2019, but is nonetheless the third-highest
figure of the last 40 years. On average, vacant offices in Geneva currently stand empty for more
than 20 months before a tenant is found. Not since the 1990s have letting times been so long.
More than a half of all vacant space has been on the market for more than two years. The proper-
ties most difficult to market are those constructed in the 1980s and 1990s. This explains why
many properties are currently undergoing renovation and have therefore been removed from the
available supply for the time being. There is therefore a risk that the supply rate will rise further
once these properties return to the market.
Geneva pipeline fatter That construction activity is relevant to the high supply of available space in Geneva is also evident
than those of other from the volume of approved construction investment for office space. Despite only limited de-
major centers mand dynamism and increasing signs of oversupply, investors appear to have shown almost no re-
straint in recent years. Over the last five years, the volume of approved office construction is only
6% below the long-term average of CHF 84 mn – a level that is too low for a comprehensive re-
covery of Geneva’s office property market. Indeed, until recently the 12-month total of approved
office space had climbed back above the long-term average, only falling back again from
June 2021. We are therefore anticipating a persistent expansion of office space and a rocky road
to recovery.
Fig. 22: Supply of available office space Fig. 23: Construction approval volumes for office space
Total of quarterly advertised space (existing stock and newbuilds), in m2 12-month total and long-term average for Geneva market, in CHF mn
600'000 Geneva central business district (CBD) 225 Geneva office market
550'000 Geneva middle business district City of Geneva
200
Geneva outer business district
500'000 Average Geneva office market
Geneva 175
450'000
400'000 150
350'000
125
300'000
100
250'000
200'000 75
150'000
50
100'000
25
50'000
0 0
2006 2008 2010 2012 2014 2016 2018 2020 2000 2003 2006 2009 2012 2015 2018 2021
Source: Meta-Sys AG, Credit Suisse Last data point: Q2/2021 Source: Baublatt, Credit Suisse Last data point: 09/2021
Swiss office property market 2022 | December 2021 17You can also read