The Iconic Atlantic Goliath Grouper (Epinephelus itajara): A Comprehensive Assessment of Health Indices in the Southeastern United States Population
←
→
Page content transcription
If your browser does not render page correctly, please read the page content below
ORIGINAL RESEARCH
                                                                                                                                         published: 25 September 2020
                                                                                                                                         doi: 10.3389/fvets.2020.00635

                                             The Iconic Atlantic Goliath Grouper
                                             (Epinephelus itajara): A
                                             Comprehensive Assessment of
                                             Health Indices in the Southeastern
                                             United States Population
                                             Christopher R. Malinowski 1,2,3*, Justin R. Perrault 4,5 , Felicia C. Coleman 1 ,
                                             Christopher C. Koenig 1 , Justin M. Stilwell 6 , Carolyn Cray 7 and Nicole I. Stacy 7,8
                                             1
                                              Florida State University Coastal and Marine Laboratory, St. Teresa, FL, United States, 2 Department of Biological Science,
                                             Florida State University, Tallahassee, FL, United States, 3 Department of Forestry and Natural Resources, Purdue University,
                                             West Lafayette, IN, United States, 4 Mote Marine Laboratory, Sarasota, FL, United States, 5 Loggerhead Marinelife Center,
                                             Juno Beach, FL, United States, 6 Department of Pathology, College of Veterinary Medicine, University of Georgia, Athens,
                                             GA, United States, 7 Division of Comparative Pathology, Department of Pathology & Laboratory Medicine, University of Miami
                                             Miller School of Medicine, Miami, FL, United States, 8 Department of Comparative, Diagnostic, and Population Medicine,
                           Edited by:        College of Veterinary Medicine, University of Florida, Gainesville, FL, United States
                       Jennifer Johns,
Oregon State University, United States
                                             The Atlantic Goliath Grouper (Epinephelus itajara) population has rebounded from near
                       Reviewed by:
             Sean Thomas Spagnoli,
                                             extinction to an international status as vulnerable due in part to regional species
Oregon State University, United States       recovery efforts. The southeastern US population has been recovering with the main
                          Rubina Sirri,      spawning locations off the coasts of Florida. Despite their economic importance to
           University of Bologna, Italy
                                             the catch-and-release fishery and the dive industry, and their ecological importance as
                   *Correspondence:
             Christopher R. Malinowski       ecosystem engineers resulting in positive impacts on reefs and species richness, baseline
                 crmalino@purdue.edu         health assessment information is very limited in this species to date. The objectives
                                             of this study were to: (1) establish reference intervals for hematological and plasma
                    Specialty section:
         This article was submitted to       biochemical analytes, and report immune function, oxidative stress, and vitellogenin in
          Veterinary Experimental and        mature males and females; (2) evaluate total length, age, and sex in relation to blood
                 Diagnostic Pathology,
                                             analytes in juvenile and mature fish; (3) assess analytes across sampled months in mature
                a section of the journal
        Frontiers in Veterinary Science      male and female fish; and (4) describe the typical light microscopy findings in liver and
            Received: 23 June 2020           gill biopsies, including quantitative assessment of pigmented macrophage aggregates.
         Accepted: 04 August 2020            Health indices are reported as reference intervals when applicable, or otherwise
      Published: 25 September 2020
                                             descriptively. Blood analyte correlations with length and age, sex differences, and
                                Citation:
             Malinowski CR, Perrault JR,
                                             comparisons across months provided relevant physiological considerations, including
  Coleman FC, Koenig CC, Stilwell JM,        differences in protein/energy metabolism, tissue growth, sexual maturation, active
Cray C and Stacy NI (2020) The Iconic
                                             reproduction, and antigenic stimulation. Liver histology identified changes associated
  Atlantic Goliath Grouper (Epinephelus
itajara): A Comprehensive Assessment         with life stage, active reproduction, or of subclinically to clinically insignificant infectious
  of Health Indices in the Southeastern      and/or inflammatory processes. Hepatocellular vacuolation and pigmented macrophage
               United States Population.
                   Front. Vet. Sci. 7:635.
                                             aggregates were prominent. Pigmented macrophage aggregates correlated with total
         doi: 10.3389/fvets.2020.00635       length, presumably from continuous antigenic stimulation and/or metabolic changes as

Frontiers in Veterinary Science | www.frontiersin.org                               1                                           September 2020 | Volume 7 | Article 635
Malinowski et al.                                                                                             Goliath Grouper Comprehensive Health Assessment

                                             fish grow. Gill histological findings were subtle. The data presented herein provide an
                                             essential baseline assessment of a suite of health variables in an iconic marine teleost
                                             species, serves as a springboard for future studies relevant to conservation physiology,
                                             and allows for population-level applications for conservation management and policy.

                                             Keywords: hematology, histology, marine teleost, native immune functions, oxidative stress, plasma biochemistry,
                                             conservation ecology

INTRODUCTION                                                                        Goliath Grouper) (20). This species is the largest grouper in
                                                                                    the Atlantic (reaching adult sizes of >2 m total length and
Conservation physiology is a newly emerging discipline that                         360–450 kg), long-lived (at least 37 years), charismatic, and it
examines the health status and physiological responses of                           resides in waters of the western Atlantic Ocean, Gulf of Mexico,
wildlife to environmental disturbances in an effort to better                       and Caribbean south to Brazil (21–24). Goliath Grouper are
understand factors contributing to population declines (1,                          characterized as slow-maturing, protogynous hermaphrodites
2). These assessments are crucial for conservation efforts,                         (21, 25) with known spawning locations in coastal waters of
as wildlife are increasingly faced with such anthropogenic                          Florida in the southeastern United States (26, 27) and off the
threats as climate change, habitat loss, pathogen introduction,                     southern coast of Brazil (28). Largely due to overfishing, these
contaminant exposure, and overexploitation (3–5). Many of                           animals faced near extinction in the early 1990s. They now
these perturbations are occurring at unprecedented rates and                        show signs of population recovery off the coasts of Florida due
have already resulted in recognizable declines in individual and                    to the closing of commercial and recreational fisheries from
population health, making conservation and recovery efforts                         extractive exploitation but remain in low numbers elsewhere
challenging (4, 5). Population-level health assessments involve                     throughout their range. Several factors continue to cast doubt on
a combination of physical and physiological examinations in an                      whether full recovery has occurred and will be possible in Florida,
effort to establish “baselines” for hematological and biochemical                   including loss of mangrove habitat, destructive episodic events
analytes (2–4). It is when shifts in these biomarkers occur                         such as red tide and sudden cold exposure in winter months, and
that physiologically relevant alterations in population health in                   health and reproductive effects of high mercury concentrations
response to various stressors can be recognized (6, 7). Population                  in tissues and gonads (29–32). Due to conservation efforts
health and viability are inseparable, and therefore monitoring                      in the United States, Florida now serves as the center of
the health of organisms and their populations can be used to                        recovery for the remaining Goliath Grouper population (32,
inform management and to improve upon our understanding of                          33).
complex conservation issues (2, 3).                                                    Baseline blood analyses can be used to assess sublethal impacts
   Comprehensive health assessments of threatened and                               of environmental contaminants, but it is necessary to first
endangered wildlife species are much rarer in comparison                            establish reference intervals to gauge what is “physiologically
to domestic and aquaculture species (8–10). Hematological                           normal” in these animals (34). Such assessments can, and should,
and biochemical analyses can be useful in identifying stress,                       be conducted using non-lethal methods whenever possible.
inflammation, diseases, and nutritional deficiencies, among                         Therefore, the objectives of this study were to use non-
many other underlying conditions or responses to physiological                      lethal sampling methods (1) to establish reference intervals
changes. However, these diagnostic procedures are less frequently                   for hematological and plasma biochemical analytes, and report
utilized in fishes compared to other vertebrate species, whether                    immune function, oxidative stress, and vitellogenin in mature
mammalian or not (9, 10). Baseline health studies in fishes have                    males and females; (2) to evaluate total length, age, and sex in
primarily focused on aquaculture species, including salmon                          relation to blood analytes in juvenile and mature fish; (3) to assess
[Salmo salar, (11)], tilapia [Oreochromis sp., (12)], sturgeon                      analytes across sampled months in mature male and female fish;
[Acipenser spp., (13, 14)], and seabass [Dicentrarchus labrax,                      and (4) describe the typical light microscopy findings in liver
(9)]. Reports of hematological and biochemical blood analytes                       and gill biopsies, including quantitative assessment of pigmented
are much less common for wild teleosts and elasmobranchs                            macrophage aggregates.
(15–19). Because of the paucity of information on baseline blood
analytes in wild fishes, it is crucial to establish reference intervals
in marine fish populations to better understand overall health                      MATERIALS AND METHODS
and disease prevalence. These reference intervals can then be
used as a basis for investigating spatial and temporal trends and                   Capture, Tissue Sampling and Preparation
for assessing population dynamics after potential environmental                     This research was performed in accordance with institutional and
changes, stressors, or specific threats that might occur over                       national guidelines concerning the use of animals in research,
time (5).                                                                           and was approved by the Florida State University Institutional
   One internationally vulnerable marine fish species is the                        Animal Care and Use Committee (IACUC) (protocol #s:
Atlantic Goliath Grouper (Epinephelus itajara; hereafter, called                    1106, 1411, and 1718); Florida Fish and Wildlife Conservation

Frontiers in Veterinary Science | www.frontiersin.org                           2                                       September 2020 | Volume 7 | Article 635
Malinowski et al. Goliath Grouper Comprehensive Health Assessment
Commission permits SAL-15-1244A-SRP, SAL-16-1244A-SRP, were processed according to standard histological methods using
SAL-17-1244-SRP; and the National Oceanic and Atmospheric a tissue processor. Processed tissues were embedded in paraffin,
Administration permit F/SER24:PH. sectioned to 3–5 µm thickness, and stained with hematoxylin
This work was conducted throughout the coastal waters and eosin (H&E) for viewing by light microscopy. Additional
of Florida [for capture and sampling region details see (31)] sections were stained with periodic acid Schiff (PAS) with and
at depths between 10 and 35 m for adults andMalinowski et al. Goliath Grouper Comprehensive Health Assessment
We quantified total protein in two ways: (1) using the to as melano-macrophage centers, which are aggregates of highly
Biuret method, indicated as “Total protein (B) in Tables 1– pigmented phagocytes (40, 41). These were a prominent feature
3”; and using a refractometric method (ReichertR VET360, of liver tissue identified from preliminary histological analyses in
Reichert R Technologies, Buffalo, New York USA) indicated this study. To quantify area and count of PMAs, images were
as “Total protein (R) in Tables 1–3. Electrophoresis was taken from a subset of the fish with liver biopsies collected
carried out using split beta gels and the SPIFE 3,000 system (n = 55) using a Canon EOS equipped with a DSLR adapter
(Helena Laboratories, Beaumont, Texas USA) to measure the for compound microscopes and Digital Photo Professional 4
concentrations of 6 fractions. software. For each prepared microscope slide, five images were
Vitellogenin was quantified using a grouper-specific taken of random and non-overlapping representative areas at
VTG ELISA kit, which employs the competitive enzyme each 100× and 400× total magnification. Counts of PMAs were
immunoassay technique in the detection range of 60– quantified manually from 100× images, and area of PMA per
1,200 ng/mL (MyBioSource, San Diego, California USA). total image area in pixels and percent area occupied by PMAs
Vitellogenin was measured by adding standards or samples to were calculated (42) from 400× images using ImageJ software
appropriate wells containing horseradish peroxidase (HRP) (43). The five counts and area estimates were then averaged per
conjugated-rabbit antibody. slide and reported as PMA % area and count (44).
Plasma biochemical analytes were measured using the dry
chemistry analyzer Vitros 250XR (Ortho, Rochester, New York Data Analysis
USA) at UMAW and included alkaline phosphatase (ALP) Reference Intervals
aspartate aminotransferase (AST), blood urea nitrogen (BUN), Reference intervals for hematology, plasma biochemistry, and
calcium, cholesterol, creatine phosphokinase (CK), creatinine, protein electrophoresis data were calculated using MedCalc
glucose, iron, lactate dehydrogenase (LDH), lipase, magnesium, (MedCalc Software v.18.5, Ostend, Belgium) following the
phosphorus, potassium, sodium, total bilirubin, triglycerides, American Society of Veterinary Clinical Pathology reference
and uric acid. The calcium:phosphorus ratio was calculated. For interval guidelines using a combination of non-parametric and
glucose, the minimum detection limit was 10 mg/dL. For the two parametric methods, depending on sample size and distribution
samples that fell below this limit, the low value of “10” was used of the data (45). Reference intervals in conventional units
for statistical purposes. were established for all mature male and female fish combined
Immune function, antioxidant capacity, and indicators of (Table 1), and also females (Table 2) and males (Table 3)
oxidative stress were quantified using plasma to measure individually. These same reference intervals were also converted
activities of lysozyme, glutathione peroxidase (GPx), superoxide to Standard International units (Supplemental Tables 1–3).
dismutase (SOD), and concentrations of reactive oxygen and Normality was assessed using the D’Agostino-Pearson test, while
nitrogen species (ROS/RNS). Lysozyme activity was analyzed outliers were detected using the Reed test. Logarithmic or Box-
using standard turbidity assays performed by Walsh et al. Cox transformation was employed when necessary. Biochemistry
(37). At UMAW, GPx was measured using a commercially and protein electrophoresis samples with visual hemolysis scores
available glutathione peroxidase assay kit (Cayman Chemical of ≥1+ were removed from the dataset prior to calculation of
Co., Michigan USA). A spectrophotometer was used to measure reference intervals given the potential interference of hemolysis
GPx activity following the oxidation of NADPH at 340 nm on various blood analyte measurements (46).
in this reaction. SOD was quantified using a SOD assay kit
(Cayman Chemical Co., Ann Arbor, Michigan USA), which Statistical Analysis
detects superoxide radicals generated by xanthine oxidase and All analyses were conducted using R (R Development Core
hypoxanthine through the use of a tetrazolium salt. SOD Team). To reduce dataset complexity for hematology, plasma
was measured as the proportional amount of enzyme needed biochemistry, and plasma proteins, similar variables were
to exhibit 50% dismutation of the superoxide radical at grouped into these respective categories. We used canonical
an absorbance of 450 nm. Concentrations of ROS/RNS were correlation analysis (CCA) as an exploratory analytical method
evaluated using an OxiSelectTM In Vitro ROS/RNS Assay Kit to investigate the relationships between multivariate datasets of
(Green Fluorescence, Cell Biolabs, Inc., San Diego, California size (i.e., total length), age, and sex with health variables in
USA), following the manufacturer’s instructions (38, 39). This all fish, including juvenile and mature fish and all sexes, to
assay universally measured ROS and RON species, which investigate potential morphometrical effects on blood analyte
can include, among others, hydrogen peroxide, nitric oxide, data. Multivariate CCA was carried out separately on analytes
peroxynitrite, and peroxyl radicals. of hematology, plasma proteins, and plasma biochemistry to
limit the inflation of Type I error rates and to reduce the
Histopathological Analysis number of pairwise analyses. Individual parameters of PCV and
Prepared liver and gill tissue slides were evaluated using a VTG, along with immune system and oxidative stress, were not
Leica DM1000LED microscope (Leica Microsystems Inc, Buffalo tested using CCA due to few parameters relative to the three
Grove, Illinois USA) at UGACVM Histology Laboratory. previously mentioned categories, and lower sample sizes. Tests of
Additional analyses on liver tissue slides were conducted at dimensionality, to determine which canonical dimensions were
Florida State University (Tallahassee, Florida, USA) to evaluate statistically significant at the 0.05 level, were conducted using
pigmented macrophage aggregates (PMAs), sometimes referred likelihood ratio tests with Wilks’ lambda distribution. Zscores
Frontiers in Veterinary Science | www.frontiersin.org 4 September 2020 | Volume 7 | Article 635Malinowski et al. Goliath Grouper Comprehensive Health Assessment
TABLE 1 | Measures of central tendency, range, and reference intervals (with 90% confidence intervals for upper and lower limits) for hematological, plasma biochemical,
and plasma protein electrophoretic data for all adult Atlantic Goliath Grouper (Epinephelus itajara) in conventional units.
N Mean ± SD SE Median Range 95% RI (90% CI) Data distribution/RI
method/Transformation
Lower limit Upper limit
Hematology
Packed cell volume (%) 32 36 ± 7 1 36 24–52 23 (19–26) 50 (46–53) G/P/N
White blood cells (×103 /µL) 140 6.21 ± 1.83 0.15 6.05 2.80–9.50 3.01 (2.80–3.60) 9.30 (9.10–9.50) NA/NP/N
Neutrophils (×103 /µL) 140 1.19 ± 0.53 0.04 1.10 0.29–2.50 0.36 (0.29–0.49) 2.30 (2.10–2.50) NA/NP/N
Immature neutrophils (×103 /µL) 140 0.080.34 0.03 0 0–3.90 0 (0) 0.26 (0.18–3.90) NA/NP/N
Lymphocytes (×103 /µL) 140 3.87 ± 1.14 0.10 3.75 1.60 −6.30 2.05 (1.60–2.20) 5.95 (5.70–6.30) NA/NP/N
Monocytes (×103 /µL) 140 1.08 ± 0.38 0.03 1.00 0.38–2.20 0.47 (0.38–0.53) 1.95 (1.70–2.20) NA/NP/N
Eosinophils (×103 /µL) 140 0.05 ± 0.05 0 0.05 0–0.23 0 (0) 0.18 (0.16–0.23) NA/NP/N
Basophils (×103 /µL) 140 0 ± 0.01 0 0 0–0.08 0 (0) 0 (0–0.08) NA/NP/N
Plasma biochemistry
Alkaline phosphatase (U/L) 58 68 ± 20 3 65 21–112 28 (21–36) 108 (100–116) G/P/N
Aspartate aminotransferase (U/L) 58 100 ± 87 11 83 19–652 29 (24–35) 273 (213–353) G/P/B
Blood urea nitrogen (mg/dL) 58 NA NA 5Malinowski et al. Goliath Grouper Comprehensive Health Assessment
TABLE 2 | Measures of central tendency, range, and reference intervals (with 90% confidence intervals for upper and lower limits) for hematological, plasma biochemical,
and plasma protein electrophoretic data for mature female Atlantic Goliath Grouper (Epinephelus itajara) in conventional units.
N Mean ± SD SE Median Range 95% RI (90% CI) Data distribution/RI
method/Transformation
Lower limit Upper limit
Hematology
Packed cell volume (%) 12 38 ± 7 2 39 24–47 NA NA Cannot calculate RIs for
sample sizesMalinowski et al. Goliath Grouper Comprehensive Health Assessment
TABLE 3 | Measures of central tendency, range, and reference intervals (with 90% confidence intervals for upper and lower limits) for hematological, plasma biochemical,
and plasma protein electrophoretic data for mature male Atlantic Goliath Grouper (Epinephelus itajara) in conventional units.
N Mean ± SD SE Median Range 95% RI (90% CI) Data distribution/RI
method/Transformation
Lower Limit Upper Limit
Hematology
Packed cell volume (%) 20 35 ± 7 2 34 27–52 22 (18–27) 49 (43–54) G/P/N
3
White blood cells (×10 /µL) 75 6.34 ± 1.86 0.21 6.20 2.80–9.50 3.24 (2.92–3.60) 11.27 (10.15–12.52) G/P/Logarithmic
Neutrophils (×103 /µL) 75 1.22 ± 0.55 0.06 1.10 0.29–2.50 0.39 (0.32–0.48) 2.55 (2.26–2.88) G/P/B
Immature neutrophils (×103 /µL) 75 0.11 ± 0.45 0.05 0 0–3.90 NA NA Cannot calculate RIs
Lymphocytes (×103 /µL) 75 3.94 ± 1.18 0.14 4.00 1.60–6.30 1.98 (1.78–2.20) 7.11 (6.39–7.92) G/P/Logarithmic
Monocytes (×103 /µL) 75 1.09 ± 0.38 0.04 1.10 0.47–2.00 0.34 (0.22–0.47) 1.83 (1.71–1.96) G/P/N
Eosinophils (×103 /µL) 75 0.06 ± 0.05 0.01 0.06 0–0.23 0 (0) 0.15 (0.13–0.17) NG/R/N
3
Basophils (×10 /µL) 75 0 ± 0.01 0 0 0–0.08 0 (0) 0 (0) NG/R/N
Plasma biochemistry
Alkaline phosphatase (U/L) 33 72 ± 22 4 71 21–112 30 (19–40) 115 (104–125) G/P/N
Aspartate aminotransferase (U/L) 33 117 ± 105 18 90 34–652 42 (36–50) 331 (219–559) G/P/B
Blood urea nitrogen (mg/dL) 33 7±3 1 6 3–14 3 (2–4) 14 (11–17) G/P/Logarithmic
Calcium (mg/dL) 33 14.1 ± 1.9 0.3 14.1 8.3–18.6 10.3 (9.3–11.2) 17.9 (16.9–18.9) G/P/N
Calcium: phosphorus ratio 33 1.31 ± 0.29 0.05 1.39 0.84–2.01 0.74 (0.59–0.88) 1.88 (1.74–2.03) G/P/N
Cholesterol (mg/dL) 33 161 ± 40 7 153 65–253 83 (64–103) 239 (219–259) G/P/N
Creatine phosphokinase (U/L) 33 NA NA 147Malinowski et al. Goliath Grouper Comprehensive Health Assessment
Monte-Carlo simulation as an alternative to classical procedures. The number of blood and liver samples collected varied due to
The categorical factor “sex” (male, female, transitional) was logistics of sample collection and handling. A comparison of age
compared with separate clinical parameters using GLM with and size between sexes for adults showed no difference in age, but
family Gaussian. The only exception to this was for PMA count a marginally significant difference in total length between males
data, for which GLM with family Poisson was conducted. For (mean = 163.8, median = 164, SD = 19.2) and females (mean
these GLMs, multiple comparisons were conducted using the = 173.0, median = 171, SD = 21.2) was observed, with females
glht function with packages emmeans and multcomp to produce being larger (p = 0.03).
Tukey contrasts with adjusted p-values. For linear regressions,
the Holm-Bonferroni method was used to correct for multiple Reference Intervals
comparisons (50). Conventional unit measures of central tendency, range, and
To test the relationship between VTG and each of the six reference intervals for all fishes, females only, and males only
protein fractions determined by protein electrophoretograms, are reported in Tables 1–3, respectively. Standard International
we used linear regression analysis. Data were transformed are reported in Tables S1–S3. For plasma biochemical, immune
(natural-log, square-root) to meet parametric assumptions system and oxidative stress analytes with too low of a sample
where appropriate. size for reference intervals, descriptive statistics are reported
The relationship between total length (TL, cm) and age in Table 4.
(yrs) for Goliath Grouper was previously shown by Malinowski
(31) to be strongly positively correlated (r2 = 0.51, p < PCV, Hematology, Plasma Proteins, and
2 × 10⁻¹⁶ ), but here we also compared size and age VTG
between males, females, and transitionals using analysis of There were no significant correlations between hematology data,
variance and Tukey contrasts with adjusted p-values. Because including PCV and leukogram, and age or total length (p >
length and age are known to be important factors in 0.05). Thrombocyte numbers were determined to be adequate
determining fish health (51, 52), both were included as factors in all blood films evaluated, often with variably sized clumps
in this study. that prevented a more detailed quantitative assessment. Samples
To evaluate trends in blood analytes across months of sample from the majority of fish did not show any evidence of red blood
collection for mature males and females, we used analysis cell (RBC) immaturity (i.e., lack of anisocytosis, polychromasia,
of variance and Tukey contrasts with adjusted p-values after immature erythroid stages), with only n = 3 displaying mild
transforming (natural-log, square-root) any data that did need anisocytosis and polychromasia averaging 14 immature RBC/100
meet parametric assumptions. For data that did not meet mature RBC (range 9–21 immature RBC/100 mature RBC).
assumptions after transformation, we used GLMs with the glht There were also no significant differences in leukogram data
function for multiple comparisons. Because some months for among females, males, and transitionals (p > 0.05). Lymphocytes
mature males or females had little data, not all months of were the predominant WBC type. As described in Materials and
sample collection (May, July, August, September, October) were Methods, CCA was not performed on PCV or VTG due to few
represented for both sexes. For males, there were only two parameters and low sample size.
samples from mid-July so we combined those into the month For plasma proteins, the first CCA (CCA1) was statistically
of Aug. This was justifiable because July and August are the significant (F = 2.257, p = 0.002) and strongly correlated
two primary spawning months. For females, there was only with a canonical correlation coefficient (CCC) of 0.63 between
one sample in October, and we decided to remove from this plasma protein analytes and sex, age, and total length variables
analysis because it could not be justifiably combined into the (Supplemental Table 5). The total variance explained by the
previous month. CCA1 was 71.8%. In order of CCA loading value, for plasma
protein analytes, the first canonical dimension was most strongly
RESULTS influenced by fraction 2 (loading strength = 0.51), fraction 1
(loading strength = −0.49), and fraction 4 (loading strength =
Study Animals and Sampling −0.27). For sex, age, and length variables, the first dimension was
A total of 510 Goliath Grouper were caught, from which 195 comprised of total length (loading strength = −0.88) and age
blood samples were collected for hematological analysis. Of those (loading strength = −0.46).
195 blood samples, 139 were used for blood plasma analyses Linear regression analysis revealed a number of significant
of various health variables. Of the 139 samples used for blood results with protein fractions, which are detailed in Table 5.
plasma analyses, the major portion of this study, they were Fraction 2 was significantly negatively correlated with total length
collected from different sexes and age groups (nfemale = 58, nmale (r2 = 0.18) and age (r2 = 0.06), while fraction 4 was negatively
= 62, ntransitional = 6, nunknown = 8, njuvenile = 5), with ages (yrs) correlated with age (r2 = 0.05). Although sex had a fairly low
ranging from 4 to 19 (median = 11, mean = 10.8, SD = 3.1) canonical loading (loading strength = 0.11), we did find that
and total lengths (cm) from 57 to 219 (mean = 163.4, median males had significantly higher fraction 2 concentrations than
= 165, SD = 27.5) (Supplemental Figure 3). From the 510 fish females and that the concentration of this fraction for females
caught, we also opportunistically collected liver samples (n = was significantly negatively correlated with total length, with this
183) and gill samples (n = 44) for histopathological review, many female-only negative correlation (r2 = 0.25) being stronger than
of which had corresponding blood samples collected, but not all. with all sexes combined. The other sex-related result for proteins
Frontiers in Veterinary Science | www.frontiersin.org 8 September 2020 | Volume 7 | Article 635Malinowski et al. Goliath Grouper Comprehensive Health Assessment
TABLE 4 | Descriptive statistics of immune and oxidative stress indicators, and vitellogenin, for adult (male, female, transitional) Atlantic Goliath Grouper (Epinephelus
itajara) that were not included as reference intervals.
Health index Mean SD SE Median Min Max N
ALL ADULT
Immune/oxidative stress
GPx (nmol/min/ml) 383.25 193.23 28.49 374.39 40.75 784.45 46
Lysozyme (µg/ml) 3.86 1.64 0.19 3.17 1.37 7.74 76
ROS/RNS (nM) 6432.65 1561.47 218.65 6177.36 3431.45 9087.93 51
Superoxide dismutase (U/ml) 15.47 20.16 1.98 7.55 0.82 120.01 104
Protein precursor
Vitellogenin (ng/ml) 433.89 212.33 32.76 382.76 79.32 1017.28 42
FEMALE
Immune/oxidative stress
GPx (nmol/min/ml) 351.98 190.99 42.71 336.19 40.75 652.01 20
Lysozyme (µg/ml) 3.94 1.74 0.30 3.42 1.37 7.11 33
ROS/RNS (nM) 5962.35 1295.73 254.11 5703.19 3431.45 8402.36 26
Superoxide dismutase (U/ml) 15.37 24.06 3.51 5.70 1.33 120.01 47
Protein precursor
Vitellogenin (ng/ml) 506.44 260.21 59.70 469.80 79.32 1017.28 19
MALE
Immune/oxidative stress
GPx (nmol/min/ml) 388.15 207.44 46.38 427.88 40.75 784.45 20
Lysozyme (µg/ml) 3.84 1.60 0.25 3.14 1.78 7.74 41
ROS/RNS (nM) 7010.24 1661.69 339.19 7474.49 3569.95 9087.93 24
Superoxide dismutase (U/ml) 16.95 16.88 2.36 10.32 0.82 79.21 51
Protein precursor
Vitellogenin (ng/ml) 376.82 136.97 33.22 374.35 201.89 784.88 17
Plasma samples with evidence of hemolysis or lipemia were removed from the dataset for calculation of descriptive statistics. SD, standard deviation; SE, standard error; GPx, glutathione
peroxidase; ROS, reactive oxygen species; RNS, reactive nitrogen species.
TABLE 5 | Statistically significant plasma protein electrophoresis fractions and vitellogenin of Atlantic Goliath Grouper (Epinephelus itajara) categorized by sex (T,
transitional; F, female; M, male) and by continuous variables of total length and age.
Analyte Sex (T*F) (Sex M*F) Sex (M*T) Total length (cm) Age (yr)
Plasma protein electrophoresis
Fraction 2a p = 0.005 p < 0.001 p = 0.009
nM/F = 37/39 n = 88, r2 = 0.18 n = 86, r2 = 0.06
Z = 3.07 F = 19.42, df = 86 F = 6.78, df = 84
Female p < 0.001
n = 39, r2 = 0.25
F = 13.31, df = 37
Fraction 5 p = 0.049 p = 0.045
nT/F = 4/39 nM/T = 37/4
Z = −2.31 Z = 2.35
Fraction 4 p = 0.025
n = 86, r2 = 0.05
F = 5.30, df = 84
Protein precursor: Vitellogenin
Male p = 0.030
n = 18, r2 = 0.23
F = 6.04, df = 16
Female p = 0.021
n = 19, r2 = 0.26
F = 7.43, df = 17
a Data were natural-log transformed.
Where male and female categorical variables were significantly different, respective significant post-hoc linear regression results are shown. The p-value is given with adjusted r2 value
in parentheses. Blank cells indicate no significant difference or correlation. For sex, bolded values indicate the first sex in the pairwise comparison is lower and italicized values indicate
the first sex is greater. For total length and age, negative relationships are bolded and positive relationships are italicized.
Frontiers in Veterinary Science | www.frontiersin.org 9 September 2020 | Volume 7 | Article 635Malinowski et al. Goliath Grouper Comprehensive Health Assessment
FIGURE 1 | Boxplots showing significant (p < 0.05) biochemistry analytes, plasma protein electrophoresis fractions, vitellogenin, and immune system and oxidative
stress analytes for female Atlantic Goliath Grouper (Epinephelus itajara) across sample collection months (May, July, August, September). There was only one sample
in October, and we decided to remove from this analysis because it could not be justifiably combined into the previous month. Shading represents reference intervals.
Different letters indicate significant difference. Range = vertical dashed lines, median = bold horizontal lines in box, first quartile = area below the line in the box, third
quartile = area above the line in the box. The upper and lower ends of the nominal data range is defined as the respective interquartile distance (IQD) ± 1.5 IQD. Open
circles = points that fall outside of this range.
was that fraction five concentrations were significantly lower in variance explained by CCA1 was 56.9%. In order of CCA
transitionals than both males and females. Concentrations of loading value, for plasma biochemical analytes, the first canonical
VTG were similar for males, females, and transitionals (p > 0.05), dimension was most strongly influenced by BUN (loading
but concentrations significantly increased (p < 0.05) with total strength = −0.70), creatinine (loading strength = −0.64),
length (r2 = 0.26) for females and total length (r2 = 0.23) for glucose (loading strength = −0.48), uric acid (loading strength =
males. PCV did not correlate significantly with total length or age −0.47), lipase (loading strength = −0.45), phosphorus (loading
and was not different between sexes (p > 0.05). strength = −0.42), LDH (loading strength = −0.36), iron
There were no significant correlations (p > 0.05) between (loading strength = −0.34), CPK (loading strength = −0.30),
VTG and each of the protein fractions. and potassium (loading strength = −0.26). For sex, age, and
For females, protein fraction 1 significantly (p < 0.05) total length variables, the first dimension was comprised of total
increased from May to July and August, and then decreased length (loading strength = 0.80), age (loading strength = 0.61),
in September (Figure 1, Supplemental Table 4). Fractions 3 and sex (loading strength = 0.70). Significant results for plasma
and 6 significantly decreased from May through the following biochemistry pairwise tests and linear regressions are detailed in
months. Fraction 4 decreased only from September to August. Table 6.
Vitellogenin increased from May through September, but with BUN was significantly (p < 0.05) higher in males than females
May not significant because of too few samples (n =2). and transitionals. There was a significant (p < 0.05) negative
For males, protein fraction 3 was significantly (p < 0.05) lower relationship between BUN and age for males, but not females,
from May and September, but August and October were not with a stronger correlation for males (r2 = 0.30) than for all
different (Figure 2, Supplemental Table 4). sexes combined (r2 = 0.22). There was also a significant (p <
0.05) negative relationship between BUN and total length for
Plasma Biochemistry females (r2 = 0.08) and males (r2 = 0.34), with males showing the
The CCA for plasma biochemistry included all biochemical strongest correlation—similar to that of all sexes combined (r2 =
analytes. For those, the first canonical correlation was statistically 0.37). Creatinine was significantly (p < 0.05) higher in males than
significant (F1 = 1.72, p = 0.007) and strongly correlated with females and transitionals, and showed a negative relationship
a CCC of 0.76 between blood biochemical analytes and sex, with total length and age. There was a significant (p < 0.05)
age, and total length variables (Supplemental Table 5). The total negative relationship between creatinine and age for males, but
Frontiers in Veterinary Science | www.frontiersin.org 10 September 2020 | Volume 7 | Article 635Malinowski et al. Goliath Grouper Comprehensive Health Assessment
FIGURE 2 | Boxplots showing significant (p < 0.05) biochemistry analytes, plasma protein electrophoresis fractions, and immune system and oxidative stress
analytes for male Atlantic Goliath Grouper (Epinephelus itajara) across sample collection months (May, August, September, October). There were only two samples
from mid-July so we combined those into the month of August. Shading represents reference intervals. Different letters indicate significant difference. Range = vertical
dashed lines, median = bold horizontal lines in box, first quartile = area below the line in the box, third quartile = area above the line in the box. The upper and lower
ends of the nominal data range is defined as the respective interquartile distance (IQD) ± 1.5 IQD. Open circles = points that fall outside of this range.
not females, with a stronger correlation for males (r2 = 0.11) than significantly (p < 0.05) lower in males than transitionals,
for all sexes combined (r2 = 0.08). There was also a significant (p while triglycerides were higher in females than males. No
< 0.05) negative relationship between creatinine and total length other differences or relationships were observed for plasma
for males (r2 = 0.18), with this correlation lower in comparison biochemistry analytes, including ALP, AST, cholesterol, CK,
to all sexes combined (r2 = 0.32). magnesium, sodium, and total bilirubin.
Glucose (r2 = 0.08) and iron (r2 = 0.0.08) were significantly For females, alkaline phosphatase, BUN, creatinine, iron,
(p < 0.05) negatively correlated with total length, albeit these and lipase significantly (p < 0.05) decreased from May
correlations were weak. Lactate dehydrogenase, potassium, and through September (Figure 1, Supplemental Table 4). Aspartate
uric acid all showed significant (p < 0.05) differences between aminotransferase, cholesterol, and uric acid significantly
sexes. Lactate dehydrogenase activity was significantly lower increased from the pre-spawning month of May to July, one
in transitionals than females, uric acid lower in males than of the peak spawning months, and then significantly decreased
transitionals, and potassium higher in males and females than in the following months. Potassium significantly decreased
transitionals (p < 0.05 in all cases). Significant (p < 0.05) negative from May through August, but then increased in September.
relationships occurred for lipase and phosphorus with total Triglycerides significantly increased from May and July to
2
length (r(lipase) 2
= 0.17, r(phosphorus) 2
= 0.06) and age (r(lipase) = August and September.
2
0.10, r(phosphorus) = 0.06). For males, BUN and creatinine significantly (p < 0.05)
While glucose is an important metabolite that should be increased from September to October, but were similar to each
considered, we chose to exclude glucose data from reference other in previous months (Figure 2, Supplemental Table 4).
interval development because samples were negatively affected Calcium and cholesterol significantly decreased between May
by sample processing delay, which could not be avoided in this and September, but was not different between other months. Uric
study. The raw data were included so that future investigations acid significantly increased from May to August, but the other
could consider confounding effects of sample handling on months were not different.
glucose concentrations by optimizing handling techniques and
analytical methodologies. Immune System and Oxidative Stress
Calcium (loading strength = −0.15) and triglycerides (loading As described in Materials and Methods, CCA was not performed
strength = 0.07) had low CCA loadings (Malinowski et al. Goliath Grouper Comprehensive Health Assessment
TABLE 6 | Statistically significant plasma biochemistry analytes of Atlantic Goliath Grouper (Epinephelus itajara) categorized by sex (T, transitional; M, male; F, female) and
by continuous variables of total length and age.
Plasma biochemical analyte Sex (T*F) (Sex M*F) Sex (M*T) Total length (cm) Age (yr)
Blood urea nitrogen p = 0.034 p = 0.002 p < 0.001 p < 0.001
nM/F = 35/38 nM/T = 35/4 n = 85, r2 = 0.37 n = 83, r2 = 0.22
Z = 2.46 Z = 3.32 F = 50.33, df = 83 F = 23.54, df = 81
Male p < 0.001 p < 0.001
n = 35, r2 = 0.34 n = 35, r2 = 0.30
F = 18.56, df = 33 F = 15.52, df = 33
Female p = 0.04
n = 38, r2 = 0.08
F = 4.34, df = 40
Calcium p = 0.042
nT/F = 4/38
Z = −2.38
Creatininea p = 0.033 p = 0.002 p < 0.001 p = 0.004
nM/F = 35/38 nM/T = 35/4 n = 85, r2 = 0.32 n = 83, r2 = 0.08
Z = 2.46 Z = 3.32 F = 39.69, df = 83 F = 8.05, df = 81
Male p = 0.008 p = 0.031
n = 35, r2 = 0.18 n = 35, r2 = 0.11
F = 8.05, df = 32 F = 5.06, df = 32
Glucosea p = 0.004
n = 85, r2 = 0.08
F = 7.87, df = 83
Iron p = 0.013
n = 84, r2 = 0.08
F = 8.06, df = 82
Lactate dehydrogenasea p = 0.027
nT/F = 4/38
Z = −2.26
Lipaseb p < 0.001 p < 0.001
n = 85, r2 = 0.17 n = 83, r2 = 0.10
F = 17.79, df = 83 F = 10.10, df = 81
Phosphorus p = 0.002 p = 0.004
n = 84, r2 = 0.06 n = 83, r2 = 0.06
F = 6.57, df = 82 F = 6.50, df = 81
Potassium p = 0.003 p < 0.001
nT/F = 4/38 nM/T = 35/4
Z = −3.28 Z = 3.82
Triglyceridesa p = 0.012
nM/F = 35/38
Z = −2.80
Uric acid p = 0.032
nM/T = 35/4
Z = −2.48
a Data were natural-log transformed.
b Data were square-root transformed.
Where male and female categorical variables were significantly different, respective significant post-hoc linear regression results are shown. The p-value is given with adjusted r2 value
in parentheses. Blank cells indicate no significant difference or correlation. For sex, bolded values indicate the first sex in the pairwise comparison is lower and italicized values indicate
the first sex is greater. For total length and age, negative relationships are bolded and positive relationships are italicized.
and significant results are detailed in Table 7. Reactive oxygen For females, SOD significantly (p < 0.05) decreased
and nitrogen species were significantly (p < 0.05) higher in males from May through July and August, and then increased in
than females, and SOD was higher in males than transitionals. September (Figure 1, Supplemental Table 4). Glutathione
Significant (p < 0.05) positive linear regressions, albeit fairly peroxidase significantly decreased from May through
weak, occurred for lysozyme with total length (r2 = 0.13) September. Lysozyme significantly increased from May
and age (r2 = 0.07). through September.
Frontiers in Veterinary Science | www.frontiersin.org 12 September 2020 | Volume 7 | Article 635Malinowski et al. Goliath Grouper Comprehensive Health Assessment
TABLE 7 | Statistically significant immune system and oxidative stress analytes of Atlantic Goliath Grouper (Epinephelus itajara) categorized by sex (T, transitional; M,
male; F, female) and by continuous variables of total length and age.
Immune/oxidative stress analyte Sex (T*F) (Sex M*F) Sex (M*T) Total length (cm) Age (yr)
Lysozymea p < 0.001 p = 0.010
n = 82, r2 = 0.13 n = 82, r2 = 0.07
F = 13.41, df = 80 F = 6.93, df = 80
Superoxide dismutasea p = 0.049
nM/T = 51/5
Z = 2.30
Reactive oxygen/nitrogen species p = 0.039
nM/F = 24/26
Z = 2.38
a Data were natural-log transformed.
Where male and female categorical variables were significantly different, respective significant post-hoc linear regression results are shown. The p-value is given with adjusted r2 value
in parentheses. Blank cells indicate no significant difference or correlation. For sex, bolded values indicate the first sex in the pairwise comparison is lower and italicized values indicate
the first sex is greater. For total length and age, negative relationships are bolded and positive relationships are italicized.
For males, lysozyme significantly increased from August troughs (n = 5/45, Figure 4D), and rare, possible epitheliocystis
to September, but all other months did not differ from each inclusions (n = 2/45, Figure 4E).
other (Figure 2, Supplemental Table 4). Glutathione peroxidase
significantly increased between September and October, but
neither differed from May and August. DISCUSSION
This study reports novel data on a suite of health variables
Pigmented Macrophage Aggregates for Goliath Grouper in Florida waters that provide an essential
Pigmented macrophages formed dense, round to ovoid
baseline “snapshot” and an important adjunct tool for assessing
aggregates with variable yellow, golden brown, and dark brown
population recovery. It also advances our knowledge about
pigmentation (Figure 3). Total length (range = 57–214 cm) was
Goliath Grouper physiology and lays the groundwork for
significantly positively correlated with PMA % area (r2 = 0.15,
future research on the effects of various natural and human-
df = 51, p = 0.004) and count (z = 2.278, df = 51, p = 0.02).
induced stressors impinging on this species throughout its range
Age (range = 4–18 yrs) and sex were not significant factors in
where currently no such baseline health data exists. Given the
pigmented macrophage aggregate abundance.
abundance and novelty of data generated by this work, the focus
of this current study lays on the animals and their intrinsic factors
Other Histological Changes as no baseline health data of this kind exist to date on this
The most consistent microscopical change observed was or other Goliath Grouper populations throughout their range.
mild to severe, diffuse, indistinct, cytoplasmic vacuolation of Future investigations into temporal, spatial, and various other
hepatocytes, which were PAS positive and diastase sensitive, aspects of this population will benefit from the baseline data
confirming glycogen content (n = 164/183, Figures 3A–F). Rare presented herein.
to infrequent changes (Figures 4A–E) included minimal to mild The influence of intrinsic (e.g., size, age, sex) and extrinsic
lymphocytic hepatitis (n = 19/183), periductal fibrosis (n = (e.g., water temperature, habitat, diet, capture techniques) factors
9/183), lipid vacuolation of hepatocytes (n = 7/183), mild, on various health variables is well-documented for many species
mixed periductal and perivascular inflammation (n = 4/183), [e.g., (53, 54)]. Intrinsic factors are of particular importance
sinusoidal distension by round, clear, well-delineated spaces regarding their effects on blood data of fishes (55, 56). Identifying
suggestive of gas bubbles that displace adjacent hepatocytes and understanding the influence of these factors, which are more
(n = 4/183, Figures 4A,B), and hepatocellular atrophy (n = variable and less controllable in wild than managed individuals
3/183). In many cases, liver sections contained rare to low of the same species, are essential for accurate data interpretation.
numbers of mineralized granulomas (n = 72/183). Trematode This is often the biggest challenge in wildlife health assessment
eggs consisting of a tan, refractile capsule and internal studies, given the many logistical challenges in sample acquisition
miracidium were rarely to infrequently found within PMAs (n = (e.g., stress from capture, effects from anesthesia if applicable)
30/183, Figure 3D). Rare cross sections of encysted nematodes and potential confounding factors related to animal handling and
∼120–150 µm in diameter and featuring a ridged, refractile sample collection.
cuticle, coelomyarian musculature, pseudocoelom, lateral cords, In our study, animal capture and handling techniques, as well
intestine, and developing gonads were present within the hepatic as analytical methodologies, were consistent for all analyses, thus
parenchyma (n = 3/183, Figure 4C). Within the gills, the most minimizing possible variability from extrinsic factors. Therefore,
frequent changes were rare to low numbers of small, mineralized we were able to focus interpretation of health assessment data of
granulomas (n = 11/45), few monogeneans in interlamellar Goliath Grouper on morphometrics and time period of sampling,
Frontiers in Veterinary Science | www.frontiersin.org 13 September 2020 | Volume 7 | Article 635Malinowski et al. Goliath Grouper Comprehensive Health Assessment FIGURE 3 | (A–C) Hepatocellular vacuolation and variable pigmented macrophage appearance in livers of Atlantic Goliath Grouper (Epinephelus itajara). (D) High magnification of a pigmented macrophage aggregate shows the presence of a trematode egg (arrow). (E) Variably sized globules of intracytoplasmic glycogen within hepatocytes stain deep magenta with PAS. (F) Staining of the hepatocellular cytoplasm with PAS is lost after exposure to diastase, consistent with the presence of glycogen, while pigmented macrophage aggregates retain PAS staining, indicating the presence of glycoproteins, particularly lipofuscin. Scale Bars: A = 100 µm, B-C = 20 µm, D-E = 10 µm, F = 20 µm. which are among the most important intrinsic and extrinsic The observed significant difference between males and females factors, respectively. Wildlife health assessments typically include in terms of total length, but not age, (Supplemental Figure 3) the establishment of reference intervals for blood analytes, and in this study population needs to be taken into account when often require partitioning of data into effects from factors such considering the discussion of sex differences of various analytes. as habitat, season, spawning condition, length, age, and sex While there are a number of blood analyte studies of marine when sufficient numbers of samples are available (45, 55, 57). elasmobranchs and cultured marine teleosts [e.g., (10, 15–17, Frontiers in Veterinary Science | www.frontiersin.org 14 September 2020 | Volume 7 | Article 635
Malinowski et al. Goliath Grouper Comprehensive Health Assessment
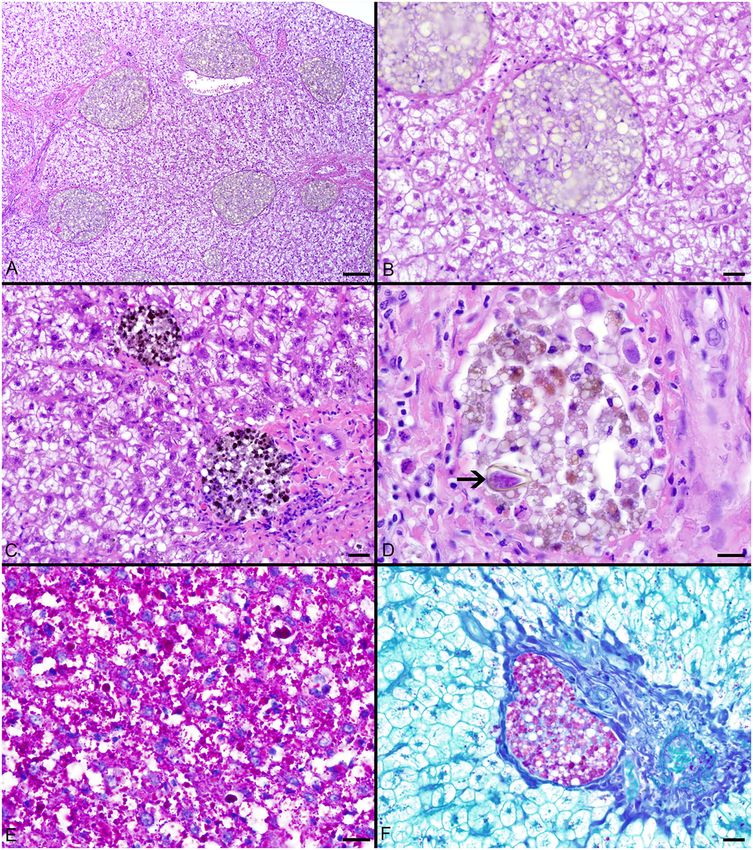
FIGURE 4 | (A) Large, round, clear spaces consistent with air bubbles multifocally displace myofibers in the heart of a fish that died during sampling. (B) Similar air
bubbles obstruct hepatic sinusoids, resulting in congestion of sinusoids and disruption of the adjacent liver parenchyma. (C) Cross section through an encysted
nematode adjacent to the liver capsule. (D) Monogenean parasites found within interlamellar spaces in the gill. (E) A single presumptive epitheliocystis inclusion within
the gill lamella. Scale Bars: A-B = 50 µm, C = 20 µm, D = 50 µm, E = 20 µm.
58)], there are few available for wild populations of marine This observation may reflect a recent response to either anemia
teleosts (59–61), with the data presented herein being the first or transiently lower PCV. Regarding leukogram findings in
for Goliath Grouper off Florida. Hence, it is both challenging Goliath Grouper, lymphocytes were the predominant WBC
and inappropriate to make comparisons among studies that use type, which is similar to numerous fish species reported in the
very different analytical methodologies for species that are vastly literature (55, 62). In addition, very low numbers of immature
different physiologically. neutrophils were identified and hence are considered a normal
Hematology data for Goliath Grouper showed more finding in this species.
consistencies than differences across such intrinsic factors as In contrast to the consistencies with hematology data, plasma
length, age, and sex. PCV was comparable to other teleost biochemical analytes showed several correlations in juvenile and
species and fell mostly within reported ranges (62); however, mature fish and monthly trends in mature males and females
the higher range in Goliath Grouper in this study exceeded allowing for considerations regarding some physiological aspects
the common upper limit of 45% PCV in teleosts, especially of this species. However, since all correlations of blood analytes
in males. This suggests either a subtle sex difference and/or with morphometrics were overall weak in this study, these
effects from stress during capture and handling (e.g., release of considerations are acceptable if interpreted with caution. Most
catecholamines resulting in hemoconcentration and swelling of correlations were observed with length and age concurrently,
RBCs) (55). Only three fish showed evidence of mild erythroid while few were associated with length alone (e.g., vitellogenin,
regeneration, two of which with available PCV data were at the glucose, iron) and only one with age alone (i.e., protein fraction
lower end of the reference interval (23 and 24%, respectively). 4). This shows that this population with an average age of 10.8
Frontiers in Veterinary Science | www.frontiersin.org 15 September 2020 | Volume 7 | Article 635Malinowski et al. Goliath Grouper Comprehensive Health Assessment
yrs (range = 4–19 yrs) and an average total length of 163 cm other analytes including calcium, cholesterol, iron, enzymes, and
(range = 57–219 cm) likely represents individuals in phases of potassium may suggest subtle differences or variations in feeding
somatic growth. Albeit study animals were considered sexually frequency/fasting, diet, metabolic rates, reproductive physiology,
mature, they presumably represent a younger population in the or nutritional state of individuals prior to sample collection. In
recovery stage, since the oldest Goliath Grouper reported to this same Goliath Grouper study population, a concurrent study
date was 37 yrs old, and, although the life span of Goliath found that males and females consumed the same prey but at
Grouper remains unknown, this species is thought to live to different frequencies, and there was a lot of variation in stomach
much older ages (21, 32, 33). Goliath Grouper can also reach fullness, with many individuals having empty stomachs at time
sizes of at least 250 cm total length (63), so a majority of of capture (66). Future research should directly consider diet
individuals in this study population have not yet reached their and blood plasma analytes to better understand the relationship
full growth potential. While this study provides a baseline for between these two factors.
morphometrical data in this recovering population of Goliath The protein electrophoretogram of the Goliath Grouper
Grouper, to see if these patterns and relationships hold in consistently provided 6 fractions across the analyses of all study
older and larger Goliath Grouper that reach their full growth samples. The fraction migration was very similar to that seen
and age potential, continued state and federal protection from in mammals with a dominant fraction 2 (presumptive albumin)
lethal extraction of this species is necessary. In addition, analyte and prominent fraction 5 (presumptive beta globulin migrating
differences (e.g., fraction 2 “presumptive albumin,” BUN) in fraction). Previously, 6 and 5 fractions have been described in
males and females may be associated with effects of sexual Rainbow Trout Oncorhynchus mykiss (67) and Koi Cyprinus
maturation or other associated dietary or physiological changes carpio (68), respectively. Whereas, Koi electrophoretogram also
(e.g., tissue growth). Males mature at slightly smaller sizes and had dominant fraction 2 and 5, Rainbow Trout samples exhibited
younger ages than females (21, 35), and the spawning season, a dominant fraction 3. Assigning specific protein fraction labels
when many samples were collected, is the only time of year where to fraction 1 to 6 is difficult as very few studies have been
females would transition to males. Moreover, most individuals conducted on teleosts using modern protein electrophoresis
from this population transition within the mean age range of methods. Changes in acute phase proteins in fish with natural
individuals in this study (25). The many variations of blood or experimental infection and with inflammatory processes have
analytes in mature males and females across sampled months been documented (69) so it is likely that many of these fractions
suggest sex-specific metabolic and physiological differences in represent proteins, metabolites, and hormones that function
pre-spawning and spawning months in this species. similarly to their mammalian counterparts. This conclusion is
Several identified differences in plasma biochemical analytes further supported by the observed variations in protein fractions
with length, age and/or sex indicate potential significance across months in mature males and females. The negative
regarding tissue growth and metabolic and/or nutritional correlation of fraction 2 with length and age is likely due to the
changes in a growing, reproductively active population. These observed significantly lower concentrations in females and the
analytes include BUN and phosphorus, which were negatively negative correlation for females by length. This sex difference
correlated with length and age, possibly indicating a difference corresponds with trends in other analytes, such as higher
in feeding intensity or protein metabolism. However, a recent BUN and creatinine in males, suggesting differences in protein
meal before capture should also be considered. Higher BUN and metabolism by sex. Fraction 4 is the one analyte showing a
creatinine in males compared to females and transitionals, but negative correlation only with age. This is an interesting contrast
lower uric acid in males compared to transitionals suggest sex to the positive correlation of lysozyme with length and age,
differences in muscle mass and/or protein/energy metabolism. indicating a tendency to increase in growing Goliath Grouper,
This is further supported by variations in BUN, creatinine, potentially suggestive of a greater capacity of the innate immune
and uric acid between adult males and females across sampled system and/or greater cumulative exposure to antigens as these
months. Although fish primarily excrete nitrogenous waste as fish age. Sex differences were observed through differences of
ammonia across their gills, urea is still present in all fish, if only higher SOD in males compared to transitionals, higher ROS/RNS
comprising a low percentage of nitrogenous waste, and is often species in males compared to females, and monthly trends of
of research interest, along with creatinine, in diagnosing gill or lysozyme, SOD, and GPx in mature males and females, possibly
liver disease (64, 65). Future Goliath Grouper research should suggesting variations in energy balance, diet, or an association
consider these patterns along with environmental toxicants in with circulating reproductive proteins.
diagnosing disease or other negative health effects. The negative Vitellogenin was positively correlated with length in females
correlation of creatinine in males with length and age may and negatively in males, with a substantial increase in mature
suggest that smaller males possibly have higher muscle mass females from pre-spawning through spawning months, showing
or reflect tissue growth. Creatinine, although similar to BUN an overt sex difference in a maturing population with growth
in that it occurs in relatively small amounts in teleosts, can and sexual development. For a protogynous hermaphrodite (i.e.,
also be a good indicator of health and potential renal damage change sex from female to male), like Goliath Grouper, it would
(64). The excretion and metabolism of nitrogenous wastes in also make sense that any males that transitioned from females
fishes is still poorly understood and the clinical and physiological would initially have high VTG that would then be reduced as
significance of these analytes still remains unknown (55). the now-male continues to grow, since VTG is an egg yolk
Observed correlations, sex differences, and monthly trends of precursor protein normally found only in females (70, 71).
Frontiers in Veterinary Science | www.frontiersin.org 16 September 2020 | Volume 7 | Article 635You can also read