Impaired SNF2L Chromatin Remodeling Prolongs Accessibility at Promoters Enriched for Fos/Jun Binding Sites and Delays Granule Neuron ...
←
→
Page content transcription
If your browser does not render page correctly, please read the page content below
ORIGINAL RESEARCH
                                                                                                                                              published: 06 July 2021
                                                                                                                                    doi: 10.3389/fnmol.2021.680280

                                            Impaired SNF2L Chromatin
                                            Remodeling Prolongs Accessibility at
                                            Promoters Enriched for Fos/Jun
                                            Binding Sites and Delays Granule
                                            Neuron Differentiation
                                            Laura R. Goodwin 1,2 , Gerardo Zapata 1,2 , Sara Timpano 1 , Jacob Marenger 1 and
                                            David J. Picketts 1,2,3*
                                            1
                                              Regenerative Medicine Program, Ottawa Hospital Research Institute, Ottawa, ON, Canada, 2 Department of Biochemistry,
                                            Microbiology and Immunology, University of Ottawa, Ottawa, ON, Canada, 3 Cellular and Molecular Medicine, University of
                                            Ottawa, Ottawa, ON, Canada

                                            Chromatin remodeling proteins utilize the energy from ATP hydrolysis to mobilize
                            Edited by:
         Veronica Martinez Cerdeño,
                                            nucleosomes often creating accessibility for transcription factors within gene regulatory
        University of California, Davis,    elements. Aberrant chromatin remodeling has diverse effects on neuroprogenitor
                        United States
                                            homeostasis altering progenitor competence, proliferation, survival, or cell fate. Previous
                    Reviewed by:
                                            work has shown that inactivation of the ISWI genes, Smarca5 (encoding Snf2h) and
              Mitsuhiro Hashimoto,
 Fukushima Medical University, Japan        Smarca1 (encoding Snf2l) have dramatic effects on brain development. Smarca5
                     Koji Shibasaki,        conditional knockout mice have reduced progenitor expansion and severe forebrain
         Nagasaki University, Japan
                                            hypoplasia, with a similar effect on the postnatal growth of the cerebellum. In contrast,
                  *Correspondence:
                     David J. Picketts
                                            Smarca1 mutants exhibited enlarged forebrains with delayed progenitor differentiation
                    dpicketts@ohri.ca       and increased neuronal output. Here, we utilized cerebellar granule neuron precursor
                                            (GNP) cultures from Smarca1 mutant mice (Ex6DEL) to explore the requirement for Snf2l
                   Specialty section:
                                            on progenitor homeostasis. The Ex6DEL GNPs showed delayed differentiation upon
         This article was submitted to      plating that was not attributed to changes in the Sonic Hedgehog pathway but was
    Neuroplasticity and Development,
                                            associated with overexpression of numerous positive effectors of proliferation, including
                a section of the journal
  Frontiers in Molecular Neuroscience       targets of Wnt activation. Transcriptome analysis identified increased expression of
           Received: 13 March 2021          Fosb and Fosl2 while ATACseq experiments identified a large increase in chromatin
            Accepted: 10 June 2021          accessibility at promoters many enriched for Fos/Jun binding sites. Nonetheless,
            Published: 06 July 2021
                                            the elevated proliferation index was transient and the Ex6DEL cultures initiated
                             Citation:
               Goodwin LR, Zapata G,
                                            differentiation with a high concordance in gene expression changes to the wild type
           Timpano S, Marenger J and        cultures. Genes specific to Ex6DEL differentiation were associated with an increased
   Picketts DJ (2021) Impaired SNF2L
                                            activation of the ERK signaling pathway. Taken together, this data provides the first
      Chromatin Remodeling Prolongs
   Accessibility at Promoters Enriched      indication of how Smarca1 mutations alter progenitor cell homeostasis and contribute
 for Fos/Jun Binding Sites and Delays       to changes in brain size.
       Granule Neuron Differentiation.
     Front. Mol. Neurosci. 14:680280.       Keywords: SMARCA1, Snf2L, ISWI chromatin remodeler, cerebellar granule neuron progenitors, ATAC-seq,
     doi: 10.3389/fnmol.2021.680280         chromatin accessibility

Frontiers in Molecular Neuroscience | www.frontiersin.org                         1                                           July 2021 | Volume 14 | Article 680280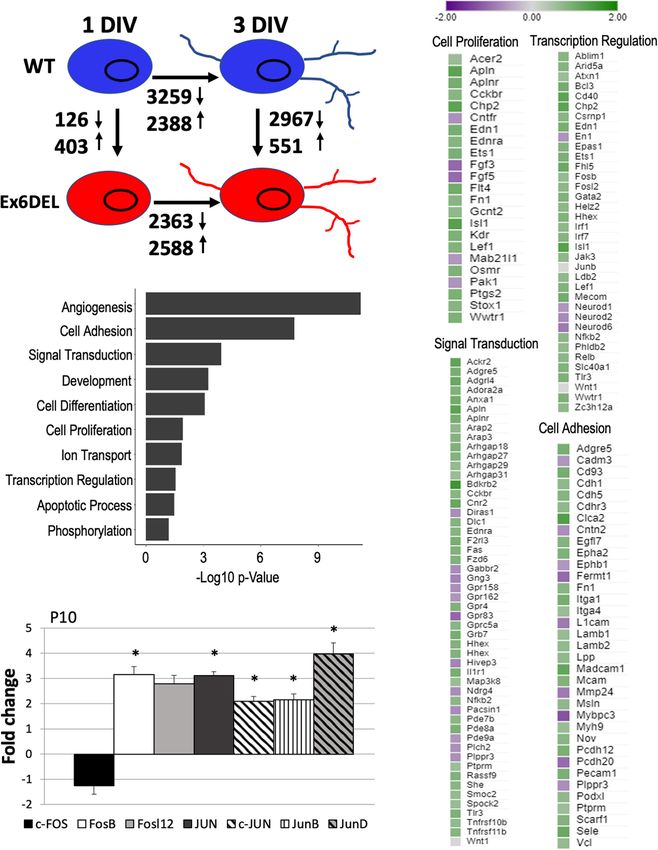
Goodwin et al.                                                                                                SNF2L Restricts Progenitor Competence

INTRODUCTION                                                                 maintenance and coordinate rRNA gene expression; functions
                                                                             not demonstrated for SNF2L complexes (as reviewed by Goodwin
Normal brain development requires the neural progenitors to                  and Picketts, 2018). However, distinct roles seem less clear
interpret external cues that are used to remodel their chromatin             when examining mouse models. The inactivation of Bptf, the
and modulate an intrinsic gene expression program that                       gene encoding the largest subunit of the Snf2l-containing
ultimately defines cellular competence, regulates proliferation,             NURF complex results in decreased progenitor self-renewal and
and/or initiates a cell fate lineage decision. Indeed, progenitor            impaired terminal differentiation in multiple cell types (Landry
cell homeostasis is a tightly regulated process that if perturbed            et al., 2008, 2011; Koludrovic et al., 2015; Frey et al., 2017).
can affect brain size, cellular fate and lamination, and/or cause            Similarly, inactivation of the Smarca5 gene resulted in reduced
neurodevelopmental disorders. The characterization of animal                 growth and pre-implantation lethality, while tissue specific-
models have shown that ablation of chromatin remodeling                      inactivation in the developing brain resulted in mice with a
factors significantly impact neurogenesis, while human genetic               striking cerebellar hypoplasia caused by a drastically reduced
studies have implicated them in numerous neurodevelopmental                  proportion of proliferating cells in the external granule cell
disorders (Bogershausen and Wollnik, 2018; Goodwin and                       layer (Stopka and Skoultchi, 2003; Alvarez-Saavedra et al., 2014).
Picketts, 2018; Sokpor et al., 2018; Timpano and Picketts, 2020).            Given that Snf2l is also expressed in the granule neurons of the
    Chromatin remodeling is catalyzed by conserved complexes                 cerebellum, it provides the opportunity to utilize granule neuron
containing a subunit with a SNF2-like helicase domain that binds             progenitor cultures to define whether Snf2h and Snf2l act with
and hydrolyzes ATP to reposition nucleosomes. These complexes                overlapping or separate functions in progenitor cell homeostasis.
can be subdivided into four classes, the switch/sucrose non-                     The development of the cerebellum is dependent on two
fermenting (SWI/SNF), imitation-switch (ISWI), chromodomain                  distinct progenitor populations, one located in the ventricular
helicase DNA binding (CHD), and inositol requiring 80-like                   zone (VZ) lining the fourth ventricle and one in the upper
(INO80) families based on extended homology within the ATPase                rhombic lip (Hatten and Heintz, 1995). The VZ progenitors give
domain and the inclusion of additional motifs that facilitate                rise to all the inhibitory neurons, including Purkinje neurons,
chromatin interactions (Clapier et al., 2017). The mammalian                 while some of these Nestin-expressing progenitors migrate to the
ISWI family comprises the closely related SMARCA1 and                        external granule layer (EGL) to produce Bergmann glia (Hatten
SMARCA5 genes that are orthologs of the Drosophila ISWI                      and Heintz, 1995; Hoshino et al., 2005). The progenitors from
gene and encode the SNF2L and SNF2H proteins, respectively.                  the rhombic lip give rise to all excitatory neurons including
The mammalian ISWI proteins form heterodimers comprised of                   those that form the deep cerebellar nuclei and the population of
either SNF2H or SNF2L and, most often, a BAZ (bromodomain                    granule neuron precursors (GNPs) that migrate to the EGL where
adjacent to zinc finger) gene family member (Goodwin and                     they proliferate extensively in the postnatal period to produce
Picketts, 2018). Seven complexes have been purified including                granule neurons and promote folia growth (Hatten and Heintz,
the NURF (Nucleosome remodeling factor), ACF (ATP-utilizing                  1995; Alder et al., 1996; Machold and Fishell, 2005). Smarca5 is
chromatin assembly factor) and CHRAC (chromatin assembly                     expressed robustly in the rhombic lip and the VZ in the embryo
complex) complexes that are highly conserved across species                  but it only seems to affect GNP expansion as normal numbers of
(Tsukiyama and Wu, 1995; Ito et al., 1997; Varga-Weisz et al.,               Purkinje neurons were detected in the hypoplastic cerebellum of
1997). In addition, four novel complexes have been purified from             Smarca5 cKO mice (Alvarez-Saavedra et al., 2014). In contrast,
mammalian cells, namely the WICH (WSTF-ISWI chromatin                        Smarca1 showed very weak expression in the VZ and rhombic lip
remodeling complex), CERF (CECR2-containing remodeling                       appearing more prevalently after birth in differentiating granule
factor), RSF (remodeling and spacing factor), and NoRC                       neurons (Alvarez-Saavedra et al., 2014). In the cerebral cortex,
(Nucleolar remodeling complex) complexes (LeRoy et al., 1998;                mice with a targeted deletion of exon 6 of the Smarca1 gene
Strohner et al., 2001; Bozhenok et al., 2002; Banting et al., 2005).         (Ex6DEL mice) that encodes the ATP-binding pocket resulted
While it was originally reported that five complexes contained               in increased proliferation of intermediate progenitor cells (IPCs)
SNF2H (ACF, CHRAC, NoRC, RSF, WICH) and two comprised                        that delayed differentiation and gave rise to animals with a
SNF2L (CERF, NURF), a recent study has suggested that SNF2H                  larger brain (Yip et al., 2012). These studies suggest that the
and SNF2L are interchangeable within all seven complexes and                 ISWI proteins Snf2h and Snf2l play distinct and critical roles
identified a novel eighth complex containing the protein BAZ2A               in regulating the transition of a proliferating progenitor to a
(Oppikofer et al., 2017). However, most genetic and biochemical              differentiated neuron.
data indicate that Smarca1 and Smarca5 have non-redundant                        The aim of the current study was to determine the effects
functions, as described below.                                               of Smarca1 loss on GNP proliferation and granule neuron
    The ISWI proteins remodel and space nucleosome arrays                    differentiation in the developing cerebellum. Moreover, we
in vitro albeit with different affinities (Corona et al., 1999; Langst       sought to utilize primary GNP cultures to assess the global
et al., 1999; Tang et al., 2004; Leonard and Narlikar, 2015; Clapier         changes to the chromatin landscape and transcriptome as
et al., 2017), and have different effects on the positioning of              a means to define the underlying function of Snf2l during
nucleosomes at transcriptional start sites (TSS) and at CTCF and             neurogenesis. In this way, we established that GNPs require
other transcription factor binding sites (Qiu et al., 2015; Kwon             Snf2l to limit chromatin accessibility at key TSS to promote
et al., 2016; Wiechens et al., 2016). Moreover, SNF2H containing             differentiation. Cultures from the Ex6DEL mice showed an
complexes facilitate DNA repair, regulate heterochromatin                    enrichment of chromatin accessibility, particularly at the

Frontiers in Molecular Neuroscience | www.frontiersin.org                2                                      July 2021 | Volume 14 | Article 680280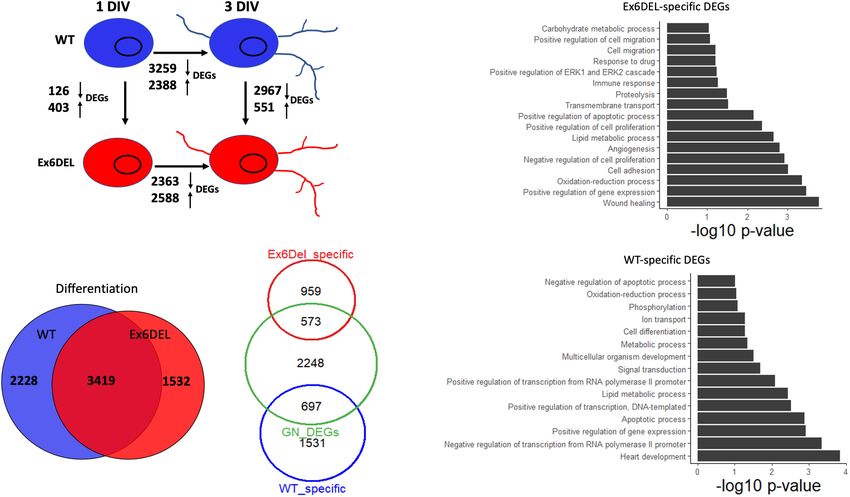
Goodwin et al.                                                                                                SNF2L Restricts Progenitor Competence

TSS of genes containing Fos/Jun binding sites that delayed                  directly to the culture for 2 h. For BrdU immunodetection, cells
differentiation. Despite the delay in differentiation the Ex6DEL            were fixed (2% PFA, 10 min, RT) and permeabilized (PBS with
cells utilized a similar genetic program to differentiate that was          0.03% triton-X 100, 10 min at RT) and then were subjected to
characterized by increased activation of the ERK pathway.                   a DNA hydrolysis incubation (2.5 N HCl, 10 min, RT) prior
                                                                            to immunostaining. For immunostaining, cells were fixed to
                                                                            coverslips and permeabilized as described above. Cells were
MATERIALS AND METHODS                                                       blocked in 10% horse serum (Life Technologies, cat # 26050-088)
                                                                            in TBST with BSA for 1 hr at RT. Primary antibodies rabbit anti-
Animal Work                                                                 NF200 (1:500, Sigma, N4142); rabbit anti-Ki67 (1:500, Abcam,
The Smarca1 gene resides on the X chromosome and the                        ab16667); mouse anti-BrdU (1:500, BD Bioscience, 347580);
generation of the Smarca1Ex6DEL/Y male mice have been                       or rabbit anti-GFAP (1:500, Stem Cell Technologies, 01415)
described previously (Yip et al., 2012). Animals were maintained            were diluted 1:500 in blocking solution and incubated on the
on an FVB/N background and housed in an animal facility under               coverslips overnight at 4◦ C. Secondary Alexa Fluor (JacksonR

SPF (specific pathogen-free) conditions on a 12/12 light:dark               Immunoresearch) antibody was diluted 1:4000 in PBS and
cycle with water and food ad libitum. All animal experiments                applied for 30 min RT prior to 5 min in a 1:10000 bis-benzimide-
were approved by the University of Ottawa’s Animal Care ethics              Hoescht 33342 (Sigma, United States, cat#B2261) solution in PBS.
committee, with the guidelines set out by the Canadian Council              Coverslips were mounted onto slides with mounting medium
on Animal Care. Smarca1Ex6DEL/+ female mice were bred with                  (Agilent Technologies, cat # S3023). Coverslips were imaged
wild-type males and pups were harvested between 4 and 6 days                with an Axio Imager M1 microscope (Zeiss) using either 20X
after birth for GNP isolation, or at postnatal day 10 (P10)                 or 40X objectives. Images (6 per time point for each replicate)
for RNA isolation.                                                          were prepared with Fiji software1 (version 2.0.0). All BrdU-
                                                                            positive cell counts were performed relative to DAPI-labeled
GNP Cultures                                                                nuclei and statistically analyzed by two-way ANOVA from 3-
GNPs were isolated from the cerebella of postnatal day (P)4-P6              replicate experiments using Excel software. Statistical significance
pups as previously described by Lee et al. (2009). To increase GNP          was assumed when the p-value was less than 0.05. p-values were
culture purity, GNPs were passed through a 60–35% Percoll step              annotated on the figures as follows: ∗ p < 0.05; ∗∗ p < 0.01;
gradient (Sigma, cat # P4937), wherein GNPs settled at the 35–              ∗∗∗ p < 0.001.
60% interphase. Cells were plated in serum-free NeurobasalTM -
A medium with B-27 supplement (Thermo Scientific, cat #                     Immunoblotting
0080085-SA) at a density of 5.5 × 10⁵ cells/well of a 24 well               Cerebellar extracts were quickly dissected from individual pups
plate coated with 1 mg/ml Poly-D-lysine hydrobromide (Sigma,                and then homogenized in ice-cold lysis buffer supplemented with
cat # P6407). A partial media change was performed within                   protease inhibitor cocktail (Sigma, United States; P8340) and
a day of isolation and repeated every 48 h. GNP viability                   phosphatase inhibitor cocktail (Fisher, cat # 78441), and then
was assessed using the Beckman Coulter Vi-CELLTM XR Cell                    incubated for 10 min at 4◦ C with gentle mixing. Cultured GNP
Viability Analyzer default cell counting system (cell size 5–               cell lysates were prepared similarly following resuspension in PBS
50 µM). Cell viability was assessed by trypan blue dye exclusion            with a cell scraper. After pre-clearing by centrifugation (5 min at
method.                                                                     17,000 × g), proteins were quantified by the Bradford method
    Genotyping was performed on genomic DNA from freshly                    (BioRad, cat # 500-00006). Protein samples were resolved on
isolated GNP cultures after dissection under the following PCR              sodium dodecyl sulfate polyacrylamide gels under denaturing
conditions: a denaturing cycle at 94◦ C for 2 min, 39 PCR cycles            conditions or using Bis-Tris 4–12% gradient gels (NuPage,
(94◦ C for 30 s, 60◦ C for 30 s, 72◦ C for 45 s) and a final cycle at       Invitrogen, United States; cat # NP0007) and blotted onto PVDF
72◦ C for 10 min. A three primer system was used for genotyping             membranes (BioRad, cat # 162-0177) by wet transfer for 1 hr
with two primers located in the introns flanking exon 6                     at 90V. Membranes were blocked (45 min, room temperature)
(Smarca1Intron5For: 50 -CCTGGGCTGGAACCATGATC-30 and                         with 5% skim milk in TBST and incubated (4◦ C, overnight) in
Smarca1Intron6Rev: 50 -GTATGGACAAGTGTGTGAAGCC-30 )                          primary antibody [rabbit anti-Snf2l (1:2000, Abcam, ab37003);
and a third primer located within Exon 6 (Smarca1Exon6Rev:                  rabbit anti-Snf2h (1:2000, Abcam, ab72499); rabbit anti-vinculin
50 -CCATGTGGGGTCCAGGAATG-30 ). PCR conditions result                        (1:2000, Abcam, ab129002); rabbit anti-Ki67 (1:2000, Abcam,
in the amplification of only the smaller WT product of 509 bp               ab16667); mouse anti-NeuN (1:2000, Millipore, MAB377);
(Intron5-Exon6; the larger 1108 bp Intron5-Intron6 product is               mouse anti-Tuj1 (1:2000, Stem Cell Technologies, 01409);
undetectable). The Ex6DEL product is 450 bp and the PCR                     rabbit anti-CECR2 (1:1000; gift from Dr. Heather McDermid,
reactions were electrophoresed on a 1.5–2% agarose gel for                  uAlberta); rabbit anti-ERK (1:2000, Santa Cruz, sc154); or
genotype analysis.                                                          mouse anti-pERK (1:500, Santa Cruz, sc7383)]. Membranes were
                                                                            incubated (1 h, RT) with ImmunoPure HRP-conjugated goat
                                                                                                                        R

BrdU-Pulse Labeling and                                                     anti-rabbit or goat anti-mouse IgG (H + L) secondary antibodies
Immunostaining                                                              (1:25000; Pierce, Rockford, IL, United States). Membranes were
Granule neuron precursors cultured on coverslips (n = 4) were
pulse labeled by adding BrdU (50 µM; Sigma, cat # B-5002)                   1
                                                                                http://gtrd.biouml.org/#!

Frontiers in Molecular Neuroscience | www.frontiersin.org               3                                       July 2021 | Volume 14 | Article 680280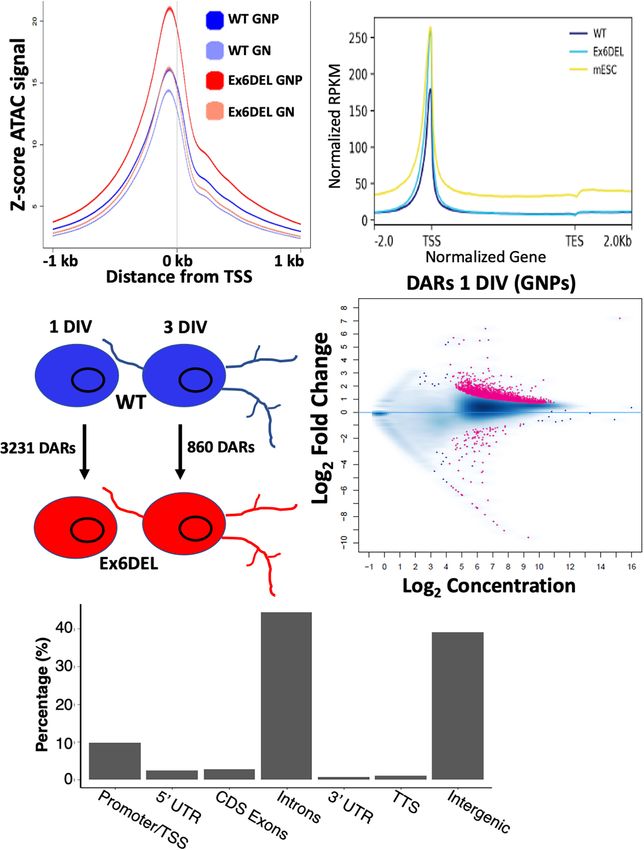
Goodwin et al.                                                                                                       SNF2L Restricts Progenitor Competence

washed 3 × 10 min in TBST after antibody incubations, and the               TABLE 1 | List of qPCR primers used for validation of differential gene expression.
signal was detected using the Pierce Supersignal West Fempto
                                                                            BDNF                               F: 50 -AGCCTCCTCTTCTCTTTCTGCTGGA-30
chemiluminescence substrate (ThermoFisher Scientific, cat #                                                    R: 50 -CTTTTGTTGTCTATGCCCCTGCCTT-30
34095). At least 2 separate Western blots were quantified using             Sox2                               F: 50 -TGCTCAAGATCAAATGGC-30 R:
ImageJ software for quantitation (Schneider et al., 2012).                                                     50 -GGACTTTTGACCCAGTG-30
                                                                            TH                                 F: 50 -TCCCCAAGGTTCATTGGACG-30 R:
Co-immunoprecipitation (co-IP)                                                                                 50 -GGTACCCTATGCATTTAGCT-30
Each co-IP was prepared with 500 µg of P21 cerebellar protein               c-Fos                              F: 50 -GGGGACAGCCTTTCCTACTA-30 R:
lysate (described above), 1 µg antibody, protease inhibitors and                                               50 -CTGTCACCGTGGGGATAAAG-30

lysis buffer to bring the final co-IP volume to 500 µL, which               FosB                               F: 50 -AAGTGTGCTGTGGAGTTC-30 R:
                                                                                                               50 -ATGTTGGAAGTGGTCGA-30
was then rocked overnight at 4◦ C. Protein A/G magnetic beads
                                                                            Fosl2                              F: 50 -CCAGCAGAAGTTCCGGGTAG-30 R:
(Bioclone Inc, #MA-102) was rinsed twice on a magnetized                                                       50 -GTAGGGATGTGAGCGTGGATA-30
stand (Thermo Fisher) with two volumes of non-denaturing lysis              JunB                               F: 50 -TCACGACGACTCTTACGCAG-30 R:
buffer. Thirty µL bead slurry was then added to each co-IP                                                     50 -CCTTGAGACCCCGATAGGGA-30
reaction for capture on a rocking platform at 4◦ C for 1 h. Beads           Jun                                F: 50 -CCTTCTACGACGATGCCCTC-30 R:
were washed 5 times in 1 mL 0.3% triton-X in PBS, with each                                                    50 -GGTTCAAGGTCATGCTCTGTTT-30
wash being performed on a rocking platform at 4◦ C for 5 min.               c-Jun                              F: 50 -ACGACCTTCTACGACGATGC-30 R:
Beads were resuspended in 0.1M glycine (pH 2.5) elution buffer                                                 50 -CCAGGTTCAAGGTCATGCTC-30
and incubated for 10 min RT prior to recovering eluate. Elution             JunD                               F: 50 -CCAGGTTCAAGGTCATGCTC-30 R:
                                                                                                               50 -AGCCCGTTGGACTGGATGA-30
was repeated 3 additional times. Samples were prepared in 1:3
                                                                            Ets-1                              F: 50 -AAAGAGTGCTTCCTCGAGCT-30 R:
in 1X NuPAGE LDS Sample Buffer and 1.5% β-mercaptoethanol
                                                                                                               50 -AGGCTGTTGAAGGATGACTG-30
(Sigma, #M7522) prior to immunoblotting.
                                                                            Edn-1                              F: 50 -TTTTTCCCCACTCTTCTGACCC-30 R:
                                                                                                               50 -AGTCCATACGGTACGACG-30
qRT-PCR                                                                     Ednra                              F: 50 -CAACTGTGTCTAGGAGGTGGGG-30 R:
RNA was isolated from P10 cerebella or cultured GNPs using                                                     50 -ATGGTCAGCCAAAAGTATGCCG-30
TRIzol Reagent (Life Technologies, #15596018) according to                  Ednrb                              F: 50 -TTGCTCGCAGAGGACTGGCCA-30 R:
manufacturer’s instructions. RNA was purified using DNA-                                                       50 -AAGCATGCAGACCCTTAGGGG-30
free kit (ThermoFisher Scientific, AM1906) according to the                 Fgf-3                              F: 50 -TCCACAAACTCACACTCTGC-30 R:
manufacturer’s instructions. Complementary DNA (cDNA) was                                                      50 -GAACAGCGCCTATAGCATCC-30

generated with the RevertAid First Strand cDNA Synthesis Kit                Fgf-5                              F: 50 -AACTCCTCGTATTCCTACAATCC-30 R:
                                                                                                               50 -CGGATGGCAAAGTCAATGG-30
(Thermo Fisher, #K1621) and was carried out in a thermocycler
                                                                            18S                                F: 50 -TGTCTCAAAGATTAAGCCATGC-30 R:
for 5 min at 25◦ C, 1 h at 42◦ C followed by 5 min at 70◦ C.                                                   50 -GCGACCAAAGAAACCATAAC-30
qPCR reactions were prepared by mixing 10 µL Lo-ROX 2X                      Gapdh                              F: 50 -ATCCACGACGGACACATTGG-30 R: 50
SYBR Master Mix (FroggaBio Inc, #BIO-94020) with 0.5 µM                                                        -CAACGACCCCTTCATTGACCTC-30
of primers and 200 ng of cDNA. Primer used in this study
are listed in Table 1. All reactions were performed in technical
triplicates. qPCR was carried out on MicroAmp Fast Optical  R
                                                                            0.11.5). Reads were pseudoaligned to GRCm38 (release 88)
96-well Reaction Plate (Life Technologies, #4346906) and run                by kallisto (version 0.44.0; bootstraps = 50) and quantified
on 7500 Applied Biosystems Fast Real-Time PCR System [95◦ C
                                    R
                                                                            with Sleuth (version 0.29.0). Differentially expressed genes
5 min, 40 cycles (95◦ C for 5 s, 60◦ C for 15 s, 72◦ C for 20 s), and       (DEGs) set a fold-change threshold of ±1.5 with qval ≤0.05.
72◦ C for 5 min]. Relative fold change was normalized using two             Heatmaps were generated with pheatmap (version 1.0.10)
controls (18S rRNA and GAPDH) and calculated using 11Ct                     and RColorBrewer (version 1.1-2). Gene Ontology (GO)
method. Statistical significance was determined using Student’s             enrichment analysis2 established enriched biological process
t-test.                                                                     terms (significant enrichment set at fold enrichment ≥ 1.5
                                                                            and FDR ≤ 0.05). oPOSSUM was used to identify the
RNA-seq Analysis                                                            transcription factor binding sites within promoter sequences of
RNA was isolated from GNPs (∼3 × 10⁶ cells) using TRIzol                    the differentially expressed genes (Kwon et al., 2012). RNA-seq
(Life Technologies, #15596018) according to manufacturer’s                  data was deposited into the GEO database with the accession
instructions. RNA cleanup was performed with PureLink                       number GSE122173.
RNA Mini Kit (Thermo Fisher, #12183020) with in-column
DNaseI digestion (Thermo Fisher, AM1906). RNA samples                       ATAC-seq Sample Preparation
(n = 3) were sequenced at GenomeQuébec (Montréal). RNA                      Samples from WT and Ex6DEL GNP cultures [1 days in vitro
integrity was confirmed upon arrival by Bioanalyzer prior                   (DIV) and 3DIV; n = 2] were prepared according to Buenrostro
to cDNA library generation. Paired RNA-seq was performed                    et al. (2013, 2015) with modification in transposase reaction
on HiSeq4000 PE 100 bp lane and a minimum of 35                             conditions. Briefly, 50,000 cells were pelleted, resuspended in
million reads was obtained per sample. Quality control (QC)
on raw.fastq files was carried out with FastQC (version                     2
                                                                                http://www.geneontology.org/

Frontiers in Molecular Neuroscience | www.frontiersin.org               4                                               July 2021 | Volume 14 | Article 680280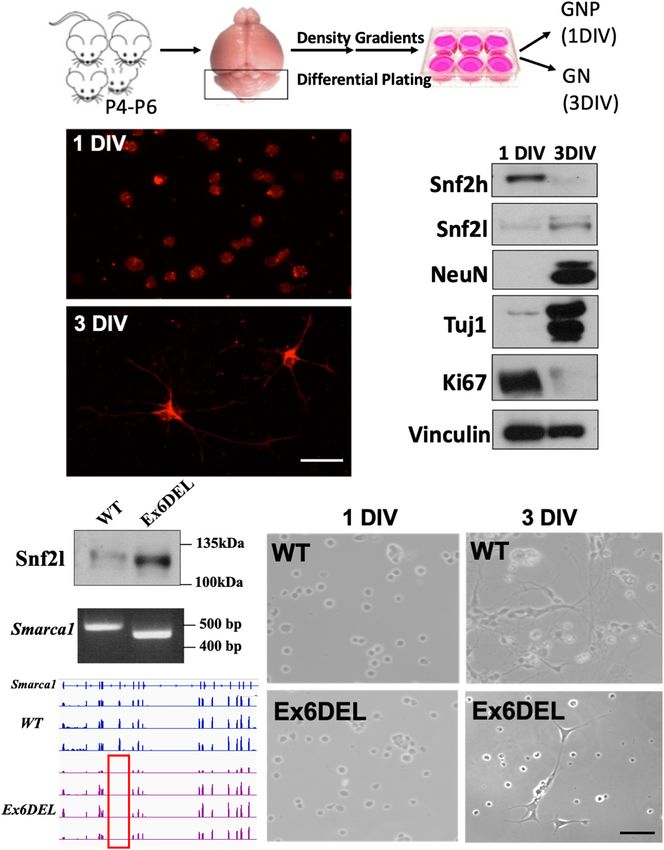
Goodwin et al.                                                                                             SNF2L Restricts Progenitor Competence

50 µL lysis buffer and centrifuged (500 × g for 10 min at                 RESULTS
4◦ C). Transposition mix was prepared by combining 25 µL
Nextera TD 2X reaction buffer and 5 µL Nextera TDE1 Tn5                   During forebrain development, the ISWI homologs Smarca5
Transposase (Illumina, #FC-121- 1030) to 20 µL nuclease free              and Smarca1 (encoding Snf2h and Snf2l proteins, respectively)
H2O. Nuclei pellet was resuspended in transposition mix and               play essential non-redundant roles. When Smarca5 is inactivated
incubated for 40 min at 37◦ C. Transposed DNA was purified                progenitor expansion is compromised leading to cortical
and eluted using Qiagen MinElute PCR Purification Kit (Qiagen,            hypoplasia (Alvarez-Saavedra et al., 2019). In contrast, the
#28004). The PCR reaction was prepared with 10 µL eluted                  Ex6DEL mice, containing an internal deletion in the Smarca1
tagmented DNA, 10 µL nuclease-free H2O, 2.5 µL 25 µM ATAC                 gene and lacking a functional Snf2l protein present with an
PCR primers and 2X NEBNext High-Fidelity 2X PCR master mix                enlarged brain due to hyperproliferation of the IPCs (Yip et al.,
(New England Biolabs, #M0541S). Amplification and qPCR side               2012). Taken together, this data suggests that Snf2l and Snf2h
reaction was carried out as previously described by Buenrostro            have differential effects on progenitor cell homeostasis. Smarca5
et al. (2013, 2015). The amplified library was cleaned with Qiagen        and Smarca1 are both expressed in the developing postnatal
MinElute PCR Purification Kit and verified by Bioanalyzer prior           cerebellum, with the early loss of expression of Smarca5 causing
to sequencing (Stemcore, Ottawa Hospital Research Institute).             a severe reduction in cerebellar granule neuron progenitor
Sequencing was performed with Illumina NextSeq500 (PE 75 bp)              expansion and cerebellar growth (Alvarez-Saavedra et al., 2014).
and an average of 100 million reads were obtained per sample              To determine whether the ISWI proteins have antagonistic
(Stemcore, Ottawa Hospital Research Institute).                           roles in the cerebellum, we isolated primary cultures of GNPs
                                                                          from WT and Ex6DEL mice to study the role of the Snf2l
ATAC-seq Analysis                                                         protein (Figure 1A; Oliver et al., 2005; Bassett et al., 2016).
                                                                          Freshly isolated GNPs from WT spontaneously differentiate over
Quality control on raw fastq files was carried out with FastQC
                                                                          3 days in culture into granule neurons (GNs) in the absence of
(version 0.11.6). Adapters were trimmed using atactk (version
                                                                          Sonic hedgehog protein (Shh) or agonist (Wechsler-Reya and
0.1.5) and aligned to mm10 with Bowtie 2 (version 2.3.4).
                                                                          Scott, 1999). The GNP cultures had a high level of purity as
Duplicates were removed with Picard tools (version 2.17.0)
                                                                          we observed < 5% of cells positive for glial acidic fibrillary
and peaks were called using macs2 –shift −100, –ext size
                                                                          protein (GFAP; Supplementary Figure 1A). Immunostaining for
200 in –broad mode (qval < 0.1). BigWig files were prepared
                                                                          neurofilament 200 (NF200) of the GNPs from WT suggested a
for visualization with deepTools2 bamCoverage command and
                                                                          neuronal identity and, by 3 DIV, highlighted the growth of neurite
normalized to reads per kilobase per million mapped reads
                                                                          extensions (Figure 1B) that were also readily visible by phase-
(RPKM) and visualized with IGV (Thorvaldsdottir et al., 2013).
                                                                          contrast microscopy (WT, Figure 1E). Immunoblot analysis at 1
DeepTools2 was used to plot read abundance over scaled gene
                                                                          DIV and at 3 DIV from WT GNP cultures indicated that Snf2l
and accessibility heatmaps (Ramirez et al., 2016). Differentially
                                                                          protein levels increased 3.6-fold with differentiation while Snf2h
accessible regions (DARs) were established from consensus peaks
                                                                          protein levels decreased by 11-fold (Figure 1C), consistent with
of merged replicates without summits with DiffBind (version
                                                                          our observations in murine cerebellar extracts (Alvarez-Saavedra
2.8.0; Ross-Innes et al., 2012). Distribution over genomic features
                                                                          et al., 2014). The WT cells were also immunoblotted for two pan-
was plotted with ChIPpeakAnno (version 3.14.0; Zhu et al.,
                                                                          neuronal markers (NeuN, Tuj1) and a protein characteristic of
2010). ATACseqQC (version 1.2.9; Ou et al., 2018) was used to
                                                                          cycling cells (Ki67). These blots indicated that GNPs of WT had
separate reads based on length. HOMER was used to annotate
                                                                          exited the cell cycle and obtained neuronal identity by 3 DIV
peaks, as well as to identify and quantify differential motif
                                                                          (Figure 1C). Next, we isolated GNPs from the Ex6DEL mice to
binding sites on accessible peaks (Heinz et al., 2010). SeqPlots
                                                                          compare their differentiation properties. Immunoblot and PCR
was used to quantify and compare accessible TSS (Stempor and
                                                                          genotyping analysis (WT band 508 bp; Ex6DEL band 450 bp)
Ahringer, 2016). mESC E14 merged control ATACseq dataset
                                                                          confirmed that the cells were deleted for exon 6 and expressed the
(GEO number GSE98390) was retrieved and analyzed similarly
                                                                          internally truncated Snf2l protein (WT protein 122 kDa; Ex6DEL
using deepTools2. DAVID was used to identify the biological
                                                                          protein 115 kDa; Figure 1D). While the cultures were very similar
process, Gene Ontology (GO) functional annotation of ATAC
                                                                          at 1 DIV, we observed that the majority of the Ex6DEL GNPs had
peaks alongside the 0 and 72 h DEGs (Huang da et al., 2009).
                                                                          not extended neurites by 3 DIV (Figure 1E) despite insignificant
Dplyr3 , ggplot24 , and Vennerable5 were then used to organize
                                                                          differences in cell viability (Supplementary Figure 1B).
and plot results in R (RStudio Team., 2020). Gene Transcription
Regulation Database (GRTD) was used to identify the overlap
of Fos/Jun/AP-1 binding sites between the DAR and DEG list                Ex6DEL GNP Cultures Show Delayed
of the granule neuron progenitor cell population5 . The ATAC-
seq data was deposited into the GEO database with the accession
                                                                          Differentiation Upon Plating
number GSE122172.                                                         Within the developing forebrain of Ex6DEL mice we had
                                                                          previously demonstrated that an increased proportion of IPCs
                                                                          underwent self-renewal and that this in turn delayed cell
3
  https://dplyr.tidyverse.org//                                           differentiation (Yip et al., 2012). To assess whether GNPs had a
4
  https://ggplot2.tidyverse.org                                           similar fate, we initially immunostained 1 and 3 DIV cultures
5
  https://github.com/js229/Vennerable                                     for Ki67 (Supplementary Figure 2A). GNPs require Shh as a

Frontiers in Molecular Neuroscience | www.frontiersin.org             5                                      July 2021 | Volume 14 | Article 680280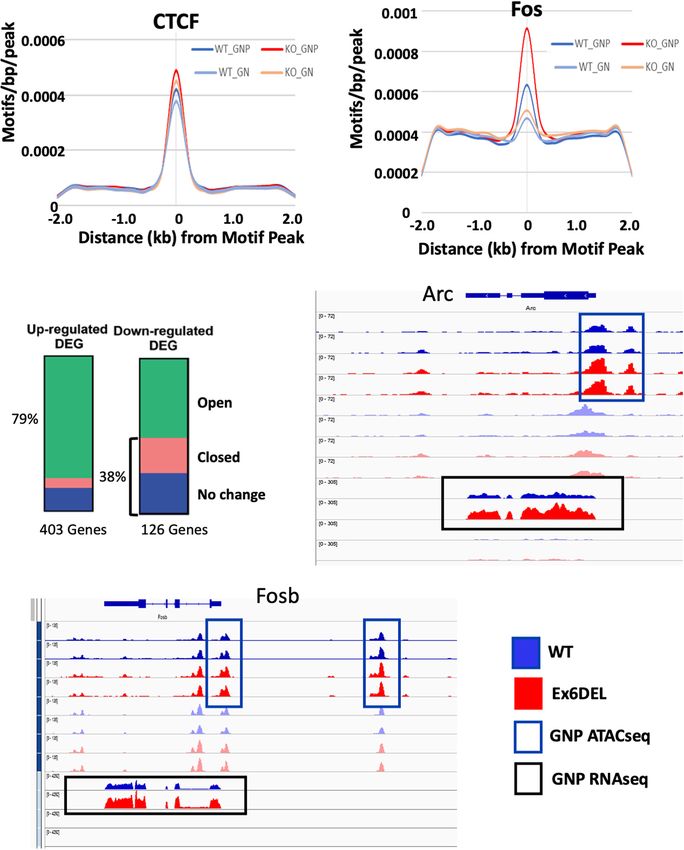
Goodwin et al.                                                                                                                 SNF2L Restricts Progenitor Competence

  FIGURE 1 | Generation of GNP cultures from the Ex6DEL mice. (A) Schematic diagram of the procedure for generating GNP and granule neuron cultures.
  (B) Representative images of WT cultures 1 DIV (top image) and 3 DIV (bottom image) stained with neurofilament-200 (red). Scale bar, 25 µM. (C) Protein extracts of
  primary GNP cultures at I and 3 DIV were immunoblotted for the ISWI proteins (Snf2h, Snf2l), neuronal (Tuj, NeuN) and proliferation (Ki67) markers. Vinculin was used
  as a loading control. (D) Immunoblot (top panel), Smarca1 genotyping (middle panel), and RNAseq analysis (bottom panel) from WT and Ex6DEL GNP cultures
  confirmed the loss of exon 6 in the GNP cultures isolated from Ex6DEL mice. The red rectangle outlines the absence of RNAseq reads corresponding to the position
  of exon 6. (E) Phase contrast images of GNP cultures from WT and Ex6DEL mice. Scale bar, 50 µM.

growth mitogen which is released from Purkinje neurons, and                            was delayed. As such, we incubated GNP cultures with BrdU 2 h
since it is not present in the culture media the GNPs typically                        before harvesting them at 2 h, 1 DIV, 2 DIV, and 3 DIV after
complete a final mitotic cycle and initiate differentiation upon                       plating to quantify the proportion of cells in S-phase as a second
plating (Wechsler-Reya and Scott, 1999). At 1 DIV, Ki67+ cells                         measure of cell proliferation (four independent experiments per
were present in both WT GNP and Ex6DEL GNP cultures but                                timepoint analyzed, five images quantified per coverslip). As
Ki67+ cells were only detected in the Ex6DEL GNP cultures at                           expected, the short BrdU pulse labeled 25–30% of cells at 2 h
3 DIV (Supplementary Figure 2A) suggesting that cell cycle exit                        and incorporation of BrdU decreased in the GNPs from WT

Frontiers in Molecular Neuroscience | www.frontiersin.org                          6                                              July 2021 | Volume 14 | Article 680280
Goodwin et al. SNF2L Restricts Progenitor Competence
to less than 10% after 1 DIV (Figure 2A). In contrast, BrdU and cell proliferation (Figure 3B). The specific gene changes
incorporation in the GNPs from Ex6DEL mice remained at or we observed that are associated with these four GO terms are
above 25% at the 1 DIV and 2 DIV timepoints before dropping highlighted in Figure 3C. It is well known that Shh signaling
below 10% at 3 DIV (Figure 2A). This suggests that the Ex6DEL mediates GNP proliferation (Wechsler-Reya and Scott, 1999),
GNPs are delayed in their ability to exit the cell cycle, which but we did not observe any changes at 1 DIV to the pathway
is consistent with what we observed in vivo in the developing components or downstream effectors (Gli1, N-Myc, Math1, or
forebrain of Ex6DEL mice (Yip et al., 2012). In the postnatal Ccnd1; Supplementary Table 1), except for an increase in Stox1
developing cerebellum, Pax6+ GNPs proliferate in the EGL then (Log2 FC = 0.80), a gene normally repressed by Shh signaling
the postmitotic granule neurons migrate through the molecular (Figure 3C). Of note, two members of the mitogenic fibroblast
layer to complete their maturation in the IGL. We reasoned growth factor family (Fgf3, Log2 FC = –1.04; Fgf5, Log2 FC = –
that the Ex6DEL cerebellum should contain fewer Pax6+ cells 1.02) were decreased in expression (Figure 3C). Despite the lack
migrating through the molecular layer at P10 if cell cycle exit of change in mitogenic pathways affecting GNP proliferation
was delayed. P10 cerebellar sections from WT and Ex6DEL mice (e.g., Shh and Fgf), we observed altered expression of many genes
were stained for Pax6 and the number of Pax6+ cells within the with known roles in cancer and the epithelial-to-mesenchyme
molecular layer was quantified. This experiment showed a 25% transition (e.g., Acer2, Log2 FC = 0.59; Apln, Log2 FC = 1.20; Chp2,
reduction in the number of migrating Pax6+ granule neurons Log2 FC = 1.21; Cntfr, Log2 FC = –0.66; Pak1, Log2 FC = −0.62;
in the molecular layer of Ex6DEL mice compared to WT mice and Wwtr1, Log2 FC = 0.89; Figure 3C). In addition, the Wnt
(Figures 2B,C). Taken together, these results suggest that Snf2l receptor Fzd6 was upregulated (Log2 FC = 0.84) as were multiple
is required for timely cell cycle exit that delayed but does not downstream targets of the WNT/β-catenin signaling pathway
impair granule neuron differentiation as indicated by NeuN (Flt4, Log2 FC = 1.00; Kdr, Log2 FC = 0.89; Lef1, Log2 FC = 0.84),
and Tuj1 staining in both GNP and cortical neuron cultures including endothelin 1 (Edn1, Log2 FC = 0.93) and its receptor
(Supplementary Figures 2B–D). (Ednra, Log2 FC = 0.79) (Figure 3C; Eckey et al., 2012; Katoh,
The removal of exon 6 maintains the Snf2l open reading frame 2018; Adams et al., 2020). The observation suggested that the
(ORF) resulting in an internally truncated protein that renders prolonged proliferative phenotype of the Ex6DEL GNP cultures
the enzyme unable to bind and hydrolyze ATP, thereby impairing could arise from activation of the Wnt signaling pathway or
chromatin remodeling activity (Yip et al., 2012). Nonetheless, it dysregulation of genes associated with cancer.
remains possible that the Ex6DEL Snf2l protein is incorporated Aside from the genes linked to the GO term Cell Proliferation,
into ISWI complexes such as CERF. These complexes may we examined our DEG list for changes in Wnt and β-catenin
then maintain their ability to bind chromatin without catalytic (Ctnnb1) gene expression but did not observe any changes
remodeling activity, which could contribute to the delayed suggesting that they are not direct transcriptional targets of
differentiation of the GNPs. To assess whether the truncated Snf2l Snf2l (Figure 3C and Supplementary Table 1). Comparison
protein in Ex6DEL mice can incorporate into an ISWI complex of our DEG list with known direct and indirect Wnt target
we performed co-immunoprecipitation (co-IP) experiments with genes from two sources (The Wnt Homepage; Boonekamp et al.,
CECR2, the partner protein associated with Snf2l in the CERF 2021) revealed increased expression in seven additional Wnt
complex and abundant in the cerebellum (Banting et al., 2005). target genes (Abcb1a, Log2 FC = 0.97; Neurod1, Log2 FC = –
Cerebellar lysates from WT and Ex6DEL mice isolated at P21 0.61; Ptgs2, Log2 FC = 0.89; Fn1, Log2 FC = 0.77; and Plaur,
were used for co-IP with anti-Snf2l and anti-Cecr2 antibodies. Log2 FC = 1.12; Abcc4, Log2 FC = 0.74; Nes, Log2 FC = 0.63)
As indicated in Figure 2D, we detected the intact CERF complex suggesting activation of the Wnt signaling cascade in Ex6DEL
in both WT and Ex6DEL lysates suggesting that the internally cultures. Moreover, several downstream signaling components of
truncated Snf2l protein was incorporated into the CERF complex. the Edn1/Ednra pathway showed increased expression including
Mapk15 (Log2 FC = 0.87), Map3k8 (Log2 FC = 0.61), and Fos
gene expression (Fosb, Log2 FC = 0.64; Fosl2, Log2 FC = 0.74)
Increased Proliferation Linked to suggesting further involvement of this effector pathway
Edn1/Ednra-MAPK-Fos/Jun Pathway (Supplementary Table 1). To assess the Edn1/Ednra-MAPK-
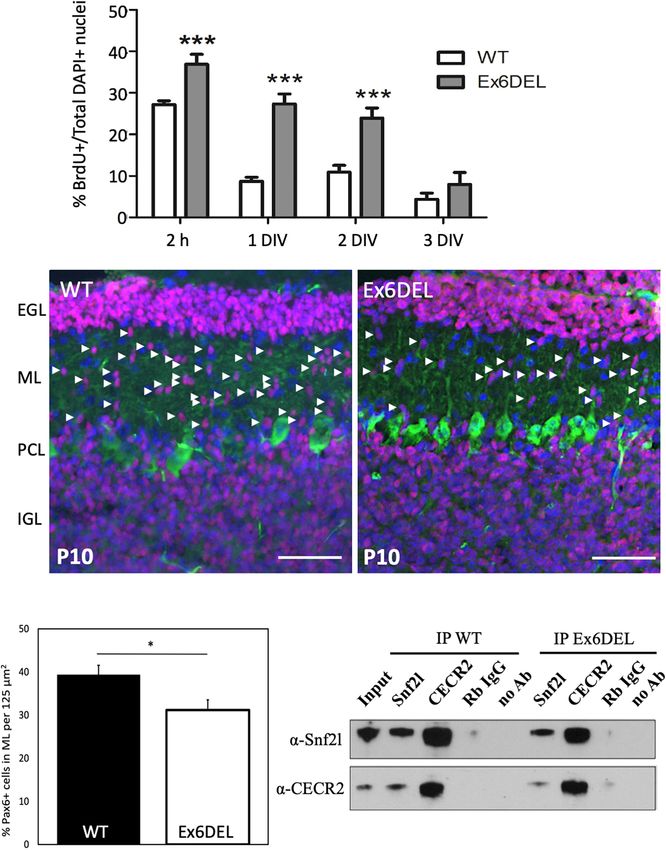
We next performed RNAseq analysis of WT and Ex6DEL Fos/Jun pathway in the Ex6DEL mice we first validated that Edn1
cerebellar GNP cultures (∼3 × 10⁶ cells) at 1 and 3 DIV and both receptors (Ednra and Ednrb) were upregulated in P10
to identify transcriptome differences that might contribute to cerebellum from mutant animals (Supplementary Figure 3A).
the delay in cell cycle exit and differentiation. At 1 DIV, we Similarly, we confirmed a ∼3-fold increase in expression of the
observed 126 downregulated and 403 upregulated genes in Fosb (FC = 3.16, p = 0.035) and Fosl2 (FC = 2.79, p = 0.39) genes,
Ex6DEL GNPs as compared with WT GNPs (log2 fold-change although Fosl2 did not reach statistical significance (Figure 3D)
threshold ± 0.5 with qval ≤ 0.05; Figure 3A and Supplementary in the Ex6DEL P10 cerebella, suggesting that the pathway was
Table 1). GO term analysis of the differentially expressed active both in vitro (isolated GNPs) and in vivo. However, in
genes (DEGs) indicated that angiogenesis was the biological the Ex6DEL mice we observed that the expression of Jun, Junb,
process with the most significant change (Figure 3B). It also and Jund were also upregulated in the cerebella, but this was not
highlighted a number of biological processes that could mediate observed in the Ex6DEL GNP cultures. Taken together, this data
GNP homeostasis and contribute to the delayed differentiation suggested that activation of Wnt signaling and dysregulation
including transcriptional regulation, cell signaling, cell adhesion, of the Edn1/Ednra-MAPK-Fos/Jun signaling pathway might be
Frontiers in Molecular Neuroscience | www.frontiersin.org 7 July 2021 | Volume 14 | Article 680280Goodwin et al. SNF2L Restricts Progenitor Competence FIGURE 2 | Ex6DEL cultures show delayed differentiation. (A) Graph depicting the fraction of BrdU + cells in WT (white bars) and Ex6DEL (gray bars) GNP cultures at the specified times. Cultures were pulsed with BrdU for 2 h prior to harvesting cells for analysis. (n = 4 independent experiments; five images per coverslip used for quantification). ***p < 0.001. (B) P10 cerebellar sections from WT and Ex6DEL mice stained for committed granule neurons (Pax6, magenta), Purkinje neurons (Calbindin, green) or all cell nuclei (DAPI, blue). Arrowheads indicate the migrating postmitotic granule neurons. EGL, external granule layer; ML, molecular layer; PCL, Purkinje cell layer; IGL, inner granule layer. Scale bar, 50 µM. (C) Plot of the percentage of Pax6+ cells within the ML. ∗ p < 0.05. (D) Immunoblot analysis of cerebellar extracts from WT and Ex6DEL mice co-immunoprecipitated for Snf2l, Cecr2, or a control rabbit antibody (Rb IgG). Frontiers in Molecular Neuroscience | www.frontiersin.org 8 July 2021 | Volume 14 | Article 680280
Goodwin et al.                                                                                                          SNF2L Restricts Progenitor Competence

  FIGURE 3 | RNAseq analysis of WT and Ex6DEL cultures. (A) Schematic diagram showing the numbers of differentially expressed genes (DEGs) between different
  samples (WT and Ex6DEL) and days in culture. (B) GO term analysis of the DEGs observed at 1 DIV. (C) DEG lists for some of the top GO terms. (D) RT-qPCR
  validation of Fos/Jun genes from RNA isolated from P10 cerebella. ∗ p < 0.05.

Frontiers in Molecular Neuroscience | www.frontiersin.org                      9                                           July 2021 | Volume 14 | Article 680280
Goodwin et al.                                                                                               SNF2L Restricts Progenitor Competence

a key contributor to the prolonged proliferation of the GNPs                determined. Nonetheless, an enrichment of 315 DARs was
isolated from the Ex6DEL mice.                                              observed at promoter/TSS regions, which were defined as
                                                                            peaks mapped between −1 kb and + 100 bp of a TSS
                                                                            (Figure 4E and Supplementary Table 1); a finding consistent
Increased Promoter Accessibility                                            with previous studies (Sala et al., 2011; Morris et al., 2014).
Associated With Fos/Jun Binding Sites                                       Since previous work has indicated that SNF2H and SNF2L
The Drosophila ISWI protein has been shown to bind near                     organize nucleosomes adjacent to transcription factor binding
promoters and affect nucleosome positioning adjacent to the                 sites (Wiechens et al., 2016), we examined the 315 promoter/TSS
transcription start site (TSS) of genes (Sala et al., 2011; Morris          DARs for enrichment of transcription factor binding sites. We
et al., 2014). In HeLa cells, both SNF2H and SNF2L were                     first examined CTCF since SNF2H but not SNF2L was required
important for organizing nucleosomes adjacent to transcription              to maintain CTCF occupancy at its binding sites (Wiechens et al.,
factor binding sites (Wiechens et al., 2016). As such, we                   2016). Similar to that study, we did not observe an enrichment
reasoned that loss of Snf2l remodeling activity in GNP cultures             in CTCF motifs in the promoter DARs (Figure 5A). However,
would alter the chromatin landscape, particularly at gene                   we did observe enrichment of 38 transcription factor motifs
regulatory regions. Since we were not able to confirm the                   including Fos-binding motifs (Figure 5B and Supplementary
validity of the commercial Snf2l antibodies for chromatin                   Table 1), which is interesting given the upregulation of Fosb
immunoprecipitation, it prompted us to employ ATAC-seq to                   and Fosl2 that we observed at the 1 DIV time point. Indeed,
map modifications in chromatin accessibility. ATAC-seq takes                97 of the 315 promoter DARs contained a Fos/Jun/AP-1
advantage of a hyperactive Tn5 transposase which can insert                 transcription factor binding site within the accessible region
itself and add sequencing primers to sufficiently accessible                (Supplementary Table 1).
DNA from nucleosome free regions (NFR) to polynucleosomes                       Next, we examined the frequency of DARs associated with
(Buenrostro et al., 2013, 2015). We performed ATAC-seq on                   the DEGs at 1 DIV. All DARs were linked to a gene based
WT and Ex6DEL GNPs (1 DIV) and GNs (3 DIV) and binned                       on map position to the nearest gene. Overall, 79% of the
reads according to size, categorizing them as either nucleosome-            upregulated genes contained an open DAR associated with
free (NFR), mono-, di-, or tri-nucleosome reads. Normalized                 them, although only 25 DEGs had a DAR located within the
accessibility of WT and Ex6DEL cultures aligned over an                     promoter/TSS region (Figure 5C and Supplementary Table 1).
averaged gene showed an increased number of reads at the                    Of the 25 genes with a promoter/TSS DAR, thirteen genes
TSS in Ex6DEL samples compared to WT cultures (Figure 4A),                  (Akap2, Arap2, Arc, Bhlhe40, Col4a2, Csrnp1, Emp1, Ets1,
most notably corresponding to NFR reads (both time points)                  Gcnt2, P2rx6, Wnt9a, Wwtr1, and Zc3h12a) also contained a
and for mono- and di-nucleosome reads at 1 DIV that suggests                Fos/Jun/AP-1 binding site and were increased in expression
there is increased accessibility and reduced nucleosome density             (Supplementary Table 1). These genes also contained binding
at the TSS (Supplementary Figure 3B). Progressive chromatin                 motifs for Mzf1, Klf4, and Sp1 transcription factors within the
condensation accompanies progenitor cell commitment toward                  promoter DAR (Supplementary Figure 5).
a specialized cell fate. The increased accessibility observed at the            Analysis of mapped IGV (integrated genome viewer) tracks
TSS in the Ex6DEL progenitors compared to the WT cultures                   showed a clear increase in ATAC peaks and RNAseq reads for
at 1 DIV led us to explore whether the Ex6DEL chromatin                     the 13 genes with a Fos/Jun binding site in the promoter/TSS
accessibility was similar to that of an earlier lineage cell type.          DAR, as shown for the Arc gene (Figure 5D; additional genes
To this end, we added a publicly available ATAC-seq E14 mouse               shown in Supplementary Figures 6A,B). However, Fosb and
embryonic stem cell (mESC) dataset (GEO GSE98390) to our                    Fosl2 upregulation was not associated with a promoter/TSS
analysis. Interestingly, the mESC ATAC-seq accessibility reads              DAR despite an apparent increase in chromatin accessibility
aligned most closely to those of the Ex6DEL GNPs (Figure 4B                 (Figure 5E and Supplementary Figure 6C). Similarly, the IGV
and Supplementary Figure 4).                                                tracks for Mapk15, Edn1 and Ednra showed increased expression
    We next compared the number of differentially accessible                in the Ex6DEL cultures but the increased chromatin accessibility
regions (DARs; FDR < 0.05) between WT and Ex6DEL cultures,                  at the promoter/TSS region did not reach the statistical threshold
identifying 3231 DARs at 1 DIV and 860 DARs at 3 DIV                        cutoff for a DAR (Supplementary Figures 6D–F). Taken
(Figure 4C). We focused on the large number of DARs at 1                    together, we observed a good correlation between increased
DIV to determine if these might contribute to the delay in                  chromatin accessibility and upregulated gene expression with a
cell differentiation that we observed in the Ex6DEL cultures.               subset of genes displaying Fos/Jun dysregulation.
Initially, we examined whether the DARs were associated with                    In contrast to the upregulated genes, 38% of the
an increase or a decrease in accessibility. We observed a                   downregulated DEGs were associated with a DAR that had
large increase in the number of accessible chromatin domains                reduced accessibility or showed no change in chromatin
(3118), while far fewer DARs (113) showed a reduced level                   accessibility (Figure 5C). In addition, for genes that showed
of accessibility within the Ex6DEL cultures compared to the                 reduced accessibility we did not observe any overlap with the
WT cultures (Figure 4D). Overall, the distribution of DARs                  promoter/TSS DAR list suggesting that downregulation was not
demonstrated that the majority of accessible regions were located           associated with altered chromatin structure at the promoter.
in introns (44%) and intergenic regions (39%) (Figure 4E).                  Surprisingly, 61% of DARs linked to downregulated genes
The significance of these accessible regions remains to be                  showed enhanced accessibility, which reflects the large number

Frontiers in Molecular Neuroscience | www.frontiersin.org              10                                      July 2021 | Volume 14 | Article 680280
Goodwin et al. SNF2L Restricts Progenitor Competence FIGURE 4 | ATACseq analysis of WT and Ex6DEL cultures. (A) Compilation of all ATACseq peaks showing enrichment at the TSS under all culture conditions. Mutant cultures at 1 DIV (Ex6DEL GNP) showed the greatest enrichment of peaks at the TSS, followed by Ex6DEL GN (3 DIV), WT GNPs and WT GNs. (B) Peaks aligned to a normalized genes showed that Ex6DEL chromatin (light blue) was more accessible than WT chromatin (dark blue) and more similar to the profile of ESCs (yellow). TSS, transcriptional start site; TES, transcriptional end site. (C) Schematic diagram showing the numbers of differentially accessible regions (DARs) between WT and Ex6DEL samples at 1 and 3 days in culture. (D) MA plot of the 3231 differentially accessible regions. Pink dots represent significant changes in accessibility, with dots above the line representing increased accessibility and below the line decreased accessible regions. (E) Plot showing the frequency of DARs at different genomic positions. Promoter/TSS, −1KB to +100 bp; 50 UTR, >100 bp from TSS; TTS, transcriptional termination sites. Frontiers in Molecular Neuroscience | www.frontiersin.org 11 July 2021 | Volume 14 | Article 680280
Goodwin et al.                                                                                                              SNF2L Restricts Progenitor Competence

  FIGURE 5 | Accessible regions are enriched for Fos/Jun binding sites. ATACseq peak alignment with binding sites for CTCF (A) or Fos (B) showed enrichment in the
  Ex6DEL samples for Fos binding sites but not CTCF. (C) ATACseq peaks at 1 DIV were assigned to the nearest gene and then cross referenced to the up- and
  down-regulated genes to generate the bar graphs. Open (green) closed (pink) or chromatin regions showing no change (blue) are shown. (D,E) ATACseq and
  RNAseq reads shown in IGV browser format for the Arc (D) and Fosb (E) genes. The GNP ATACseq tracks are shown in the blue box. The GNP RNAseq is shown in
  the black box. The unboxed tracks correspond to ATACseq and RNAseq from GNs.

Frontiers in Molecular Neuroscience | www.frontiersin.org                       12                                            July 2021 | Volume 14 | Article 680280
Goodwin et al.                                                                                                             SNF2L Restricts Progenitor Competence

  FIGURE 6 | Ex6DEL cultures are delayed in differentiation. (A) Schematic diagram showing the numbers of differentially expressed genes (DEGs) between different
  samples (WT and Ex6DEL) and days in culture (same as Figure 3A). (B) Venn diagram showing overlapping differentially expressed genes in WT or Ex6DEL cultures
  during differentiation (gene expression comparison between I and 3 DIV). (C) Venn diagram highlighting that only 1/3 of the uniquely expressed genes from (B)
  (Ex6DEL specific: 1532; WT-specific: 2228) remain differentially expressed at 3 DIV. Green circle comprises the 2967 down- and 551 up-regulated DEGs between
  WT and Ex6DEL cultures. (D,E) GO term analysis of the DEGs at # DIV that were specific to the Ex6DEL (D) or WT (E) cultures.

of accessible DARs in introns although the significance of these                     between the WT GNs and Ex6DEL GNs at 3 DIV (Figure 6A).
chromatin changes remains to be determined.                                          Given the lag in differentiation of the Ex6DEL cultures, we
                                                                                     compared how many of the DEGs between 1 DIV and 3 DIV
Ex6DEL Cultures Show Increased                                                       were resolved by the third day in culture. In both sets of cultures
Activation of Erk Signaling                                                          approximately 2/3 of DEGs were resolved (60%, 1531/2228 WT
Despite the delay exiting the cell cycle, GNPs from the Ex6DEL                       DEGs; 63%, 959/1532 Ex6DEL DEGs; Figure 6C). Alternatively,
cultures initiate the differentiation program. We compared the                       one-third of the Ex6DEL (573 DEGs) and WT (697 DEGs)
differential gene expression between 1 DIV and 3 DIV timepoints                      remain altered in the 3 DIV cultures, while 2248 “new” genes
for both WT and Ex6DEL cultures to determine whether the                             (GN DEGs) become differentially expressed (Figure 6C). Finally,
process of differentiation results in similar gene set changes. In                   we performed GO analysis on these clusters of DEGs identified
this regard, we observed a similar number of genes differentially                    at 3 DIV (i.e., Ex6DEL-specific, WT-specific, GN DEGs). Of the
expressed from 1 DIV to 3 DIV, with 5647 DEGs changing in                            573 DEGs that were considered to be specific for Ex6DEL 3 DIV
WT cultures and 4951 DEGs altered in the Ex6DEL cultures                             cultures, notable GO terms showed changes in cell proliferation,
(Figure 6A). Moreover, 3419 genes were common to both                                cell migration, cell adhesion, and regulation of the ERK1/ERK2
cultures (WT: 60.5% of DEGs; Ex6DEL: 69% of DEGs) suggesting                         pathway (Figure 6D). Notable GO terms for the 697 DEGs
that the differentiation program proceeds along a similar path                       specific for WT 3 DIV cultures included positive regulation of
regardless of Snf2l status (Figure 6B). There were 2228 and 1532                     transcription & gene expression, cell differentiation, multicellular
genes in WT and Ex6DEL cultures, respectively, that were specific                    organism development (Figure 6E). Very similar GO terms were
to the differentiation of the individual cultures. We reasoned that                  also identified for the novel 2248 DEGs at the 3 DIV timepoint
many of these gene expression differences could reflect the overall                  suggesting that these latter gene sets are representative of a more
lag in differentiation occurring in the Ex6DEL cultures while                        mature differentiated state (Supplementary Figure 7).
others could represent Snf2l-specific changes.                                          As such, we focused on the Ex6DEL-specific dataset and,
    Next, we examined the differences in gene expression at 3                        more specifically, the DEGs within the GO term “regulation of
DIV to determine how similar or different the GNP cultures                           ERK1/ERK2 pathway” to identify a potential pathway critical
were 3 days after plating. This analysis demonstrated 3518 DEGs                      for GN differentiation of the Ex6DEL cells. In this regard,

Frontiers in Molecular Neuroscience | www.frontiersin.org                       13                                           July 2021 | Volume 14 | Article 680280
Goodwin et al. SNF2L Restricts Progenitor Competence
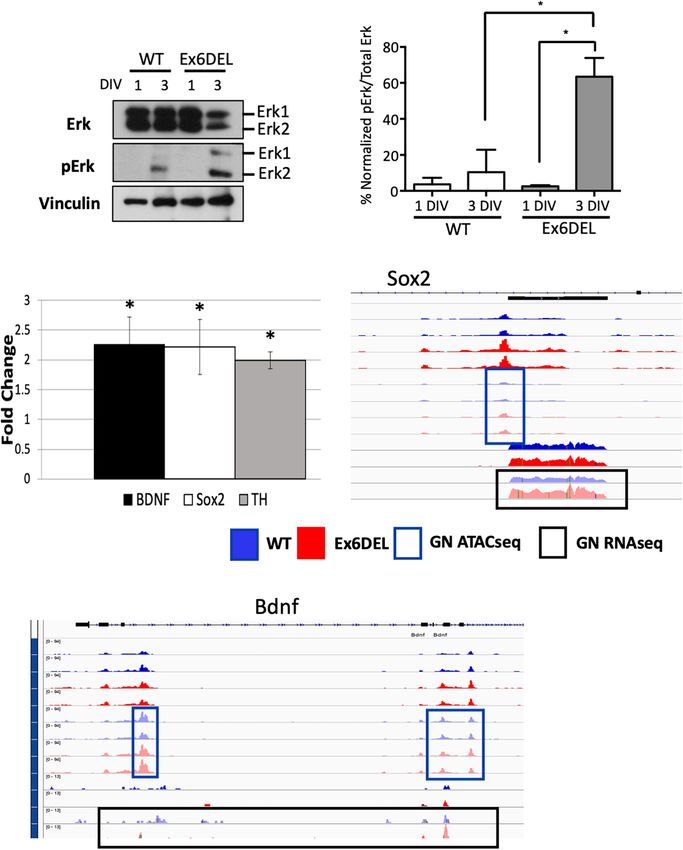
we performed immunoblots for the Erk1/2 proteins and their proportion of a distinct progenitor cell type that alters the
phosphorylated isoforms. GNPs were cultured from WT and differentiation kinetics of the culture. Regardless, the enhanced
Ex6DEL mice and protein extracts isolated at 1 DIV and 3 DIV proliferation index was transient and the Ex6DEL cultures
for analysis. Since Erk1 and Erk2 exhibit functional redundancy underwent differentiation showing a 69% concordance with WT
we quantified global Erk phosphorylation (normalized pErk1 and cultures in the DEGs associated with this process (i.e., 1 DIV
pErk2/Erk1 and Erk2 levels) and not isoform specificity as a vs. 3 DIV expression changes). Expression differences at 3 DIV
measure of pathway activation (Busca et al., 2016). In the WT highlighted the importance of the ERK signaling cascade for GNP
samples the total Erk protein level dropped by 40% in the 3 differentiation.
DIV sample compared to the 1 DIV sample, but the activation Granule neuron precursors migrate to the EGL from the
increased ∼3-fold (3.6% at 1 DIV; 10.4% at 3 DIV). It should be upper rhombic lip, one of two germinal zones in the developing
noted that the activation was primarily through phosphorylation cerebellum. Within the EGL they respond to Shh released from
of Erk2 (Figures 7A,B). In the Ex6DEL cultures we observed a Purkinje cells to proliferate during the early postnatal period
similar drop in total Erk protein levels (∼50%) at 3 DIV but which is critical for cerebellar folia growth. Dysregulation of
pathway activation was significantly increased (24-fold; 2.6% 1 GNP expansion can result in a hypoplastic cerebellum, as was
DIV; 63.4% 3 DIV; Figures 7A,B). observed for Smarca5 cKO mice (Alvarez-Saavedra et al., 2014),
To determine if the Erk pathway is altered in the Ex6DEL or conversely, cause some subtypes of medulloblastoma as shown
mice, we performed RT-qPCR for three downstream Erk target for activating hedgehog (HH) mutations. We observed a transient
genes, using RNA isolated from cerebellar tissue at P10 from maintenance of proliferation in the Ex6DEL cultures that was not
Ex6DEL mice and control littermates. Consistent with increased associated with alterations in HH signaling suggesting that other
activation of the Erk1/2 pathway in Ex6DEL 3 DIV cultures we mitogenic pathways were active. A previous study demonstrated
observed increased expression of all three downstream target increased proliferation of HeLa cells after siRNA knockdown of
genes, namely Sox2, Bdnf, and Th in the Ex6DEL cerebellum Smarca1 through the activation of the Wnt signaling cascade
(Figure 7C). We also examined whether the transcriptional (Eckey et al., 2012). The study demonstrated activation of
changes in the mice were duplicated in the cultures by assessing β-catenin using the TOP/FOP flash assay but determined that this
the chromatin accessibility and transcript reads of these target was a post-transcriptional effect ruling out SNF2L remodeling of
genes. For both Sox2 and Bdnf we observed a slight increase in the CTNNB1 gene. Three of the Wnt target genes upregulated
accessibility although none of the accessible regions reached the in that study (EDN1, FN1, PLAUR) were similarly altered in
significant threshold to be considered a DAR (Figures 7D,E). our study as were an additional 9 Wnt responsive genes (Fzd6,
Moreover, increased transcript reads were only observed for Flt4, Kdr, Lef1, Abcc4, Abcb1a, Neurod1, Ptgs2, Nes) and the
Sox2 (Figure 7D) but not for Bdnf (Figure 7E) in the receptor for Edn1 (Ednra). The significance of these changes to
culture experiments. proliferation, however, remain to be fully determined. Another
similarity between our study and the one by Eckey et al. (2012)
was that the GO term analysis indicated that angiogenesis was the
DISCUSSION biological process with the most significant change. While further
work is required to delineate the significance of the specific gene
The Ex6DEL mice contain an internally truncated Snf2l protein changes, one possibility is that Snf2l is required to maintain
that lacks the ability to bind and hydrolyze ATP thereby rendering repression of genes critical for blood vessel formation.
it unable to remodel nucleosomes. We have shown that the One of the dysregulated Wnt target genes of interest was
truncated Snf2l protein can assemble into ISWI complexes (e.g., the endothelin-1 gene, Edn1 because it has been shown to
CERF) and thus, it likely retains some ability to be recruited be critical for autocrine-mediated neuroprogenitor proliferation
to its genomic targets (e.g., promoter/TSS sites). GNPs isolated within the postnatal subventricular zone of mice (Adams et al.,
from the Ex6DEL mice were mildly impaired in their ability to 2020). A similar decrease in proliferation was obtained when
exit the cell cycle, thus delaying differentiation when plated in one of the endothelin receptors, endothelin b receptor (Ednrb)
culture. The chromatin landscape of the Ex6DEL GNP cultures was deleted in mice. Further studies revealed that endothelin
showed a general increase in accessibility at TSS that was more signaling activated the Notch pathway to maintain proliferation
similar to that of mESCs than to control GNP cultures. Over 96% of the radial glia progenitors (Adams et al., 2020). While a similar
of the DARs between WT and Ex6DEL GNP cultures showed Edn1-Ednra autocrine effect could be occurring in the Ex6DEL
increased accessibility. Of those located in promoter/TSS regions GNP cultures, we did not observe transcriptional activation of
we identified an enrichment for Fos/Jun binding sites suggesting Notch signaling components (e.g., Jag1, Hey1) as shown in the
that Snf2l remodeling normally decreases accessibility at these Adams et al. (2020) study. Despite this difference, endothelin-
sites to facilitate differentiation. The increased accessibility 1 signaling can be transduced through phosphatidylinositol
was correlated with increased gene expression with ∼80% of 3-kinase (PI3-K), Wnt, and mitogen-activated protein kinase
the 529 DEGs, consistent with a role for Snf2l in repressing (MAPK) signaling pathways (Bouallegue et al., 2007; Kristianto
gene expression during cerebellar development. Collectively, et al., 2017), the latter two for which we observed several gene
the Ex6DEL cultures either represent a “less differentiated” or expression differences in the Ex6DEL cultures.
committed GNP that does not immediately exit the cell cycle Given the incidence of Wnt activation in medulloblastoma,
upon plating, or alternatively, the culture contains a greater several studies have examined the requirement for Wnt in GNP
Frontiers in Molecular Neuroscience | www.frontiersin.org 14 July 2021 | Volume 14 | Article 680280You can also read