THE FACTORS THAT AFFECT USAGE INTENTIONS AND TRAVEL INTENTIONS OF TRAVEL-RELATED WECHAT OFFICIAL ACCOUNTS - MDPI
←
→
Page content transcription
If your browser does not render page correctly, please read the page content below

sustainability

Article
The Factors that Affect Usage Intentions and Travel
Intentions of Travel-Related WeChat Official Accounts
Yanyan Wang 1,2 , Yann-Jou Lin 1 and Bau-Show Lin 1, *
 1    Department of Horticulture and Landscape Architecture, National Taiwan University, Taipei 10673, Taiwan;
      d00628011@ntu.edu.tw (Y.W.); yannjlin@ntu.edu.tw (Y.-J.L.)
 2    Strait College, Minjiang University, Fuzhou 350108, China
 *    Correspondence: doralin@ntu.edu.tw; Tel.: +88-62-3366-4867

 Received: 23 June 2020; Accepted: 22 July 2020; Published: 29 July 2020

 Abstract: WeChat Official Accounts (WOAs)—a feature of WeChat—are thriving. However, studies
 on travel-related WOAs remain scarce and lack depth. This study aimed to identify the factors that
 influence usage intentions and travel intentions in regard to travel-related WOAs. Based on the Uses
 and Gratifications (U&G) theory, this study developed a theoretical model and examined the model
 through a web-based questionnaire. The questionnaire was distributed through the online survey
 tool Sojump. After analyzing the obtained data via structural equation modeling, the results revealed
 that: (1) social, entertainment, and information motivations are the primary factors influencing usage
 intentions; (2) information and entertainment motivations are important factors influencing travel
 intentions; and (3) usage intentions positively affect travel intentions and play a mediating role.
 The findings carry theoretical and practical significance regarding how travel-related WOAs can
 improve users’ usage and travel intentions, as well as value for the actual management and marketing
 of WOAs.

 Keywords: motivation; usage intention; travel intention; structural equation modelling

1. Introduction
      Since it was first launched by Tencent in January 2011, WeChat has accumulated over one
billion active users and has developed into one of the most widely used smartphone applications [1].
The WeChat Official Accounts (WOAs) were established on 23 August 2012, as a platform designed
primarily to allow enterprises, media companies, government departments, and individuals to share,
communicate, and access information through features such as push publishing, information queries,
online interactions [2]. According to the WeChat 2018 Influence Report and WeChat Economic Data
Report, the number of WeChat Official Accounts (WOAs) exceeded 10 million by the end of 2017,
among which active accounts reached 3.5 million, making WOAs important platforms for public
discourse and important channels for the dissemination [3]. As of 2020, the number of WeChat official
accounts had risen to 20 million [4].
      With the upgrading of tourism infrastructure, people travel more frequently. China’s tourism
industry has expanded enormously and developed an extensive market base, becoming the foremost
market and the largest innovation testbed in global tourism [5]. In 2019, people traveling within China
reached 6.01 billion and tourism revenue amounted to about 5.73 trillion yuan (amount to approximately
0.81 trillion dollars), for annual growth rates of 8.4% and 11.7% respectively [6]. An increasing number
of tourist destinations are establishing their own WOAs in attempts to enhance promotion; expand the
coverage, forms, and scope of their services; and consolidate brand image [7]. From a sustainability
perspective, mobile technology in general is expected to contribute to the development of sustainable
tourism [8]. Information and Communication Technologies (ICT) and applications (apps) for tourists

Sustainability 2020, 12, 6108; doi:10.3390/su12156108                       www.mdpi.com/journal/sustainability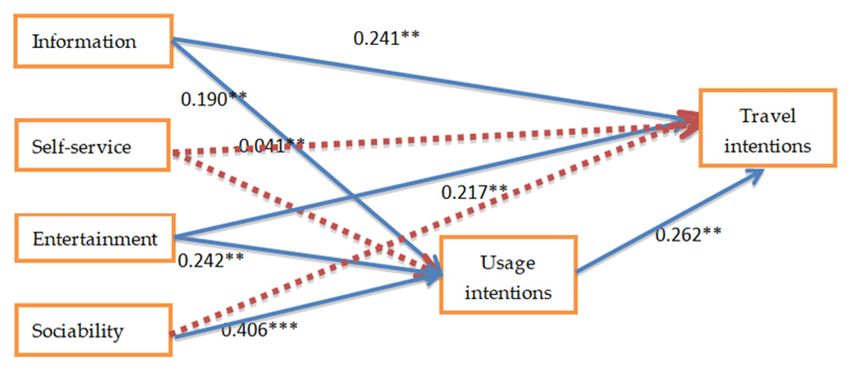
Sustainability 2020, 12, 6108                                                                       2 of 17

are also essential tools in destination promotion and marketing [9]. In fact, WOAs also have developed
into a common means of marketing, and enterprises are taking active steps to market their products
through WOAs [10].
      In contrast to the research on the blooming of China’s tourism industry, however, studies on
travel-related WOAs are scarce, and the few that exist lack depth [11]. At present, research on WOAs
has largely focused on the application of real-time mobile communication tools in areas such as medical
fields, education, and the academic domain [12–14]. Despite WeChat’s gigantic user base, growth
in the number of WOA users is sluggish [15]. Users’ lack of concern and understanding regarding
WOAs has limited the functionality and roles of the mobile terminal as a service and marketing
platform [16]. Hence, maintaining or expanding the user base by increasing and sustaining usage
intentions has become a salient issue that urgently requires a solution. Bhattacherjee reported that
attracting users’ initial adoption and usage of technology is merely the first step for achieving the
successful implementation of an information system, and that customer retention is the key to retaining
such success [17]. Thus, exploration of the usage and travel intentions associated with travel-related
WOAs is of immense significance for tourism businesses.
      Considering the issues identified above, this study adopted uses and gratifications (U&G) theory
as its theoretical framework, to identify the motives and gratifications associated with intentions to use
travel-related WOAs and intentions to travel. The data were collected by the online survey tool Sojump.
After analyzing the obtained data via structural equation modeling, the findings carry theoretical and
practical significance regarding, as well as value for the actual management and marketing of WOAs.
This study results contribute to the knowledge gap regarding mobile social media technology guided
by U&G in travel-related WOAs context.

2. Theoretical Background
      The U&G theory, originated from the functionalist perspective on mass media communication,
was first developed in research on the effectiveness of the radio medium in the 1940s [18]. It provides a
conceptual framework for examining whether users are willing to adopt and accept new media [19].
According to the U&G, people are active in choosing and using particular media as required. Their
need-oriented motives influence their use of communication media, resulting in affective, cognitive
and behavior outcomes [20].
      The U&G theory has been frequently applied to computer-mediated communication (CMC)
research [21]. A review of the literature reveals that the previous social media studies mainly
focused on using U&G regarding adopting Facebook, Weibo, WeChat or other social networking sites
(SNS) [22–25].
      The U&G has also been used to study online tourism-related behavior [26,27]. Considerable
literature also explored peoples’ online consumption behavior, tourism willingness, and TV shopping
behavior from the perspective of the U&G theory. Huang uses the U&G theory to discuss the online
consumption behaviors of Taiwanese consumers [28]; Luo uses the U&G theory to explore the effects of
information, entertainment and stimulus on a variety of online consumption behaviors [29]; A study by
Pennington et al. uses the U&G theory to observe the relation between tourists’ feature, general Internet
search, and tourist willingness [26]. Another study, by Mendes-Filhoa et al. uses the U&G theory to
study how tourists can use online travel reviews (OTRs) on mobile devices to make tourist plans [27].
In summary, the U&G theory has been applied to identify users’ behavior in different contexts.
      Considering the issues identified above, this study adopted the U&G theory, to identify the motives
associated with intentions to use travel-related WOAs and intentions to travel, thus constructing the
theoretical model of this study.
Sustainability 2020, 12, 6108 3 of 17
3. Hypotheses and Theoretical Model
3.1. Motivations and Usage Intentions
Motivation can be defined as a general tendency that drives the behaviors people perform to
satisfy their needs or desires [30]. Motivation is also one of the factors that influences peoples’ selective
choice and subjective interpretation of media information [31]. Meanwhile, usage intentions are clients’
likelihood of using a specific product or service [32].
Jung et al. identified six main reasons for the use of Cyworld (a social network service) in Korea:
entertainment, self-expression, professional advancement, passing time, communication with family
and friends, and knowing the trends [33]. Meanwhile, Wei identified five motives regarding the usage
of mobile phones: passing time, social interaction, feeling an increased sense of security, instrumentality,
and communication facilitation [34]. Raacke and Bonds–Raacke discovered that the major motives for
using Facebook and MySpace were to seek “friends” and “information” [35]. Similarly, Brandtzæg and
Heim listed the following four major motives for using the four most popular social networking services
in Norway (namely, Underskog, Nettby, HamarUngdom, and Biip): information, entertainment, social
interaction, and expressing personal identity; among these motives, social interaction was considered
to be foremost [36].
Analysis of more recent studies yielded the following results: Li et al. found that utilitarian
gratification (achievement), social motivation (social presence and interaction), and hedonic motivation
(fantasy, escapism, and enjoyment) can be obtained from games played on social networks [37]; Liu et al.
revealed that content motivation (information sharing, self-documentation, and self-expression) and
technology motivation (convenience, media appeal, and social presence) are derived from the use of
microblogging [38]; Zhang et al. found that, among the four types of value (social value, information
value, emotional value, and hedonic value) perceived by WeChat users in the service, social value
and hedonic value are the only ones that affect their continuance intentions [39]; Hwang and Cho
discovered that social value and entertainment value positively affect intention to use Instagram [40].
Analysis of the above usage motivations and gratifications showed that functional motivations
(instrumentality and information-seeking), leisure and entertainment motivations (pleasure and
passing time), and social motivations (interpersonal communication) are common among previous
study findings. In other words, they have been proven to be the primary motivations behind the use
of new technology, and suffice to satisfy humans’ basic needs. Meanwhile, an important feature of
travel-related WOAs is the provision of convenient products or services that can save users time and
effort, including making enquiries regarding plane tickets, hotel reservations, and other tickets, and
membership offers [41,42]. Users’ self-service motivation reflects the desire to reduce time cost, effort,
and psychological cost through certain methods, objects, or services. Hence, this study hypothesizes:
Hypothesis 1 (H1). Information motivation positively affects usage intentions regarding travel-related WOAs.
Hypothesis 2 (H2). Self-service motivation positively affects usage intentions regarding travel-related WOAs.
Hypothesis 3 (H3). Entertainment motivation positively affects usage intentions regarding travel-related WOAs.
Hypothesis 4 (H4). Sociability motivation positively affects usage intentions regarding travel-related WOAs.
3.2. Motivations and Travel Intentions
Motivation theory declared that motivations are the direct influencing factors of users’ behavioral
intention [43], Motivations are the physical and psychological needs and desires that drive the whole
and directly influence individual behavior and actions [44]. Dann mentioned in tourism research that
the concept of motivation can be divided into push and pull: intrinsic motivation is the push factor,Sustainability 2020, 12, 6108 4 of 17
which is invisible; extrinsic motivation is the pull factor, mainly the characteristics and attraction of
the destination. The causality of motivation for behavior is confirmed [45–47], and recent studies also
show that travel motivation has a positive impact on travel intentions, which themselves lead to travel
behavior [48–51].
Travel intentions, an important concept in the study of tourism, are the psychological process
through which travelers select their destinations during travel-related decision-making. In their
attempt to predict travelers’ behaviors, Woodside and Lysonski examined situational factors and
consequently opined that travel intentions reflect travelers’ strong desire to visit a certain location at a
certain time [52].
Previous research has found that entertainment motivation provides psychological benefits of
travel which, in turn, influences travel intentions. A study by Mannell and Iso-Ahola posited that
the psychological benefits produced by leisure and tourist experiences originate from the interplay
between two motivational forces: the urge to escape from routine and stressful environments and
the urge to seek recreational opportunities [53]. Studies have also found that information and social
motivation affect traveler satisfaction which, in turn, influences travel intentions. For instance, Ross
and Iso-Ahola identified a considerable similarity between the dimensions of motivation and traveler
satisfaction, and suggested that knowledge-seeking, social interaction, and escapism are important
shared motivation and satisfaction factors [54]. The senior tourism market has received increased
attention. Using Taiwanese seniors as the study sample, the authors identified that novelty-seeking not
only can be stimulated by affect, but also aroused travel intention [55]. The effects of social motivations,
entertainment motivations, and information-seeking on travel intentions have also been highlighted in
more recent studies [56,57]. For example, Martin et al. (2019) found that utilitarian/hedonic motivations
of consumers influenced brand interaction and behavioral intention of consumers.
Considering the above and the feature of travel-related WOAs, information-seeking, self-service,
entertainment, and social motivations may be the primary motivations behind travel intentions.
Therefore, we propose the following hypotheses:
Hypothesis 5 (H5). Information motivation positively affects travel intentions regarding travel-related WOAs.
Hypothesis 6 (H6). Self-service motivation positively affects travel intentions regarding travel-related WOAs.
Hypothesis 7 (H7). Entertainment motivation positively affects travel intentions regarding travel-related WOAs.
Hypothesis 8 (H8). Sociability motivation positively affects travel intentions regarding travel-related WOAs.
3.3. Usage Intentions and Travel Intentions
Previous studies have shown that attitude and behavioral intentions are positively
correlated [58–61]. Verhagen et al. clearly show that utilitarian, social, and hedonic motivations
have a significant impact on customer behavioral intention [62]. Moreover, Charfi and Cui et al. show
the mediating effects of usage intentions between utilitarian and hedonic motivations and travel
intentions [63,64]. A study by Leung and Bai found that travelers’ active engagement with hotel social
media pages influences their revisit intentions [65]. Further, Chen et al. revealed that the novelty,
understandability, and interestingness of travel blog contents influence behavioral intentions through
blog-usage intentions [66].
Analysis of the above literature shows that usage intentions may positively affect travel intentions
and play a mediating role. Thus, we develop the following hypothesis:
Hypothesis 9 (H9). Usage intentions for WOAs positively affect travel intentions regarding travel-related WOAs.intentions through blog-usage intentions [66].
Analysis of the above literature shows that usage intentions may positively affect travel
intentions and play a mediating role. Thus, we develop the following hypothesis:
Sustainability
Hypothesis 9 (H9). 12, 6108intentions for WOAs positively affect travel intentions regarding travel-related 5 of 17
2020,Usage
WOAs.
Based on the above literature review and the development of hypotheses, the theoretical model is
Based on the above literature review and the development of hypotheses, the theoretical model
shown in Figure 1. The theoretical model comprised six variables: information motivation, self-service
is shown in Figure 1. The theoretical model comprised six variables: information motivation,
motivation, entertainment motivation, social motivation, usage intentions, and travel intentions.
self-service motivation, entertainment motivation, social motivation, usage intentions, and travel
According to the U&G theory, the four types of motivations mentioned above correspond to four
intentions. According to the U&G theory, the four types of motivations mentioned above correspond
types of user gratification, namely: information gratification, self-service gratification, entertainment
to four types of user gratification, namely: information gratification, self-service gratification,
gratification, and social gratification.
entertainment gratification, and social gratification.
Figure 1. Theoretical Model Diagram.
Figure 1. Theoretical Model Diagram.
4. Research Methodology
4. Research Methodology
4.1. Research Setting
There
4.1. Research are abundant tourism resources in China’s Fujian Province, with three UNESCO World
Setting
Heritage sites (Wuyi Mountain, Fujian Earth Building and Danxia) two UNESCO Global Geoparks
There are abundant tourism resources in China’s Fujian Province, with three UNESCO World
(Taining and Ningde), 10 national 5A tourist attractions, 10 national geological parks, 15 national
Heritage sites (Wuyi Mountain, Fujian Earth Building and Danxia) two UNESCO Global Geoparks
nature reserves, 29 national forest parks, 137 national key cultural relic protection units, and 4 national
(Taining and Ningde), 10 national 5A tourist attractions, 10 national geological parks, 15 national
historical and cultural cities [67]. It is one of the most important tourism provinces in China.
nature reserves, 29 national forest parks, 137 national key cultural relic protection units, and 4
In recent years, the tourism market in Fujian has shown year-on-year growth. In 2018, Fujian
national historical and cultural cities [67]. It is one of the most important tourism provinces in China.
achieved total tourism revenue of 663.46 billion yuan (amount to approximately 94.61 billion dollars),
In recent years, the tourism market in Fujian has shown year-on-year growth. In 2018, Fujian
an increase of 30.5%. It received 9.01 million inbound tourists, an increase of 16.2% over the previous
achieved total tourism revenue of 663.46 billion yuan (amount to approximately 94.61 billion
year. Revenue reached $9.09 billion yuan (amount to approximately 1.27 billion dollars). The number
dollars), an increase of 30.5%. It received 9.01 million inbound tourists, an increase of 16.2% over the
of domestic tourists received was 451.39 million, an increase of 20.3%; domestic tourism income was
previous year. Revenue reached $9.09 billion yuan (amount to approximately 1.27 billion dollars).
603.30 billion yuan, up 32.0% [68].
The number of domestic tourists received was 451.39 million, an increase of 20.3%; domestic tourism
This study selected the “Fujian Tourism” WOA (fjta12301) for this research, based on the following
income was 603.30 billion yuan, up 32.0% [68].
rationale: first, Fujian is a core area of China’s “21st Century Maritime Silk Road” initiative (a Chinese
This study selected the “Fujian Tourism” WOA (fjta12301) for this research, based on the
strategic initiative to increase investment and foster collaboration) and enjoys an abundance of tourism
following rationale: first, Fujian is a core area of China’s “21st Century Maritime Silk Road” initiative
resources; second, it is China’s first national ecological civilization pilot zone (that is, under a plan
(a Chinese strategic initiative to increase investment and foster collaboration) and enjoys an
to explore new practices and conduct reforms to preserve the ecology and protect the environment),
abundance of tourism resources; second, it is China’s first national ecological civilization pilot zone
with “Refreshing Fujian” being the slogan of Fujian tourism [69]; third, the “Fujian Tourism” WOA
(that is, under a plan to explore new practices and conduct reforms to preserve the ecology and
is not only an important online platform for external officially regarding Fujian-related tourism
information, but is also a brand new official interactive platform.Sustainability 2020, 12, 6108 6 of 17
4.2. Questionnaire Design and Data Collection
4.2.1. Questionnaire Design
A questionnaire survey was used to gather the necessary data for model validation. Relevant
previous studies were examined in order to design and adapt model dimensions and items for the
present study. Appendix A shows the sources of the items used. The initial questionnaire was modified
based on two experts’ opinions (that is, those of a full professor and associate professor in the tourism
studies field) before testing. Then, five master’s students majoring in tourism studies were recruited
to read the questionnaire and identify any ambiguity. The results showed that WOA users would
have a good understanding of the questionnaire instructions and items. The official questionnaire was
then finalized.
The questionnaire was divided into three parts. The first section comprised the questionnaire
instructions. The second section concerned the various variables of the research framework, including
motivation and gratification variables (information, self-service, entertainment, and sociability) and
usage and travel intentions associated with the travel-related WOAs; each item was scored using a
seven-point Likert scale, with “1” representing “strongly disagree” and “7” representing “strongly
agree.” Finally, the third section concerned the respondents’ demographic information (gender, age,
education level, marital status, and monthly personal income), their daily screen time on WeChat, their
history of WeChat usage, and their number of WeChat friends (please refer to Appendix A for the
questionnaire items and their sources).
4.2.2. Data Collection
The questionnaire was published on Sojump (www.Sojump.com), the most popular online
survey tool in China [70]. Many recent research studies have employed Sojump to solicit survey
responses [56,71,72].
The interviewees who were addressed were randomly selected from the members who had used
the “Fujian Tourism” WOA (fjta12301). They were of different ages, identities, occupations, and regions.
Respondents provided their answers via computer or cellphone.
Completed respondents were collected via Sojump for statistical analysis, with a total of 741
retrieved from November 6 to 23, 2018. After excluding respondents- with repetitive IP addresses
and those completed in less than 120 seconds or in more than 1800 seconds, a total of 729 valid
questionnaires were eventually obtained.
4.2.3. Data Processing and Analytical Methods
Validity testing of the questionnaire was initially conducted using Cronbach’s α. After verifying
that the questionnaire possessed sufficient validity, exploratory factor analysis (EFA) was then
performed to construct the dimensions of the motivation and gratification variables. Afterward, Amos
24.0 software (IBM, Somers, NY, USA, version 24.0) was employed to perform confirmatory factor
analysis (CFA) and to determine the goodness-of-fit, convergent validity, and discriminant validity of
the measurement model. Finally, structural equation modeling was conducted, and bootstrapping was
used to test the mediation effects of the model.
5. Results
5.1. Sample Characteristics
Table 1 shows the demographic data of the surveyed sample. Among the 729 respondents, 59%
were females; the majority were unmarried (51.9%) and had a high level of education (62.3% had a
bachelor’s degree). In addition, 74.3% of the respondents spent over two hours daily on WeChat,
and 77% had been using WeChat for over two years; 39.8% had a monthly income that exceeded
5000 yuan (equivalent to approximately $728), and 24.7% had over 200 WeChat friends.Sustainability 2020, 12, 6108 7 of 17
Table 1. Summary of demographic statistics (n = 729).
Gender n %
male 299 41.0
female 430 59.0
Age
≤20 119 16.3
≤30 370 50.8
≥30 240 32.9
Marriage
unmarried 378 51.9
married 345 47.3
else 6 0.80
Education
junior 228 31.3
undergraduate 454 62.3
graduate 47 6.40
Individual monthly income (Renminbi, or RMB)
≤2000 204 28.0
>2000 and ≤5000 235 32.2
>5000 290 39.8
Daily time spent on WeChat
>1 h and ≤2 h 187 25.7
>2 h and ≤3 h 254 34.8
>3 h 288 39.5
How long have you used WeChat
≤1 year 55 7.50
>1 year and ≤2 years 113 15.5
>2 years 561 77.0
How many friends do you have on WeChat
≤50 93 12.8
>50 and ≤100 184 25.2
>101 and ≤150 165 22.6
>151 and ≤200 107 14.7
>200 180 24.7
The results of this demographic data are consistent with the results of the 44th China Internet
Network Development Report of the China Internet Network Information Center (CNNIC), as well as
with the entire Internet user sample database. The report shows that as of June 2019, the largest group
of Internet users in China were students, accounting for 26.0%; regarding age structure, as of June 2019,
Internet users aged 10–39 accounted for 65.1% of all internet users, among which those aged 20–29
accounted for 24.6%. Income structure shows that by June 2019, netizens with a monthly income of
2001–5000 yuan accounted for more than one-third of the total, that is, 33.4%. All this is consistent
with our demographic data [73].
5.2. Analysis of the Measurement Model
First, reliability and validity testing were conducted on the questionnaire, yielding a Cronbach’s
α value of 0.862. According to Kline, a reliability coefficient of over 0.8 is very satisfactory [74].
The 12 items regarding motivation and gratification then underwent EFA; analytical results revealed
that the factors influencing usage and travel intentions could be classified into four dimensions, namely,
information motivation, self-service motivation, entertainment motivation, and social motivation. Then,Sustainability 2020, 12, 6108 8 of 17
the remaining five items, which involved usage and travel intentions, also underwent factor analysis.
The results showed that cross-loading occurred for the item “I will recommend this travel-related
WOAs to my family or friends.” Hair et al. suggested that any item that has a significant correlation
with two or more factors should be eliminated, as it may imply a poor item design [75]. Thus, this item
was eliminated, and the finalized questionnaire was used as the official version for CFA validation.
During validation, Amos version 24.0 was employed to test the goodness-of-fit, convergent validity,
and discriminant validity of the model. Table 2 illustrates the goodness-of-fit results (χ2/df = 3.280;
GFI = 0.951; RMSEA = 0.056; CFI= 0.941; IFI= 0.942; TLI= 0.920). During the CFA, composite reliability
(CR) was used to determine the internal consistency of the model; all CRs were consequently found to
exceed 0.6, which indicated satisfactory reliability [72]. The convergent validity was measured using
factor loadings and average variance extracted (AVE) [75,76]. All factor loadings were consequently
found to exceed 0.5, which implied a relatively high level of convergent validity. AVE reflects the
average variance of item loading on a construct. Each of the constructs had an AVE value of 0.5,
which indicated satisfactory convergent validity. Table 3 summarizes the statistical outcomes of
the CFA.
Table 2. Fit indices for the measurement model.
Model Fit Measures Model Fit Criterion Index Value Good Model Fit(Y/N)
Absolute fit indices RMSEA, Root Mean
0.9 0.951 Y
CMIN/DF, Chi Square/Degree of Freedom 0.9 0.941 Y
IFI, Incremental Fit Index >0.9 0.942 Y
TLI, Tucker-Lewis Index >0.9 0.920 Y
Table 3. Statistical outcomes of the confirmatory factor analysis.
Standardized Composite
Dimension Indicator Item AVE Cronbach’s α
Factor Loading Reliability (CR)
Information 1
Information 0.682
1. This WOA allows me to find the information I desire with ease.
Information 2 0.75 0.496 0.75
0.717
2. This WOA allows me to correctly find the information I desire
Information 3
0.713
3. This WOA allows me to promptly find the information I desire.
Self-service 1
Self-service 0.690
4. This WOA allows me to complete self-service tasks with ease.
Self-service 2 0.73 0.473 0.73
0.694
5. This WOA allows me to quickly complete self-service tasks
Self-service 3
0.680
6. This WOA allows me to satisfactorily complete self-service tasks.
Entertainment 1
Entertainment 0.748
I feel happy when using this WOA.
Entertainment 2 0.73 0.480 0.73
0.695
I feel amused when using this WOA.
Entertainment 3
0.631
I think it is cool to use this WOA.
Social 1
Sociability 0.684
I have made many friends through this WOA.
Social 2
This WOA brings many topics of common interests to me and my 0.771 0.72 0.466 0.71
friends.
Social 3
0.579
Many of my friends have also subscribed to this WOA.
Usage Usage intentions 1
0.767
intentions This WOA is worth following and using in the future. 0.70 0.538 0.70
Usage intentions 2
0.699
I will continue to follow and use this WOA in the future.
Travel Travel intentions 1
0.701
intentions I will visit a city recommended by the travel-related WOA. 0.64 0.466 0.63
Travel intentions 2
0.664
I will revisit a city recommended by the travel-related WOA.Sustainability 2020, 12, 6108 9 of 17
In terms of discriminant validity, Fornell and Larcker suggested that the AVE of a dimension
should be larger than the square of the correlation between any two constructs [77]. The results for
the present data illustrated that for all constructs the AVE values (the diagonal elements in Table 4)
exceeded the square of the correlation between any two constructs (the off-diagonal elements in
Table 4); hence, discriminant validity was supported. Based on the above, we determined that the
measurement model possessed sufficient goodness-of-fit and satisfactory reliability, convergent validity,
and discriminant validity.
Table 4. Discriminant validity.
Information Self-Service Entertainment Sociability Usage Intentions Travel Intentions
Information 0.704
Self-service 0.505 ** 0.688
Entertainment 0.379 ** 0.405 ** 0.693
Sociability 0.261 ** 0.244 ** 0.460 ** 0.683
Sustainability
Usage 2020, 12, x FOR PEER
intentions REVIEW 0.306 **
0.350 ** 0.434 ** 0.475 ** 0.733 10 of 19
Travel intentions 0.321 ** 0.249 ** 0.353 ** 0.292 ** 0.353 ** 0.683
TheThe diagonal
diagonal values
values are are
the the average
average variance
variance explained
explained (square
(square rootroot of AVE);
of AVE); the the off-diagonal
off-diagonal values
values are are
the the
correlation coefficients with other constructs. ** significantly correlated at the 01 level (two-tailed); * significantly
correlation coefficients
correlated at the 0.05with
levelother constructs. ** significantly correlated at the 01 level (two-tailed); * significantly
(two-tailed).
correlated at the 0.05 level (two-tailed).
5.3. Analysis of the Structural Model
5.3. Analysis of the Structural Model
The structural model was validated using Amos version 24.0. The goodness-of-fit indices
The structural model was validated using Amos version 24.0. The goodness-of-fit indices (χ2/df
(χ2/df = 3.280; RMSEA = 0.056; GFI = 0.951; CFI = 0.941; IFI = 0.942; TLI = 0.920) implied a good model
= 3.280; RMSEA = 0.056; GFI = 0.951; CFI = 0.941; IFI = 0.942; TLI = 0.920) implied a good model fit.
fit. The structural model was then evaluated to validate the hypothesized relationships. The results
The structural model was then evaluated to validate the hypothesized relationships. The results
showed that the standardized path coefficients were statistically significant. Information motivation
showed that the standardized path coefficients were statistically significant. Information motivation
(B = 0.190, p < 0.01), entertainment motivation (B = 0.242, p < 0.01), and social motivation (B = 0.406,
(B = 0.190, p < 0.01), entertainment motivation (B = 0.242, p < 0.01), and social motivation (B = 0.406, p
p < 0.001) were found to have significantly positive effects on usage intentions, which indicated that
< 0.001) were found to have significantly positive effects on usage intentions, which indicated that
they were important predictors of usage intentions. Thus, H1, H3, and H4 were statistically validated.
they were important predictors of usage intentions. Thus, H1, H3, and H4 were statistically
Similarly, information motivation (B = 0.241, p < 0.01) and entertainment motivation (B = 0.217, p < 0.01)
validated. Similarly, information motivation (B = 0.241, p < 0.01) and entertainment motivation (B =
also showed significant positive effects on travel intentions, which identified them as important
0.217, p < 0.01) also showed significant positive effects on travel intentions, which identified them as
predictors of travel intentions. Thus, H5 and H7 were statistically validated. Finally, usage intentions
important predictors of travel intentions. Thus, H5 and H7 were statistically validated. Finally,
(B = 0.262, p < 0.01) significantly influenced travel intentions, which implied that the former is a factor
usage intentions (B = 0.262, p < 0.01) significantly influenced travel intentions, which implied that the
that influences the latter. H9, therefore, was statistically supported. Figure 2 and Table 5 present the
former is a factor that influences the latter. H9, therefore, was statistically supported. Figure 2 and
results of the hypothesis testing and path coefficients.
Table 5 present the results of the hypothesis testing and path coefficients.
Figure 2. Model Verification Results. Note: ** p = 0.01; *** p = 0.001
Figure 2. Model Verification Results. Note: ** p = 0.01; *** p = 0.001
Table 5. Path results of the structural model.
Standardized
Hypotheses Paths t-value Yes or No
coefficient
H1: Information → usage intentions 0.190 ** 2.568 ** YES
H2: Self-service → usage intentions 0.032 0.404 NO
H3: Entertainment → usage intentions 0.242 ** 2.971 ** YESSustainability 2020, 12, 6108 10 of 17
Table 5. Path results of the structural model.
Hypotheses Paths Standardized Coefficient t-Value Yes or No
H1: Information → usage intentions 0.190 ** 2.568 ** YES
H2: Self-service → usage intentions 0.032 0.404 NO
H3: Entertainment → usage intentions 0.242 ** 2.971 ** YES
H4: Sociability → usage intentions 0.406 *** 5.811 *** YES
H5: Information → travel intentions 0.241 ** 2.794 ** YES
H6: Self-service → travel intentions −0.041 −0.461 NO
H7: Entertainment → travel intentions 0.217 ** 2.320 ** YES
H8: Sociability → travel intentions 0.049 0.592 NO
H9: Usage intentions → travel intentions 0.262 ** 2.990 ** YES
Note: ** p < 0.01, *** p < 0.001.
5.4. Testing for Mediation Effect
The mediation effect of the model was tested through bootstrapping. As the calculated bootstrap
confidence interval (CI) did not include zero, we concluded that there was an indirect effect [77,78].
The 95% bias-corrected CI and 95% percentile CI were calculated using Amos 24.0 and a bootstrapping
approach with 2000 iterations (Table 6).
Table 6. Testing for mediation effect.
Bias-Corrected Percentile
Type of Effect Standardized 95%CI 95%CI
Path
Effect Size
Lower Upper Lower Upper
Total effect Information—travel intentions 0.291 0.115 0.463 0.116 0.465
Direct effect Information—travel intentions 0.241 0.044 0.418 0.052 0.430
Information—usage
Indirect effect 0.050 0.005 0.135 0.003 0.116
intentions—travel intentions
Total effect Entertainment—travel intentions 0.280 0.078 0.482 0.079 0.487
Direct effect Entertainment—travel intentions 0.217 −0.07 0.434 −0.004 0.439
Entertainment—usage
Indirect effect 0.063 0.010 0.174 0.003 0.151
intentions—travel intentions
Total effect Sociability—travel intentions 0.155 −0.020 0.323 −0.023 0.318
Direct effect Sociability—travel intentions 0.049 −0.183 0.236 −0.173 0.244
Sociability—usage
Indirect effect 0.106 0.012 0.239 0.009 0.225
intentions—travel intentions
Table 6 shows that the total effect of information on travel intentions was 0.291, which indicated
that the path model had a significant total effect; meanwhile, the direct effect of information on travel
intentions was 0.241, which indicated a significant direct effect; finally, the indirect effect of information
on travel intentions through usage intentions was 0.050, which implied a significant indirect effect.
Thus, usage intentions partially mediate the effect of information on travel intentions.
The total effect of entertainment on travel intentions was 0.487, which indicated that the total effect
of the path model was significant. Meanwhile, the direct effect of entertainment on travel intentions
was 0.049, which implied an insignificant direct effect; finally, the indirect effect of entertainment on
travel intentions through usage intentions was 0.151, denoting a significant indirect effect. Thus, usage
intentions fully mediate the effect of entertainment on travel intentions.
Given that the total effect of social interaction on travel intentions was 0.155, the total effect of the
path model was insignificant.
In summary, usage intentions mediate the model comprising factors influencing WOAs users’
travel intentions. More specifically, they partially mediate the relationship between information
motivation and travel intentions while fully mediating that between entertainment motivation and
travel intentions.Sustainability 2020, 12, 6108 11 of 17
6. Discussion
This is a preliminary study that aimed to examine the effects of information, self-service,
entertainment, and social motivations have on usage intentions for travel-related WOAs and,
consequently, on users’ travel intentions. This study also sought to evaluate the relationship between
users’ usage intentions and travel intentions in relation to travel-related WOAs. The results validated
the positive effects of information, entertainment, and social motivations on usage intentions regarding
travel-related WOAs, the positive effects of information and entertainment motivations on WOA users’
travel intentions, and the positive effects of users’ usage intentions on their travel intentions.
6.1. Factor Influencing WOAs Users’ Usage Intentions
Analysis of the direct effect of psychological gratification types (information, entertainment,
and social interaction) on usage intentions showed that social motivation (0.406) is the main factor
influencing usage intentions. This verified H4, and past research has also pointed out that one of the
main motivations for people to use social media is sociality [19,35,78]. In regard to social interaction,
WOAs allows users to easily connect with strangers and make new friends. The significant positive
influence of sociability on user intentions identified in the present study accords with the findings of
Chang and Zhu (2011), who indicated that social interactions are crucial motivating factors behind
WOA users’ usage behaviors [14]. Thus, actively encouraging WOA users to interact with their friends
is an effective method of advancing the development of WOAs.
Information (0.190) and entertainment (0.242) are secondary influencing factors regarding usage
intentions, which validates the hypothesis H1 and H3. These findings are consistent with the
previous research [79–82]. Entertainment has a positive effect on users’ intention [83], but due to
platform characteristics of WOAs, the main function is a content push, which is a passively received
communication mode. Interaction is poor, and it is not as good as immersive media such as WeChat,
Weibo, or online games.
6.2. Effect on Travel Intentions
Regarding the direct effect of psychological gratification types (information and entertainment)
on travel intentions, information (0.241) was found to be the main factor influencing travel intentions,
followed by entertainment (0.217); social gratifications do not influence travel intentions. The positive
effect of information on users’ travel intentions verifies hypothesis H5 and is consistent with previous
research [66,84,85]. Wen and Huang (2019) analyzed the motivations of 348 visitors and found that
unique seeking information predicted travel intentions [50].
Entertainment motivation (0.217) exerts a positive influence on travel intentions. H7 was validated,
in line with previous research by Chiu and Yang [86]. Usage intentions influence travel intentions
(0.262), so H9 was also validated. Thus, entertainment ultimately influences users’ travel intentions, but
this influence is fully mediated by usage intentions, matching the findings of Huang (2008) [28]. Unlike
previous findings by Aluri et al. (2016) demonstrating that sociality affects behavior intentions [87],
this result shows that sociality does not affect the user’s travel intentions, which does not support
H8. Nevertheless, travel intentions can be effectively reinforced by enhancing the amusement and
entertainment facilitated by WOAs.
6.3. Self-Service Motivation
Self-service factors have no significant effect on either usage intentions or travel intentions; that is,
H2 and H6 are not supported. Generally speaking, all travel-related WOAs now possess a reservation
feature. WOAs also offer other self-service features, such as audio services, navigation maps, and
membership offers [88]. However, the present study found that these features do not influence either
usage intentions or travel intentions. It is recommended, therefore, that WOAs reduce the focus
on these features. The reason for these features’ lack of influence, as inferred by the author, is thatSustainability 2020, 12, 6108 12 of 17
these self-services can all be substituted by specialized platforms or media. Use of navigation maps,
for example, may be undermined by users’ preference for more dedicated applications such as Gaode
Maps, Baidu Maps, and Google Maps.
These findings underline the dominant role of social interaction for WOAs users’ usage intentions,
the dominant role of information for WOA users’ travel intentions, and the mediating effect of usage
intentions on travel intentions.
Our study aims to equip marketing analysts and executives with insights that can be implemented
in the future. According to the results, the travel-related WOAs will be designed to be more entertaining.
Reviews, photos, and videos shared via WOAs or online platforms motivate users to visit a place, attend
an event, or buy a product. The real-time access to relevant tips and guides, traveling instructions,
or inspirational photos/videos has ultimately changed the way users plan an activity, which almost is
to increase tourists [89]. Furthermore, big data from the WOAs and mobile device signaling elucidates
wider patterns of tourist movement, as applied to forecast travel demands and sustainable management
of a destination [90].
7. Conclusions and Limitations
There are three implications of the research ranging from theory to practice for sharpening the
skills of tourism managers.
7.1. Improve the Social Design of Interfaces in Order to Enhance Usage Intentions
This study has shown that social gratification constitutes the foremost factor influencing WOA
users’ usage intentions and serves as a means by which travel-related WOAs can stay connected with
users (who can meet new friends through traveling and interact through the WOAs). Regardless
of how such relationships are formed, travel-related WOAs should preferably establish features for
interacting and socializing in order to better enhance usage intentions. For instance, they could make
announcements through notifications and promote a transition from one-way communication with
users to many-way interactions involving relevant parties.
7.2. Enhancing Travel Intentions by Enriching the Content Published
This study found that information is the primary factor influencing users’ travel intentions,
and that they can also be enhanced by a high level of entertainment. Hence, WOA managers should
publish professional information that is useful for users, such as information that can help travelers
make informed travel-related decisions, enhancing their usage intentions. WOAs can also enrich the
content published via various other means. For instance, travel information could be presented in the
form of building an information recommender system for users according to the similarities in groups
of people [91].
7.3. Reducing Focus on Self-Service Features
Travel-related WOAs offer self-services including ticket reservations (entry tickets and other
reservations), navigation maps, online shopping, online customer services, and member centers [63].
Despite their appeal to users, however, this study proved that they fail to enhance users’ usage
and travel intentions. Thus, travel-related WOAs should remove some or all of these features and
focus on the advantages of the WOA design, which relate to information, entertainment, and social
gratification. Efforts should be made to enhance features such as information regarding tourist
attractions, characteristic activities and attractions, recommended itineraries, nearby services, city
guides, audio guides, and reviews and comments, as well as opportunities for interactions among
travelers, as such features gratify users’ information, entertainment, and social needs.
As with all studies, the present study has some limitations. First, as it focused on travel-related
WOAs in China, the results might be limited to the Chinese population. Caution should be exercised
when extrapolating the results to other countries and other social media; and future studies shouldSustainability 2020, 12, 6108 13 of 17
take into consideration the effects of cultural differences on usage intentions in the social media
context. Second, as this study adopted Sojump as the source of its sample, the responses might exhibit
randomness, which could have led to bias in the results. Therefore, this study merely represents an
exploratory attempt, and despite the satisfactory outcomes of the structural equation model, a more
in-depth investigation is still warranted. Third, this study illustrated usage and travel motivations
associated with the use of travel-related WOAs using various dimensions; future studies on WOAs
should attempt to validate the factors that influence usage and travel intentions by exploring more
combinations of motivations.
Author Contributions: Conceptualization and methodology, B.-S.L. and Y.-J.L.; writing—review and editing,
B.-S.L., conceptualization, methodology, data curation, and writing—original draft preparation, Y.W. All authors
read and approved the manuscript.
Funding: This research was funded by Internet Innovation Research Center—The College’s Research Base of
Humanities and Social Science in Fujian Province, Minjiang University (Grant No. IIRC20190106), and Young and
Middle-aged Teachers’ Educational Research Project of Fujian Province (Grant No. JAS160415 ).
Conflicts of Interest: The authors declare no conflict of interest.
Appendix A Constructs and Items
Information motivation and gratification (I) [23]
I1: This WOAs allows me to find the information I desire with ease.
I2: This WOA allows me to find the exact information I desire.
I3: This WOA allows me to promptly find the information I desire.
Self-service motivation and gratification (S-S) [92]
S-S1: This WOA allows me to complete self-service tasks with ease.
S-S2: This WOA allows me to quickly complete self-service tasks.
S-S3: This WOA allows me to satisfactorily complete self-service tasks.
Entertainment motivation and gratification (E) [93]
E1: I feel happy when using this WOA.
E2: I feel amused when using this WOA.
E3: I think it is cool to use this WOA.
Social motivation and gratification (S) [22,35]
S1: I have made many friends through this WOA.
S2: This WOA has many topics of common interest for me and my friends.
S3: Many of my friends have also subscribed to this WOA.
Usage intention (UI) [94,95]
UI1: This WOA is worth following and using in the future.
U12: I will continue to follow and use this WOA in the future.
U13: I will recommend this travel-related WOA to my family or friends.
Travel intention (TI) [96]
TI1: I will visit a city recommended by the travel-related WOA.
TI2: I will revisit a city recommended by the travel-related WOA.
References
1. Tencent. Communications and Social. Available online: https://www.tencent.com/en-us/business.html
(accessed on 30 December 2019).
2. Xu, J.; Kang, Q.; Song, Z.; Clarke, C.P. Applications of mobile social media: WeChat among academic libraries
in China. J. Acad. Librariansh. 2015, 41, 21–30. [CrossRef]
3. Yu, X.; Zhao, T.; Tong, S. Development Report on China’s WeChat in 2014. In Development Report on China’s
New Media; Springer: Singapore, 2017; pp. 63–78.Sustainability 2020, 12, 6108 14 of 17
4. WeChat Demographics and Insights. WeChat Data, Insights and Statistics: User Profile, Behaviours, Usages,
Market Trends. Available online: https://wechatwiki.com/wechat-resources/wechat-data-insight-trend-
statistics (accessed on 2 July 2020).
5. Tang, C.; Li, X.; Gu, H. Concentrate on tourism scholars at home and abroad to build the China Youth
Tourism Forum. Resour. Sci. 2019, 41, 415.
6. Ministry of Culture and Tourism. Basic Situation of the Tourism Market in 2019. Available online:
https://www.mct.gov.cn/whzx/whyw/202003/t20200310_851786.htm (accessed on 10 March 2020).
7. Tang, M. Research on Wechat Marketing Strategy of Enterprises which is based on the SICAS Model. Int. J.
Bus. Soc. Sci. 2014, 5, 213–217.
8. Kim, D.; Kim, S. The role of mobile technology in tourism: Patents, articles, news, and mobile tour appreviews.
Sustainability 2017, 9, 2082. [CrossRef]
9. Mariani, M.M.; Di Felice, M.; Mura, M. Facebook as a destination marketing tool: Evidence from Italian
regional Destination Management Organizations. Tour. Manag. 2016, 54, 321–343. [CrossRef]
10. Liang, X.; Yang, Y. An experimental study of Chinese tourists using a company-hosted WeChat official
account. Electron. Commer. Res. Appl. 2018, 27, 83–89. [CrossRef]
11. Lu, J.; Mao, Z.; Wang, M.; Hu, L. Goodbye maps, hello apps? Exploring the influential determinants of travel
app adoption. Curr. Issues Tour. 2015, 18, 1059–1079. [CrossRef]
12. Sun, F.; Wang, T. Somehospital Emergency triage group makes an attempt to extend medical humanistic
service around the construction of Wechat official account. Chin. J. Pract. Nurs. 2017, 33, 2230–2231.
13. Tu, S.; Yan, X.; Jie, K.; Ying, M.; Huang, C. WeChat: An applicable and flexible social app software for mobile
teaching. Biochem. Mol. Biol. Educ. 2018, 46, 555–560. [CrossRef]
14. Xu, S.; Hemminger, B.M. Lessons learned from the investigation of academic WeChat official accounts.
In Proceedings of the iConference 2019, Washington, DC, USA, 31 March 2019.
15. Walkthechat. WeChat Impact Report 2018. Available online: http://www.199it.com/archives/725398.html
(accessed on 18 May 2018).
16. Xing, L.; Deng, K.; Wu, H.; Xie, P.; Gao, J. Behavioral Habits-Based User Identification Across Social Networks.
Symmetry 2019, 11, 1134. [CrossRef]
17. Tian, M.; Xu, G. Exploring the determinants of users’ satisfaction of WeChat official accounts. In Proceedings
of the 2017 3rd International Conference on Information Management (ICIM) IEEE, Chengdu, China, 21–23
April 2017; pp. 362–367.
18. Shah, D.V.; McLeod, J.M.; Yoon, S.H. Communication, context, and community: An exploration of print,
broadcast, and Internet influences. Commun. Res. 2001, 28, 464–506. [CrossRef]
19. Shao, C.; Kwon, K.H. Clicks intended: An integrated model for nuanced social feedback system uses on
Facebook. Telemat. Inform. 2019, 39, 11–24. [CrossRef]
20. Pal, A. Motivations of Individuals Participating in Social Media: A Cultural Perspective. J. Mod. Account. Audit.
2018, 14, 315–332.
21. Zhang, L.; Jung, E.H. WeChatting for health: An examination of the relationship between motivations and
active engagement. Health Commun. 2019, 34, 1764–1774. [CrossRef]
22. Chang, Y.P.; Zhu, D.H. Understanding social networking sites adoption in China: A comparison of
pre-adoption and post-adoption. Comput. Hum. Behav. 2011, 27, 1840–1848. [CrossRef]
23. Kim, Y.; Sohn, D.; Choi, S.M. Cultural difference in motivations for using social network sites: A comparative
study of American and Korean college students. Comput. Hum. Behav. 2001, 27, 365–372. [CrossRef]
24. Zhang, L.; Pentina, I. Motivations and usage patterns of Weibo. Cyberpsychol. Behav. Soc. Netw. 2012, 15,
312–317. [CrossRef]
25. Gan, C.; Wang, W. Uses and gratifications of social media: A comparison of microblog and WeChat. J. Syst.
Inf. Technol. 2015, 17, 351–363. [CrossRef]
26. Pennington-Gray, L.; Schroeder, A.; Kaplanidou, K.K. Examining the influence of past travel experience,
general web searching behaviors, and risk perceptions on future travel intentions. IJSSTH 2011, 1, 64–89.
27. Mendes-Filhoa, L.; Corrêab, C.; Mangueirab, M. Online Travel Reviews on Mobile Applications when making
travel plans: Uses and Gratifications perspectives. Inf. Commun. Technol. Tour. 2015, 6, 59–72.
28. Huang, E. Use and gratification in e-consumers. Internet Res. 2008, 18, 405–426. [CrossRef]
29. Luo, X. Uses and gratifications theory and e-consumer behaviors: A structural equation modeling study.
J. Interact. Advert. 2002, 2, 34–41. [CrossRef]Sustainability 2020, 12, 6108 15 of 17
30. Rubin, A.M. The effect of locus of control on communication motivation, anxiety, and satisfaction. Commun. Q.
1993, 41, 161–171. [CrossRef]
31. Rubin, A.M. Uses-and-gratifications perspective on media effects. In Media Effects; Routledge: New York,
NY, USA, 2009; pp. 181–200.
32. Kowatsch, T.; Maass, W. In-store consumer behavior: How mobile recommendation agents influence usage
intentions, product purchases, and store preferences. Comput. Hum. Behav. 2010, 26, 697–704. [CrossRef]
33. Jung, T.; Youn, H.; McClung, S. Motivations and self-presentation strategies on Korean-based “Cyworld”
weblog format personal homepages. Cyberpsychol. Behav. 2007, 10, 24–31. [CrossRef] [PubMed]
34. Wei, R. Motivations for using the mobile phone for mass communications andentertainment. Telemat. Inform.
2008, 25, 36–46. [CrossRef]
35. Raacke, J.; Bonds-Raacke, J. MySpace and Facebook: Applying the uses and gratifications theory to exploring
friend-networking sites. Cyberpsychol. Behav. 2008, 11, 169–174. [CrossRef]
36. Brandtzæg, P.B.; Heim, J. Why people use social networking sites. In Proceedings of the International
Conference on Online Communities and Social Computing, San Diego, CA, USA, 19–24 July 2009; pp. 143–152.
37. Li, H.; Liu, Y.; Xu, X.; Heikkilä, J.; Van Der Heijden, H. Modeling hedonic is continuance through the uses
and gratifications theory: An empirical study in online games. Comput. Hum. Behav. 2015, 48, 261–272.
[CrossRef]
38. Liu, I.L.; Cheung, C.M.; Lee, M.K. User satisfaction with microblogging: Information dissemination versus
social networking. J. Assoc. Inf. Sci. Technol. 2016, 67, 56–70. [CrossRef]
39. Zhang, C.B.; Li, Y.N.; Wu, B.; Li, D.J. How WeChat can retain users: Roles of network externalities, social
interaction ties, and perceived values in building continuance intention. Comput. Hum. Behav. 2017, 69,
284–293. [CrossRef]
40. Hwang, H.S.; Cho, J. Why Instagram? Intention to continue using Instagram among Korean college students.
Soc. Behav. Personal. Int. J. 2018, 46, 1305–1315. [CrossRef]
41. Zhu, W. Analysis of the Application of Big Data in Intelligent Tourism Mode. In Proceedings of the 2016 4th
International Conference on Electrical Electronics Engineering and Computer Science (ICEEECS 2016), Jinan,
China, 15–16 October 2016.
42. Lin, H.F.; Chen, C.H. Combining the Technology Acceptance Model and Uses and Gratifications Theory
to examine the usage behavior of an Augmented Reality Tour-sharing Application. Symmetry 2017, 9, 113.
[CrossRef]
43. Lu, Y.; Jin, C.; Qiu, J.; Jiang, P. Using a hybrid multiple-criteria decision-making technique to identify key
factors influencing microblog users’ diffusion behaviors in emergencies: Evidence from generations born
after 2000. Symmetry 2019, 11, 265. [CrossRef]
44. Dann, G.M. Tourist motivation an appraisal. Ann. Tour. Res. 1981, 8, 187–219. [CrossRef]
45. Iso-Ahola, S.E.; Allen, J.R. The dynamics of leisure motivation: The effects of outcome on leisure needs.
Res. Q. Exerc. Sport 1982, 53, 141–149. [CrossRef] [PubMed]
46. Kotler, P. Marketing Management-Analysis, Planning, Implementation, and Control; Prentice Hall: London,
UK, 1994.
47. Armstrong, G.; Adam, S.; Denize, S.; Kotler, P. Principles of Marketing; Pearson: Camberwell, Australia, 2014.
48. Prayag, G.; Chen, N.; Del Chiappa, G. Domestic tourists to Sardinia: Motivation, overall attitude, attachment,
and behavioural intentions. Anatolia 2018, 29, 84–97. [CrossRef]
49. Brown, G.; Assaker, G.; Reis, A. Visiting Fortaleza: Motivation, satisfaction and revisit intentions of spectators
at the Brazil 2014 FIFA World Cup. J. Sport Tour. 2018, 22, 1–19. [CrossRef]
50. Wen, J.; Huang, S. The effects of push and pull travel motivations, personal values, and destination familiarity
on tourist loyalty: A study of Chinese cigar tourists to Cuba. Asia Pac. J. Tour. Res. 2019, 24, 805–821.
[CrossRef]
51. Khan, M.J.; Chelliah, S.; Ahmed, S. Intention to visit India among potential travellers: Role of travel
motivation, perceived travel risks, and travel constraints. Tour. Hosp. Res. 2019, 19, 351–367. [CrossRef]
52. Woodside, A.G.; Lysonski, S. A general model of traveler destination choice. J. Travel Res. 1989, 27, 8–14.
[CrossRef]
53. Mannell, R.C.; Iso-Ahola, S.E. Psychological nature of leisure and tourism experience. Ann. Tour. Res. 1987,
14, 314–331. [CrossRef]You can also read