The effects of educational disruption on primary school attainment in summer 2021
←
→
Page content transcription
If your browser does not render page correctly, please read the page content below

The effects of educational
disruption on primary
school attainment in
summer 2021
An analysis of attainment in reading, maths and grammar,
punctuation and spelling in mainstream state schools in England.
This study looks at the impact on performance of deprivation
levels, location, subject and year group.

August 2021
Katie Blainey, RS Assessment from Hodder Education
Timo Hannay, SchoolDash

IN COLLABORATION WITH

   Introduction
   Throughout the 2020-21 academic year we have analysed the aggregated results from attainment
   tests to help understand the effects that ongoing disruption due to the pandemic are having on
   primary children’s learning. This year has posed many challenges to schools, including an extended
   national lockdown in the spring term and high absence rates in the summer term due to large
   numbers of Covid-19 cases and subsequent isolation by children and teachers. Throughout all this,
   schools have supported children in their learning through a mixture of both in-class and remote
   teaching, often running both side-by-side.

   This paper reflects on the progress made by children throughout this academic year and compares
   their test performance to those of pre-pandemic cohorts in order to reveal the subjects and groups
   of children that may need more support in the new academic year. Throughout this paper, expert
   educationalists reflect on their experience and provides suggestions for focus next year.

   The analysis of attainment test results at a national level creates a valuable opportunity to
   understand broad disparities in learning and help to direct the focus of educators and policymakers.
   We acknowledge that attainment tests are only one measure of a child’s development and intend
   this analysis to be considered alongside other research in this area, not least the impact on children’s
   social development, wellbeing and mental health.

   Analysis in summer 2021
   This paper analyses attainment among primary pupils in England at the end of the 2020-21
   academic year. It uses aggregate results from more than 250,000 primary school tests from more
   than 1000 schools taken in the summer 2021 and compares these to the results from the last
   uninterrupted summer term in 2019. These tests include Progress in Reading Assessment (PiRA),
   Progress in Understanding Mathematics Assessment (PUMA) and Progress in Grammar, Punctuation
   and Spelling Assessment (GAPS), provided by RS Assessment from Hodder Education. Detailed
   analysis is focused on the results at the end of the summer term; to compare with prior analysis of the
   end of spring and autumn terms see the other papers on: risingstars-uk.com/whitepaper

   Key findings
   • A strong focus on reading in schools and home resulted in attainment close to prior cohort for Years
     2 to 6 by the end of the academic year

   • In maths and grammar, punctuation and spelling (GPS) the gaps in attainment for most year
     groups were smaller at the end of the summer term, when compared to the spring, however there
     are still gaps with the largest in GPS

   • Across all subjects the younger year groups (KS1) are showing the largest drops in attainment and
     therefore needing the most support

   • The gap in average attainment between those eligible for Pupil Premium and their peers continued
     to grow across the majority of year groups and subjects

   • Had the National Tests in Year 6 been held this year it is likely only reading would have had a similar
     number of pupils reaching the expected standard as prior years

To download this white paper, visit risingstars-uk.com/whitepaper21                                            2
IN COLLABORATION WITH

   Reading performance in 2020-21
   Reading attainment close to prior years for Years 2 to 6
   As the 2020-21 academic year concludes we are now able to see the pattern of changes in
   attainment across all three terms, shown in Figure 1 which displays the change in mean Standardised
   Score points between the current and prior cohort of children. These results in reading indicate a
   relatively positive picture for children in Years 2 to 6: by the end of the summer term 2021, average
   results were close to those in summer 2019.

   To help understand how differences in mean
   Standardised Scores correspond to time spent                                          Matthew Wynne, Primary Regional Director,
   learning, we can translate effect sizes using a                                       United Learning
   method developed by the Education Endowment                                           “The reading analysis very much mirrors our
   Foundation (EEF)1, the results of which are                                           internal data. Remote learning had a strong
   summarised in Figure 2.                                                               focus on reading and vocabulary, which
   The results suggest that most support is needed for                                   continued seamlessly into the classrooms.
   Year 1 children, who may be as much as 3 months                                       A focus on vocabulary and comprehension
   behind previous cohorts. Most older year groups                                       was needed when pupils were back in class.”
   were about a month behind.

   Figure 1: Change in Standardised Scores for reading (PIRA) 2020-21

   1
     Effect sizes were calculated by dividing the difference in Standardised Score points between prior and current
   cohorts by the standard deviation of the prior cohort. These were converted to months using the EEF table, see:
   educationendowmentfoundation.org.uk/evidence-summaries/about-the-toolkits/attainment

To download this white paper, visit risingstars-uk.com/whitepaper21                                                                    3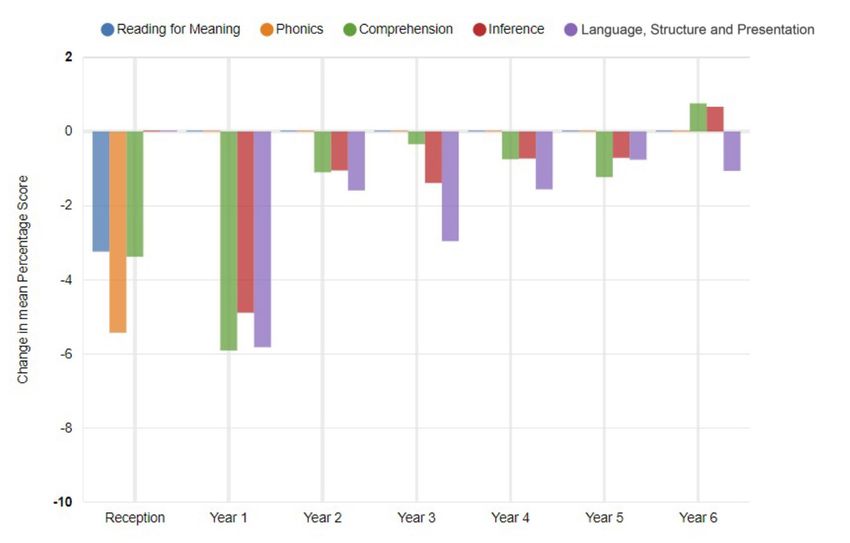
IN COLLABORATION WITH

   Maddy Barnes, English author and editor
   “Schools can continue to use the EEF recommendations for literacy when planning their
   reading curriculum for these pupils as they begin year 2. With both a phonics screening
   check in the autumn term and a KS1 reading test in summer, teachers will need to ensure
   that there is a balance between the teaching of phonics and comprehension skills. Where
   schools have had great success in this area, they have used guided reading sessions as
   a vehicle to explicitly model and teach comprehension skills (focusing on high-quality
   children’s literature).”

   Figure 2: Effect sizes and months’ progress gap for reading (PIRA) 2020-21

                   Autumn                                Spring                                Summer

     Year          Effect              Months            Effect             Months             Effect             Months
                   size                                  size                                  size

     1             -0.14               -2                -0.30              -4                 -0.23              -3

     2             -0.05               -1                -0.20              -3                 -0.05              -1

     3             -0.07               -1                -0.13              -2                 -0.08              -1

     4             -0.01               0                 -0.11              -2                 -0.05              -1

     5             0.01                0                 -0.13              -2                 -0.05              -1

     6             0.01                0                 -0.17              -2                 -0.02              -1

   Year 1 disadvantaged pupils fall further behind in reading
   A major concern during the pandemic has been that disadvantaged pupils may have been more badly
   affected than their peers, exacerbating any longstanding educational disparities. To explore this, we
   used Pupil Premium status as a proxy for disadvantage. (Individual Pupil Premium status is stored
   against many of the test results where schools have chosen to add it.2)

   Figure 3 shows the differences in mean Standardised Scores between Pupil Premium and non-Pupil
   Premium children for cohorts who sat reading tests in summer 2019 (blue columns) and summer
   2021 (orange columns). The gap appears to have grown significantly among children in Year 1.
   Encouragingly, the changes in other year groups are much less significant and the gaps far smaller
   than we saw at the end of the 2020 autumn term. Nevertheless, since this gap amounted to 5- or
   6-months even before the pandemic struck, much work remains to be done.

   2
     We analysed only those schools with overall Pupil Premium percentages in MARK that were broadly consistent with the proportion reported
   publicly for that school by the Department for Education, and omitted any pupils with unknown Pupil Premium status, resulting in a smaller
   number of results for this section.

To download this white paper, visit risingstars-uk.com/whitepaper21                                                                             4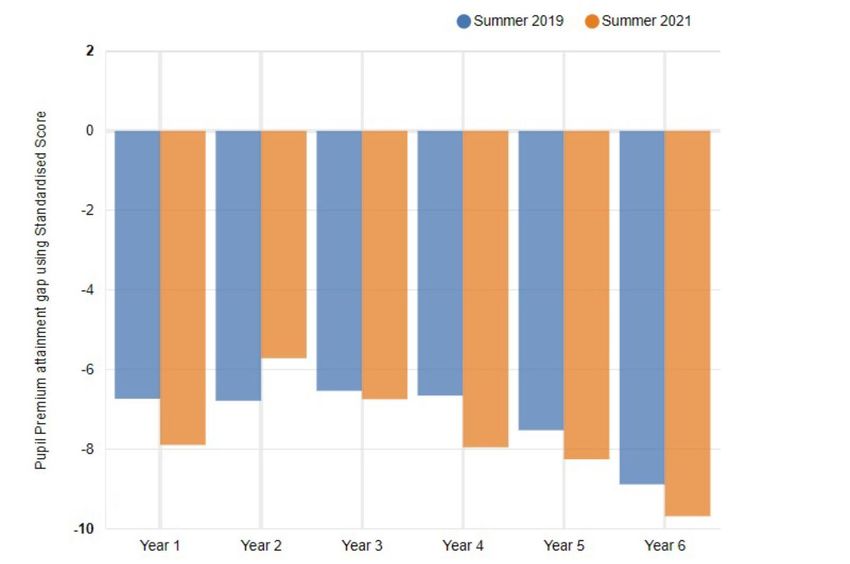
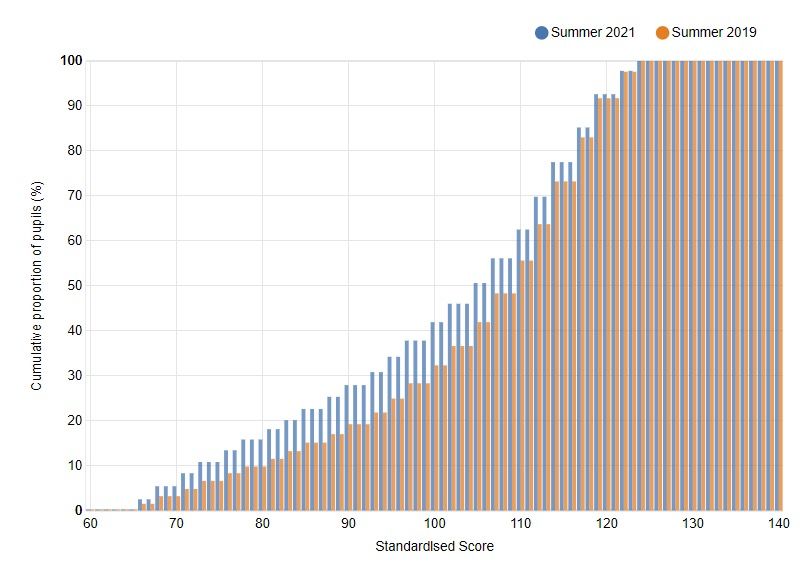
IN COLLABORATION WITH

   Matthew Wynne, Primary Regional Director, United Learning
   “This is really powerful data, it adds further weight to the work that takes place in the EYFS.
   The Y1 cohort had a disrupted Reception year as well as a disrupted Y1, as a result their
   Phonics and vocabulary development has been negatively impacted.

   The EYFS/vocabulary situation has been compounded for Pupil Premium children. Reduced
   access to, and stimulus from, high-quality texts and adult modelled reading/speaking has
   shown up in these results.”

   Figure 3: Difference in Standardised Scores between Pupil Premium and non-Pupil Premium pupils
   for summer tests in reading (PIRA)

   Year 6 sample size was too small to be representative

   These changes in mean score often represent complex underlying patterns. Figure 4 shows the
   cumulative distribution of scores for the Year 1 summer term reading papers, comparing 2019 (orange
   columns) to 2021 (blue columns). It is noticeable that pupils at the lower end of the attainment scale
   were disproportionately affected.

To download this white paper, visit risingstars-uk.com/whitepaper21                                         5
IN COLLABORATION WITH

   Figure 4: Distribution of Standardised Scores for summer Year 1 test in reading (PIRA)

To download this white paper, visit risingstars-uk.com/whitepaper21                           6
IN COLLABORATION WITH

   Year 6 pupils broadly on track in reading
   In contrast, Year 6 reading results show very similar distributions in 2019 and 2021. In addition, the
   percentage of pupils who reached a Standardised Score of 94, and therefore may have gone on to
   achieve the expected standard in the National Test, was stable across the 2019 and 2021 cohorts3.

   Figure 5: Distribution of Standardised Scores for summer Year 6 test in reading (PIRA)

   Matthew Wynne, Primary Regional Director, United Learning
   “It is seen that Y6 did have stronger progress in the summer term, some of
   this is due to their wider engagement in remote learning, as well as a specific
   focus upon end of Key Stage outcomes from schools/staff.”

   3
     The 2018 National Test correlation study indicated a high correlation between the outcomes of the RSA tests and the National Tests
   www.risingstars-uk.com/specialpages/assessment/old-pira-pages/test

To download this white paper, visit risingstars-uk.com/whitepaper21                                                                       7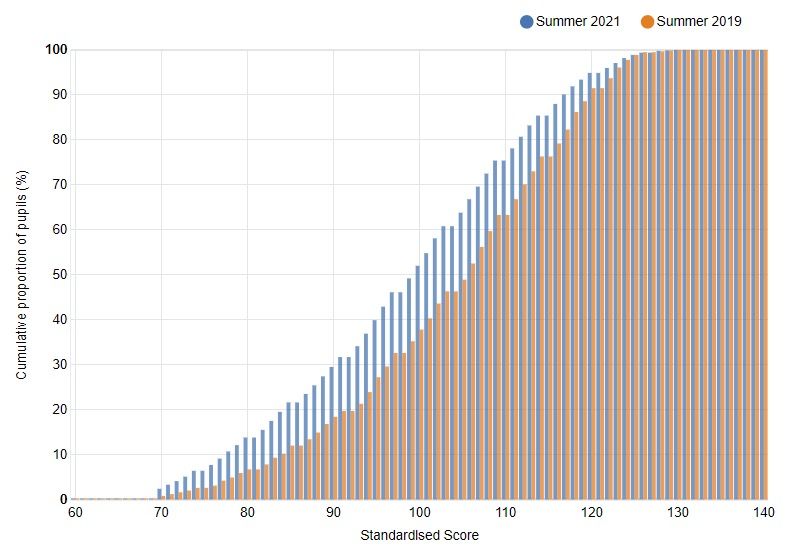
IN COLLABORATION WITH

   Reading topic analysis
   Figure 6 provides a more detailed look at changes in reading performance by showing the changes
   in mean Percentage Score for each topic covered in the tests. Reception pupils are included in this
   analysis4, highlighting the fact that they, like Year 1 pupils, showed a substantial drop in attainment.

   Figure 6: Change in mean Percentage Score from 2019 to 2021 in reading (PIRA) summer tests

   Maddy Barnes, English author and editor
   “In light of the new Early Adopter Early Learning Goals where reading is now separated into
   ‘Comprehension’ and ‘Word Reading’ schools will need to ensure that there is a consistent
   approach throughout EYFS and into KS1. After auditing early reading in many EYFS settings
   over the last two academic years, I have found that schools are teaching, modelling and
   providing far more opportunities for teaching comprehension than they realised/documented.”

   4
       PIRA Reception data is excluded from overall Standardised Score analysis as these results are not representative

To download this white paper, visit risingstars-uk.com/whitepaper21                                                           8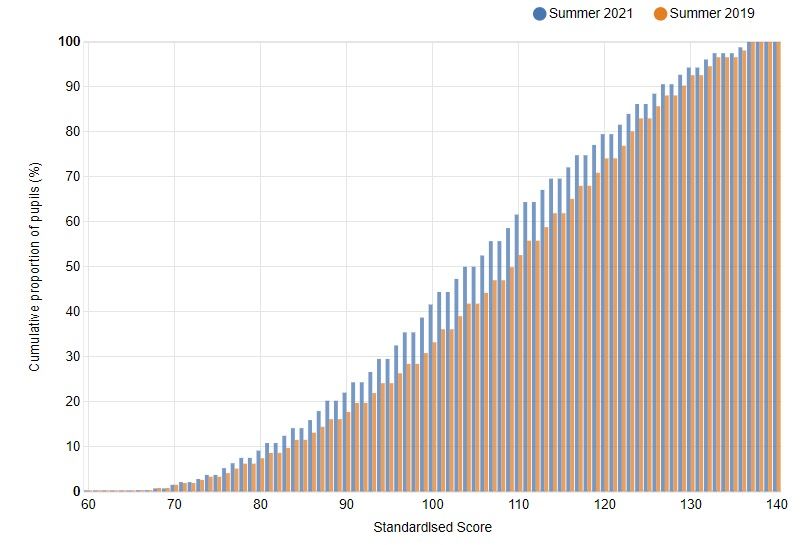
IN COLLABORATION WITH

   Grammar, Punctuation and Spelling performance
   in 2020-21
   Most year groups showed improved performance compared to the spring term
   Figure 7 shows the changes in attainment across the three terms for grammar, punctuation and
   spelling (GPS). It is encouraging to see all year groups except Year 6 with smaller declines than at the
   end of the spring term, though declines relative to previous cohorts are substantial and considerably
   larger than at the end of the 2020 autumn term. Translating these changes in mean Standardised
   Scores to effect sizes and months (see page 3 for definition), Figure 8 indicates that these declines
   could mean that most children are 2-3 months behind, with Year 6 further behind still.

   Figure 7: Change in mean Standardised Scores for Grammar, Punctuation and Spelling (GAPS)
   2020-21

   Maddy Barnes, English author and editor
   “Schools should feel empowered by this – clear evidence that consistent teaching will result
   with progress. Prioritising reviewing previous GPS learning in the autumn term and dripping
   some new GPS within modelled and shared writing sessions will ensure pupils can consolidate
   learning whilst being exposed to some new features.”

To download this white paper, visit risingstars-uk.com/whitepaper21                                           9
IN COLLABORATION WITH

   Figure 8: Effect sizes and months’ progress gap for Grammar, Punctuation and Spelling (GAPS)
   2020-21

              Autumn                      Spring                      Summer

    Year      Effect size   Months        Effect size   Months        Effect size   Months

    1         -0.17         -2            -0.33         -4            -0.26         -3

    2         -0.11         -2            -0.31         -4            -0.23         -3

    3         -0.12         -2            -0.22         -3            -0.18         -2

    4         -0.10         -1            -0.21         -3            -0.15         -2

    5         -0.05         -1            -0.19         -3            -0.16         -2

    6         -0.10         -2            -0.30         -4            -0.37         -4

   Disadvantaged pupils further behind their peers in GPS
   In contrast to the encouraging picture shown in Figure 3 for pupils in reading, Figure 9 shows the
   difference between Pupil Premium pupils and non-Pupil Premium pupils grew in GPS. As in the
   autumn, the disparity grew from 5 months to 6 months across most years, whilst the in Year 1 it could
   be as big as 7 months.

   Figure 9: Difference in Standardised Scores between Pupil Premium and non-Pupil Premium pupils
   for summer tests in Grammar, Punctuation and Spelling (GAPS)

To download this white paper, visit risingstars-uk.com/whitepaper21                                        10
IN COLLABORATION WITH
More Year 6 pupils likely to have missed the mark in GPS
Year 6 showed the largest fall in GPS attainment, Figure 10 shows the cumulative distribution of
scores for the summer term papers, comparing 2019 (orange columns) to 2021 (blue columns). This
shows a pattern of underperformance across the attainment range.
In contrast to the positive picture seen in reading, the test results in GPS show an additional 13%
of children may have failed to achieve the expected standard in the GPS Year 6 National Test had
it taken place this year. This was calculated by comparing the percentage of pupils who reached a
Standardised Score of 945 in the 2019 GPS summer paper with the corresponding group in 2021.
Figure 10: Distribution of Standardised Scores for summer Year 6 test in Grammar, Punctuation
and Spelling (GAPS)
5
The 2018 National Test correlation study indicated a high correlation between the outcomes of the tests and the National Tests
www.risingstars-uk.com/specialpages/assessment/old-pira-pages/test
To download this white paper, visit risingstars-uk.com/whitepaper21 11IN COLLABORATION WITH The topic analysis in Figure 11 gives a more detailed breakdown of this under-performance among Year 6 pupils. Secondary schools may need to give extra support to ensure that their new intake of Year 7 children have mastered these more technical aspects of English before progressing to the usual Key Stage 3 curriculum. Figure 11: Change in mean Percentage Score from 2019 to 2021 in grammar, punctuation and spelling (GAPS) summer tests To download this white paper, visit risingstars-uk.com/whitepaper21 12
IN COLLABORATION WITH

   Certain school types fared worse in GPS tests
   Previous analyses have shown that school type and location can affect changes in attainment. The
   following section presents examples of these trends for GPS.

   Figure 12 shows that falls in attainment tended to be larger in schools with a higher proportion of
   children eligible for Free School Meals (FSM). It is also possible to look at the effects of poverty by
   local area using the Income Deprivation Affecting Children Index6 (IDACI). Figure 13 shows that
   declines in attainment are higher in schools located in areas that have greater deprivation (high
   IDACI), particularly in Years 4 and 5. The final figure in this section, Figure 14, shows the change in
   attainment by region, and indicates greater attainment declines in the North.

   Figure 12: Change in mean Standardised Scores from 2019 to 2021 for summer tests in grammar,
   punctuation and spelling (GAPS) by school deprivation

   Maddy Barnes, English author and editor
   “Most schools have evaluated the impact home-learning has had on their pupils. Although
   school leaders are beginning the 2021-2022 school year with high hopes for ‘business as
   usual,’ we cannot forget the experiences of home-learning that some pupils had. The teaching
   of GPS can be compared to that of maths in a sense of arithmetic and reasoning. Teachers will
   provide a GPS curriculum that provides time for pupils to practise skills and then investigate,
   reason and indeed apply the GPS in their own writing.”

   6
       IDACI is part of the government’s indices of deprivation: https://www.gov.uk/government/statistics/english-indices-of-deprivation-2019

To download this white paper, visit risingstars-uk.com/whitepaper21                                                                             13
IN COLLABORATION WITH Figure 13: Change in mean Standardised Scores from 2019 to 2021 for summer tests in grammar, punctuation and spelling (GAPS) by local deprivation Figure 14: Change in mean Standardised Scores from 2019 to 2021 for summer tests in grammar, punctuation and spelling (GAPS) by region To download this white paper, visit risingstars-uk.com/whitepaper21 14
IN COLLABORATION WITH

   Maths performance in 2020-21
   KS2 children improved performance since spring term
   This final section provides some analysis of the performance in maths. Figure 15 shows improvements
   across all years since the spring term for KS2 maths, younger year groups, however, still showed large
   declines in summer 2020 compared to 2019. Figure 16 translates the mean Standardised Score
   changes to effect sizes and months (see page 3 for explanation), indicating that children are on
   average 2-3 months behind previous cohorts.

   Figure 15: Change in mean Standardised Scores for maths (PUMA) 2020-21

   Matthew Wynne, Primary Regional Director, United Learning
   “This very much mirrors our data, showing good progress since the autumn/spring data in
   most cases, but still some way behind the expected curve for these cohorts.

   The DfE Ready to Progress Criteria has really begun to unpick the core expectations in maths,
   this is now allowing the staff to plan to meet the identified gaps in learning. Number is the
   key area of focus, if the pupil’s number knowledge is not 100% secure, all other strands of
   maths are also weaker.

   Some elements of the mastery curriculum have been massively impacted due to Covid-19.
   The past 18 months have shown that the foundations for learning are not totally solid, as
   a result loss of learning is rapid, and catch-up is slow. Hence the need for a focussed core
   approach to maths in 21/22. The DfE approach mirrors this and is welcomed.”

To download this white paper, visit risingstars-uk.com/whitepaper21                                         15
IN COLLABORATION WITH

   Figure 16: Effect sizes and months’ progress gap for maths (PUMA) 2020-21

                  Autumn                                Spring                 Summer

     Year         Effect size         Months            Effect size   Months   Effect size   Months

     R                                                                         -0.24         -3

     1            -0.09               -1                -0.26         -3       -0.18         -2

     2            -0.04               -1                -0.21         -3       -0.21         -3

     3            -0.09               -1                -0.19         -3       -0.15         -2

     4            -0.06               -1                -0.18         -2       -0.13         -2

     5            -0.09               -1                -0.21         -3       -0.11         -2

     6            -0.02               -1                -0.22         -3       -0.18         -2

   Disadvantage gap grows further in maths
   In the autumn we saw the maths attainment gap grow between Pupil Premium and non-Pupil
   Premium pupils, Figure 17 below shows that this gap has continued to grow across most year groups,
   with the largest gap in Year 6. The gaps equate to around 6 months of learning between the two
   groups, or even 7 months for Year 6 pupils.

   Figure 17: Difference in Standardised Scores between Pupil Premium and non-Pupil Premium
   pupils for summer tests in maths (PUMA)

   The Reception sample size was too small to be representative

To download this white paper, visit risingstars-uk.com/whitepaper21                                      16
IN COLLABORATION WITH
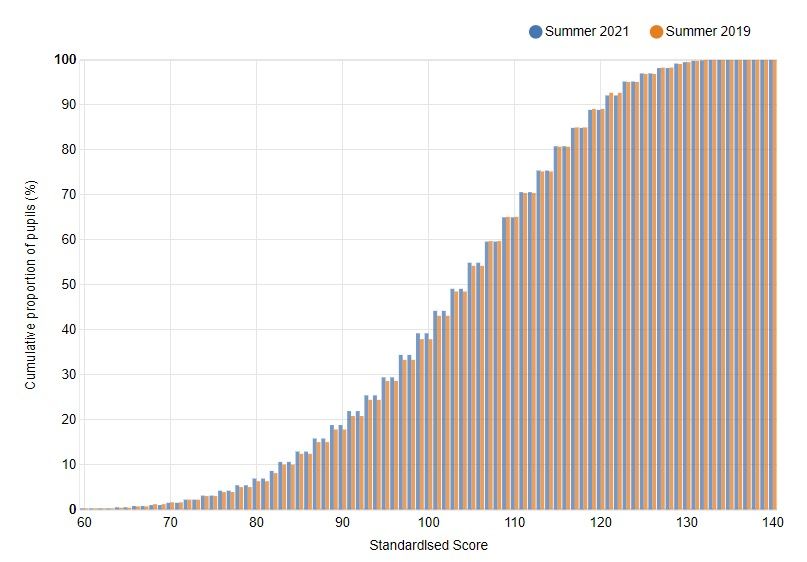
More Year 6 pupils behind in maths
Figure 18 shows the cumulative distribution of scores for the Year 6 maths summer term papers,
comparing 2019 (orange columns) to 2021 (blue columns). The pattern shows pupils in the middle of
the scale were disproportionately affected in 2021.
Comparing the percentage of pupils who reached a Standardised Score of 94 in their maths summer
paper in both 2019 and 2021, there was a small decline in performance. This means around 5% more
Year 6 pupils might have failed to achieve the expected standard in the maths National Test in 2021
had it taken place7.
Figure 18: Distribution of Standardised Scores for summer Year 6 test in maths (PUMA)
7
The 2018 National Test correlation study indicated a high correlation between the outcomes of the tests and the National Tests
www.risingstars-uk.com/specialpages/assessment/old-pira-pages/test
To download this white paper, visit risingstars-uk.com/whitepaper21 17IN COLLABORATION WITH Highest drops seen in geometry scores Figure 19 shows the change in mean Percentage Score for the different topics covered by the maths papers. Across all years, declines in number tended to be the smallest whilst geometry saw much larger declines. Year 6 children starting secondary school may need extra support in fractions and geometry as they enter Year 7. Figure 19: Change in mean Percentage Score from 2019 to 2021 in maths (PUMA) summer tests Matthew Wynne, Primary Regional Director, United Learning “Our experience shows that the focus upon core content, number etc, was to the detriment of other strands, such as geometry. Gap analysis showed that core content required immediate focus to enable pupil confidence to grow.” To download this white paper, visit risingstars-uk.com/whitepaper21 18
IN COLLABORATION WITH

   Schools in the Midlands showed much larger average declines in maths
   In the autumn term analysis, a surprising pattern emerged in maths showing larger falls in maths
   attainment in the Midlands across all year groups. As shown in Figure 20 this pattern in the Midlands
   has continued throughout the year groups in the summer term, whilst schools in the North saw
   greatest declines in Years 2 and 6.

   Figure 20: Change in mean Standardised Scores from 2019 to 2021 in maths (PUMA)
   summer tests

   Sarah-Anne Fernandes and Trevor Dixon, SMASHMaths and Authors of Ready, Check, Go: Maths
   knowledge checkers
   “It is both understandable and expected that test attainment has declined given the lost
   teaching time. And, also, should test data, in these challenging times be taken too seriously; it
   should not be a discouragement to teachers or to children. Yes, the evidence to show children
   have fallen behind where they would have been in more normal circumstances. What needs to
   be given careful thought is what are the next steps that need to be taken to make up for this
   decline and what strategies will get pupils back on track. The use of the DfE Ready to Progress
   Criteria is a helpful starting point. It can be used to identify areas of weakness from prior year
   group standards before beginning teaching on the new year group curriculum aims.”

To download this white paper, visit risingstars-uk.com/whitepaper21                                        19
IN COLLABORATION WITH

   Appendix

   About Us
   RS Assessment from Hodder Education is a leading provider of assessments for Early Years through to
   KS3 and beyond, its standardised termly tests – GAPS, PiRA, PUMA and NTS Assessments – are trusted
   by more than 6,000 primary schools to accurately measure and predict pupil progress. SchoolDash
   is an education data analytics company, providing dashboards, maps, analysis and other statistics
   about schools in England. RS Assessment and SchoolDash have collaborated to prepare these papers
   to help understand what impact school disruption may have had on attainment across the country.
   The papers are funded by RS Assessment.

   About the paper
   In considering differences between groups of schools or pupils it is important to bear in mind that
   the variation within each group is invariably much greater than any differences between groups. As
   a result, simply knowing (for example) the school a pupil attends provides little indication about his
   or her likely performance. Nevertheless, these aggregate trends are important in assessing the overall
   effectiveness and equity of our education system, and we hope that they prove useful in informing
   priorities and policies.

   We have previously analysed aggregate, anonymous data to reveal national attainment trends across
   schools in England, including variations by pupil age, season of birth and gender, as well as by subject
   and even individual topics within each subject. See risingstars-uk.com/whitepaper for these previous
   analyses. In order to protect the confidentiality of the institutions and individuals concerned, results
   have been analysed and presented in an anonymised, aggregate form.

   All data has been processed in line with MARK terms and conditions, which can be found at
   risingstars-uk.com/markterms.

   Coverage and representativeness
   This analysis is limited to mainstream state primary schools in England. In order for us to have
   confidence in our statistical analysis it is vital we have a large and representative enough sample. The
   smallest sample in summer 2021 was for Reception maths tests with more than 2000, in all other
   maths year groups there was an average of 12,000 test results. There were more than 2000 Reception
   reading results and an average of 13,000 for all other year groups. GPS had the highest samples with
   more than 15,000 per year group. In all cases the 2019 sample was larger. For any analysis of pupil or
   school groups the minimum number of test results in any group was 1000.

   An analysis of the coverage of types of schools included in both cohorts was broadly similar in that all
   regions and major school types were included. However, in both years we had an over-representation
   of schools in the lowest attainment bands. That is to say more schools than average with lower
   proportions of children achieving the expected standard in reading, maths and writing in KS2 in 2019.
   However, the similar levels of over-representation in both groups mean that this bias is unlikely to
   account for year-on-year differences in attainment.

To download this white paper, visit risingstars-uk.com/whitepaper21                                           20
IN COLLABORATION WITH

   Tests and scores
   The data used in this report comes from standardised, termly tests PiRA, PUMA and GAPS. The
   tests were taken in 2020-2021 and entered into MARK, a free marksheet and reporting service. The
   termly tests are marked by teachers using a robust mark scheme, and raw scores are converted to
   Standardised Scores automatically in MARK. We have analysed only results from fully completed tests,
   with non-zero scores sat by a pupil within the correct age range. Tests sat at the wrong time of year
   have been omitted.

   Where results are presented as a change in score the following comparisons are used: autumn 2020
   compared to autumn 2019, spring 2021 compared to spring 2020 (up until the national lockdown),
   and summer 2021 compared with summer 2019.

To download this white paper, visit risingstars-uk.com/whitepaper21                                        21
You can also read