The effects of beech masts and 1080 pest control on South Island robins (Petroica australis)
←
→
Page content transcription
If your browser does not render page correctly, please read the page content below
Bell et
New   Zealand
        al.: Pest-control
                Journal ofinEcology
                             beech mast
                                    (2021)
                                        years
                                           45(2): 3452 © 2021 New Zealand Ecological Society.                                        1

                  RESEARCH

The effects of beech masts and 1080 pest control on South Island robins
(Petroica australis)

Mara A. N. Bell1,2,3, Doug P. Armstrong2 , Joris S. J. Tinnemans1, Tristan E. Rawlence1,
Christopher W. Bell1, Anja McDonald1, Kirsty J. Moran1, Graeme P. Elliott1*
1
  Biodiversity Group, Department of Conservation, Private Bag 5, Nelson 7042, New Zealand
2
  Wildlife Ecology Group, Massey University, Palmerston North, Private Bag 11 222, New Zealand
3
  Present address: 10A Old Scapa Road, Kirkwall, Orkney, KW15 1BB, Scotland
*Author for correspondence (Email: gelliott@doc.govt.nz)

Published online: 3 August 2021

          Abstract: We assessed the effect of aerial 1080 control of possums (Trichosurus vulpecula), ship rats (Rattus
          rattus) and stoats (Mustela erminea) on the survival and nest success of South Island robins (Petroica australis)
          at Tennyson Inlet, Marlborough Sounds, from 2012–2017. Cereal baits containing 1080 were applied in 2013
          when rat and stoat numbers were low, and again in 2014 after a beech mast when rat numbers were high. Survival
          rates of 134 banded adult South Island (SI) robins and 209 SI robin nests were monitored. Ship rats were the
          main predator of eggs and chicks, with stoats, possums and ruru (Ninox novaeseelandiae) also preying on nests.
          Rats were the only predator identified killing adult females on the nest. Nest success was negatively affected
          by rat abundance and increased when 1080 reduced rat abundance. Our study did not detect a measurable
          negative effect of aerial 1080 use on nest success or adult survival, although over the course of the study two
          nests failed and two adults disappeared while 1080 was present in the forest. The positive effect of aerial 1080
          pest control was short-lived, with rat numbers increasing rapidly in subsequent years. To achieve long-term
          population benefits in small beech forest blocks, future pest control operations will need to achieve higher rat
          kills in beech mast years, and/or be undertaken at roughly three yearly intervals.
          Keywords: 1080, adult survival, nest success, sodium fluoroacetate, South Island robin, Petroica australis

Introduction                                                           applied by helicopter in the form of cereal baits; 1080-laced
                                                                       cereal baits kill rodents and possums. Cats and mustelids are
Many New Zealand native birds are negatively affected by               killed through secondary poisoning when they eat dead and
introduced mammalian predators (Holdaway 1989; Clout &                 dying rodents (Meenken & Booth 1997; Eason et al. 2013);
Craig 1995; Brown et al. 1998; Innes et al. 2010; Robertson            1080 is therefore an effective multi-target poison (Murphy
et al. 2012), in particular possums (Trichosurus vulpecula), ship      et al. 1999). In the past, 1080 was applied in carrot and cereal
rats (Rattus rattus) and stoats (Mustela erminea). Control of          baits at sowing rates of up to 20 kg ha−1. Small bait fragments
these mammals is the main tool used to conserve native forest-         (chaff) in carrot bait were eaten by some non-target species
dwelling birds in New Zealand (Parliamentary Commissioner              including North Island robins (Petroica longipes) which were
for the Environment 2011). Five species of southern beech              killed (Powlesland et al. 1999; Westbrooke & Powlesland 2005;
(Nothofagacae) occur in about half of New Zealand’s remaining          Veltman & Westbrooke 2011). Today however, lower sowing
native forests (Schauber et al. 2002); all are mast seeders,           rates of 1–2 kg ha−1 are common (Warburton & Cullen 1995),
producing large crops of seed every 2–6 years (Wardle 1984).           and carrot bait is rarely used. These changes have reduced
Rodent and stoat numbers increase dramatically following a             by-kill and the use of non-toxic pre-feed has increased kill
beech mast (King 1983; King & Moller 1997). The rat and stoat          rates of target species (Westbrooke et al. 2003; Nugent et al.
plagues that occur after beech masts are the cause of dramatic         2011), but 1080 still kills some native wildlife (Morris et al
declines and local extinctions amongst beech forest-dwelling           2016) and its use is often controversial (Green & Rohan 2012;
birds (Elliott & Kemp 2016).                                           Russell 2014). The impact of 1080 predator control on a range
      In recent years, pest control in beech forests has mostly        of forest birds has been assessed (Powlesland et al 2003; Greene
occurred during the rodent and stoat plagues following a               et al 2013;Tinnemans et al 2018 ) including the relationship
beech mast (Elliott & Kemp 2016). The most widely used                 between South Island robin nest success and survival following
tool for large-scale pest control in New Zealand is sodium             1080 operations (Schadewinkel et al. 2014; van Heezik et al.
fluoroacetate (1080) (Parliamentary Commissioner for the               2020). However, these previous studies monitoring SI robin
Environment 2011; Morgan et al. 2015), which is mostly                 nest success and survival were undertaken in exotic forests
DOI: https://dx.doi.org/10.20417/nzjecol.45.53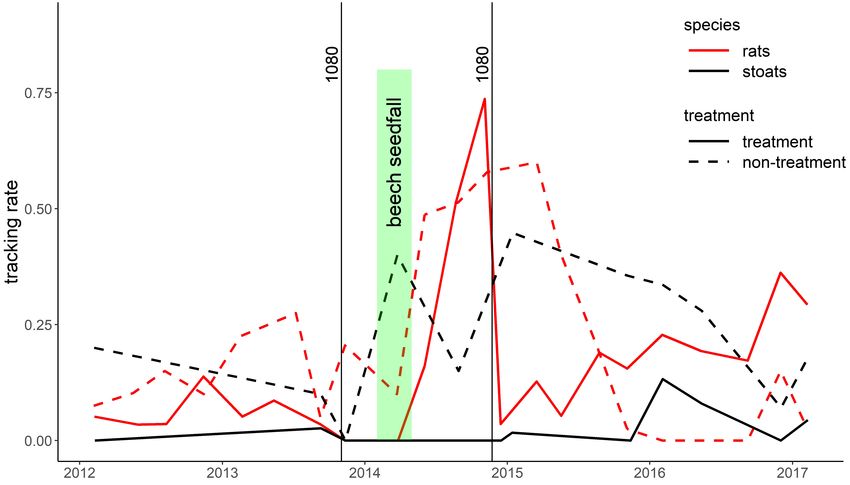
2 New Zealand Journal of Ecology, Vol. 45, No. 2, 2021
where 1080 was used at regular intervals to control possums treatment block on a peninsula, near Mt. Stanley, while the
and in nearby kānuka (Kunzia ericoides)-dominated forests. non-treatment area (121 ha) was centred around Opouri Saddle
In this study, we assess the impact of two 1080 pest and included Lookout Peak. The areas were chosen because
control operations specifically undertaken to control predators they had similar topography and vegetation, were at similar
in a beech forest. We compare the effect of a 1080 operation altitudes and had SI robins accessible on foot.
undertaken during a beech mast-induced stoat and rat plague
with a 1080 operation undertaken when stoats and rats were 1080 pest control
relatively uncommon. Our study was undertaken in a patchily Two aerial 1080 pest control operations covering almost the
distributed SI robin population, predominantly confined to high same extent were undertaken during our study (Fig. 1). The
altitudes where predator densities, particularly rat densities, first took place on 2 November 2013 in the absence of a beech
were low. We aimed to determine whether SI robin nest success mast, with a non-toxic pre-feed 13 days earlier. The second
and adult survival improved when aerial 1080 operations were was carried out on 23 November 2014 during a beech mast,
undertaken in association with a beech mast. Assessment of 44 days after the pre-feed. In 2014, weather prevented aerial
overall benefit (or otherwise) to SI robins and other forest birds sowing of bait in 12.5 ha near the summit of Mt Stanley. Bait
from 1080 use was assessed in a concurrent study using bird was sown by hand in this area on 8 December 2014. Both
counts. These have yet to be analysed. pest control operations aimed to suppress rats to below a 5%
tracking rate.
The non-toxic pre-feed consisted of 0.3% cinnamon-
Methods lured cereal pellets (16 mm, 6 gm RS5) at a 1kg ha−1 sowing
rate. Toxic baits were also applied at a 1kg ha−1 sowing rate
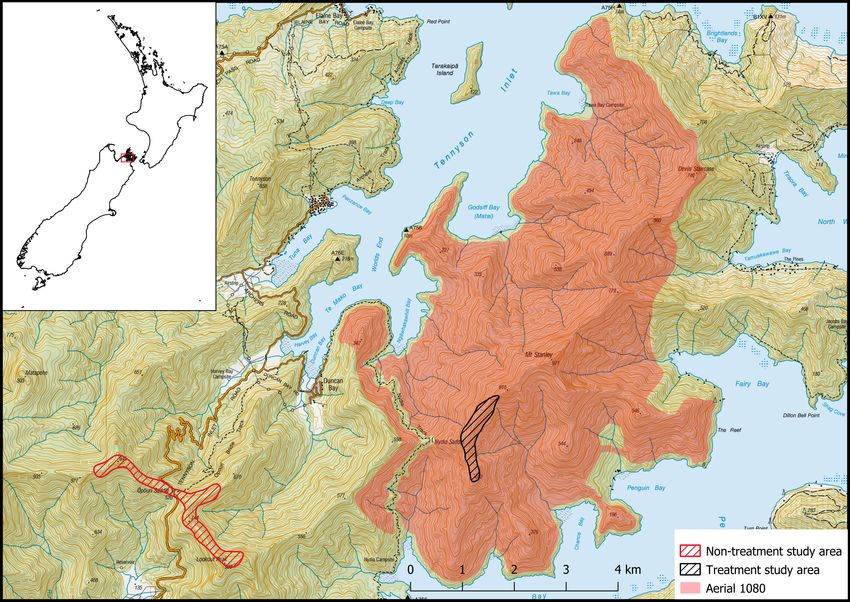
Study area and were the same as the non-toxic baits except they were
The study was undertaken at Tennyson Inlet in the Marlborough dyed green and laced with 0.15% 1080. Based on National
Sounds, at the northern end of the South Island of New Zealand. Institute of Water of Atmospheric Research Ltd. observations,
The study area comprised two areas about 4.5 km apart within rainfall had exceeded 100 ml 35 days after both aerial 1080
a continuous mature mixed beech-podocarp forest (Fig. 1). applications by which time baits were deemed no longer toxic
The treatment area (57 ha) was within a 4300-ha aerial 1080 (Bowen et al 1995).
Figure 1. Study areas and 1080 treatment area.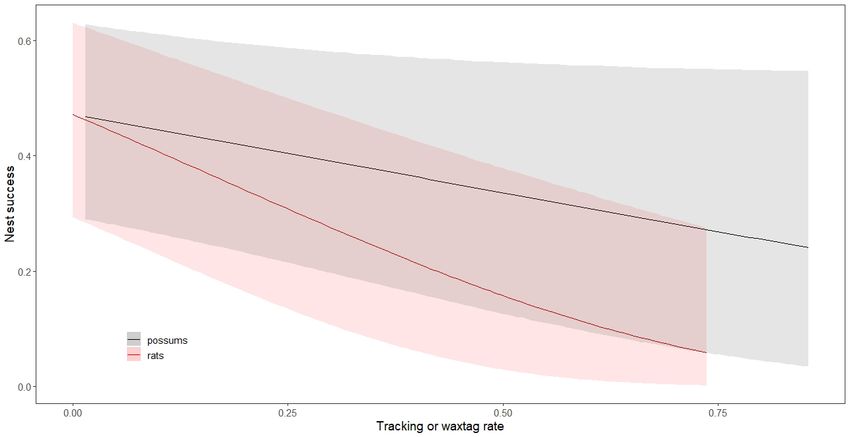
Bell et al.: Pest-control in beech mast years                                                                                       3

Rat and stoat abundances                                             (7) active1080 – a categorical variable indicating whether
Rat abundance in the treatment and non-treatment areas were          observations were within 35 days of a 1080 operation.
indexed using tracking tunnels, according to standard protocols           Three further nuisance variables were included in the
(Gillies & Williams 2013) with surveys undertaken quarterly in       models, not because they were of particular interest, but rather
February, May, August, and November. Stoats were surveyed            because they might improve model fit: (1) season (days from
using tracking tunnels biannually in February and August,            the beginning of the breeding season) and season2, (2) age (nest
initially using the standard 3-night surveys (Gillies & Williams     age in days) and age2, and (3) he random effect ‘PairID’ was
2013) baited with fresh rabbit meat, but after February 2015         included in all models, to account for multiple nest attempts
stoat surveys were conducted using salted rabbit meat left           by the same pair.
out for 14 nights.                                                        Two suites of glms with plausible combinations of
     Kill rates of rats during 1080 operations were estimated        explanatory variables were compared: (1) “pest abundance
using the methods of Elliott et al. (2018).                          models” where indices of stoat, rat or possum abundance
                                                                     were the explanatory variables, and (2) pest control models
Possum abundance                                                     where pest control treatment, area and time (before/after)
                                                                     were the explanatory variables. We fitted these models using
We indexed possum abundance three times in the non-treatment         the package lme4 (Bates et al. 2015) in R version 3.4.2 and
block and five times in the treatment block using a 7-day wax        compared them using QAICc (Burnham & Anderson 2002).
tag protocol (National Possum Control Agencies 2008) and
between 100 and 400 wax tags per block in each survey. We            Adult survival mark-recapture analysis
estimated possum abundance at each wax tag survey by fitting
a generalised linear model using the method of Elliott et al.        SI robins were captured and individually metal and colour-
(2018) which assumed a common possum kill rate for all 1080          banded. During the nesting season breeding adults were
operations and a common population growth rate between 1080          searched for every 7–10 days and non-breeding birds (such
operations. We assumed the population at the non-treatment           as single males) once a month. Systematic searches for all
site was stable and at carrying capacity.                            banded SI robin were only conducted at the start of each
                                                                     breeding season and pre/post 1080 treatment within the study
                                                                     area. Additional surveys of the study area were also conducted
Nest success
                                                                     over the 2016 non-nesting season and at the end of the study in
Nests of banded SI robins were monitored during five breeding        August 2017. Robins that disappeared were assumed to have
seasons (2012/13–2016/17). Nests were found by following             died, a reasonable assumption given that we were monitoring
banded birds. Only nests found with eggs or chicks were              territorial adults.
included in the analysis; nests found after they failed or                RMark (Laake 2013) was used to model the relationships
fledged, were omitted. Where possible, nests were monitored          between adult SI robin survival and sex, season, 1080
using trail cameras which were checked at weekly intervals.          operations, rodent and stoat abundance. Monthly capture
     Nest failures were attributed to specific predators based on    intervals were created for analysis. To explore the possibility
photographs, but no attempt was made to distinguish between          that birds were killed by 1080, 35 days after the 1080 drops
ship and Norway rats (Rattus norvegicus). Nest failures were         in which birds might be killed by ingesting 1080 were coded
classified as “unidentified predator” if partial or no images were   as “1080”. A suite of models with plausible combinations of
captured of the predator and chicks or eggs disappeared from         explanatory variables were compared using QAICc (Burnham
the nest. Nests were classified as “abandoned” when they failed      & Anderson 2002).
in the absence of a predator and in the absence of a change               Overdispersion in the data was examined using program
to the nest content. Nests were classified as a “human-caused        Release within RMark which produces an estimate of c-hat.
failures” if the camera remained untriggered after a nest check      Competing models were compared using QAICc (Burnham
and the nest contents remained unchanged.                            & Anderson 2002) incorporating the value of c-hat provided
                                                                     by Release.
Modelling factors affecting nest success
The relationship between nest success and a suite of explanatory
variables was examined using methods described by Rotella            Results
et al. (2004) and Bolker (2014). In particular, daily nest
survival rates were modelled using generalised linear models         Predator tracking rates and beech mast
(glms) with binomial errors and a complementary log-log link         Rat tracking rates were lower at higher altitudes (> 500 m)
function. This approach is almost identical to the nest survival     (average non-treatment tracking rate = 0.20) where we studied
model implemented in program Mark (Rotella et al. 2004),             SI robins than they were at lower altitudes (< 500 m) (average
but allowed pair to be included as a random effect. Potential        non-treatment tracking rate = 0.47) where SI robins were
important explanatory variables included in the models were:         absent. For this reason, our analysis of relationships between
(1) rat abundance from tracking tunnel data,                         SI robins, rats and stoats uses tracking data only from the area
(2) stoat abundance from tracking tunnel data,                       in which we studied SI robins (> 500 m).
(3) possum abundance from wax tags,                                        All four beech species flowered in Tennyson Inlet in spring
(4) timecode (one category for each breeding season except           2013, resulting in heavy seeding in autumn and winter of
the 2013 and 2014 breeding seasons which divided in two              2014. After the seedfall rat numbers, then stoat numbers rose
before and after the 1080 operations),                               (Fig. 2). Rats were undetectable in the treatment block after the
(5) area (treatment or non-treatment),                               first 1080 operation, but their numbers rose quickly after the
(6) an interaction between timecode and area was included            subsequent seedfall in both the treatment and non-treatment
to examine whether the 1080 operations had any effect, and           blocks and were again reduced in the treatment block by the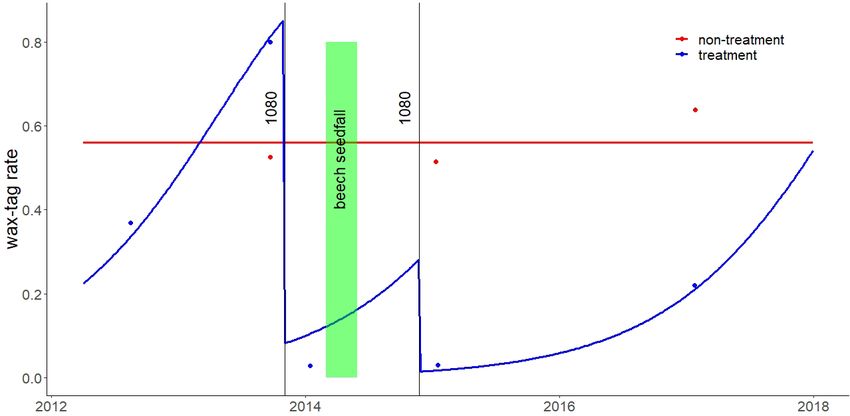
4                                                                                 New Zealand Journal of Ecology, Vol. 45, No. 2, 2021

Figure 2. Stoat and rat tracking rates in the treatment and non-treatment blocks at Tennyson Inlet and the timing of 1080 operations and
beech seedfall.

Figure 3. Waxtag possum bite mark indices for the two study blocks between 2012 and 2018 and the timing of 1080 operations and beech
seedfall. Blue and red points are actual wax-tag rates, while red and blue lines are fitted rates.

second 1080 operation (a kill rate of 98%). The two 1080                    Based on possum wax-tag indices, possums density
operations appeared to almost completely suppress stoats in            appeared to grow at a rate of 359% per annum in the treatment
the treatment block for the subsequent two years of the study.         area and the average kill rate in the two 1080 operations was
     Although rat numbers declined immediately after the               96% (Fig. 3). The high growth rate indicates a combination of
second 1080 operation in the treatment area, over the next two         immigration and reproduction rather than solely reproduction.
years they gradually rose to numbers higher than they had been         Possum numbers were approximately stable in the non-
before the 1080 operation. In contrast, rat numbers in the non-        treatment area and presumably at carrying capacity. Some
treatment area initially rose following the beech seedfall and         ground-based possum control had occurred in the treatment
then declined about a year later. This was presumably a natural        area in the years before our study started.
population crash following beech-mast-induced plagues.
Bell et al.: Pest-control in beech mast years 5
Nest success all eight predations happened at night. Four predation events
We found a total of 218 SI robin nests and were able to monitor occurred in the non-treatment area, and four in the treatment
and determine the outcome at 209 of them (Table 1). Sixty-nine area. Three of these events occurred when rat numbers were
per cent of all nests failed, and possums, rats and stoats were high before the 2014 1080 operation and one in 2016 when
responsible for at least half of these failures. Since possums, rat numbers had recovered.
rats and stoats are likely to have been responsible for at least
some of the failed nests for which we could not identify a Nest failures during the active 1080 period
cause or a predator, these predators are likely to have caused Two nests were abandoned within 35 days of a 1080 application.
the failure of more than half of all nests monitored. There One failed within 24 h of the 1080 operation when the eggs
was considerable annual variation in the proportion of nests were close to, or just hatched, but both adults were subsequently
preyed upon by stoats and rats and this is likely to reflect found alive. The other failed during incubation, about four
their abundance which is turn reflects time since beech masts days after the 1080 operation, when the female disappeared.
and predator control efforts. The effects of these factors are
explored in the modelling nest success section. Modelling nest success
The best model of daily nest survival included terms for rats,
Female deaths on the nest possums, and a quadratic term for season (Table 2), indicating
Eight brooding or incubating female SI robins from 138 well- that nest survival decreased with possum and rat abundance
monitored nests were attacked by predators and six of them and with time through the season (Fig. 4). The relationship
died. At seven nests, cameras identified rats as the predator and between rat abundance and nest success is stronger than the
Table 1. Outcome of 209 SI robin nests in non-treatment and treatment areas at Tennyson Inlet.
__________________________________________________________________________________________________________________________________________________________________
Non-treatment Treatment
Sub-total
Sub-total
2012
2013
2014
2015
2016
2012
2013
2014
2015
2016
Total
__________________________________________________________________________________________________________________________________________________________________
Failures
Morepork 0 0 0 1 0 1 0 0 1 0 0 1 2
Possum 0 3 3 3 0 9 3 0 0 0 0 3 12
Rat 3 5 7 0 4 19 0 1 10 4 11 26 45
Stoat 1 1 0 6 5 13 1 0 1 0 1 4 16
Unknown predator 2 2 4 2 2 12 3 0 4 3 3 13 24
Unknown cause 1 0 6 3 4 14 1 1 7 5 3 17 31
Abandoned 1 3 2 0 1 7 0 5 0 1 0 6 13
Successes 4 4 3 5 8 24 3 10 12 13 3 41 73
Total 12 18 25 20 24 99 11 17 35 26 21 110 209
__________________________________________________________________________________________________________________________________________________________________
Figure 4. Modelled relationships between nest success and possum and rat abundance. Shaded areas indicate 95% confidence intervals.6 New Zealand Journal of Ecology, Vol. 45, No. 2, 2021
Table 2. Sixteen plausible models of the relationship between SI robin nest success and some explanatory variables. All
models also include a random effect for pair. Age2 and season2 indicate quadratic terms for age and season.
__________________________________________________________________________________________________________________________________________________________________
Model npar AICc ΔAICc weight
__________________________________________________________________________________________________________________________________________________________________
Pest abundance models
1 possum+rat+season2 6 1022.903 0.000 0.251
2 age2+possum+rat+season2 8 1023.288 0.386 0.207
3 possum+rat 4 1023.767 0.864 0.163
4 1080+possum+rat+season2 7 1023.962 1.059 0.148
5 rat+season2 5 1024.107 1.204 0.138
6 possum+rat+season2+stoat 7 1024.906 2.003 0.092
7 . 2 1037.642 14.740 0.000
8 possum+season2 5 1037.945 15.042 0.000
Pest control models
9 area*timecode+age2+season2 19 1028.859 0.000 0.405
10 area*timecode+season2 17 1029.837 0.977 0.248
11 area*timecode+age2 17 1030.594 1.734 0.170
12 1080+area*timecode+age2+season2 20 1030.861 2.002 0.149
13 age2+season2+timecode 12 1036.270 7.410 0.010
14 area+timecode+age2+season2 13 1037.183 8.323 0.006
7 . 2 1037.642 8.783 0.005
15 age2+season2 6 1038.165 9.305 0.004
16 age2+season2+area 7 1038.624 9.764 0.003
__________________________________________________________________________________________________________________________________________________________________
relationship between possum abundance and nest success, active 1080 period section). No robins disappeared after the
and the confidence intervals around the possum relationship 2014 1080 operation.
are large (Fig. 4). Comparison of models with and without The best model of adult survival had a weak relationship
an active 1080 period term (models 1 and 4 in Table 2) and between rats and survival (Table 3 and Fig. 6). Models including
a stoat term (models 1 and 6 in Table 2) provide no support sex, season, active 1080 period, possums and stoats as well as
for an immediate post operation 1080 effect, nor an effect of a term for rats were within two QAICc units of the best model
stoat abundance. Similarly, there was no support for including but had one additional parameter and higher QAICc scores and
a term for age. Amongst the suite of pest control models there are thus not well supported by the data (Burnham & Anderson
is strong support for including an interaction term between 2002). The null model was also within two QAIC units of the
area and timecode (models 9 and 14 in Table 2), indicating most parsimonious model indicating that even the best model
that pest control had a large effect on nest success. There was was not well supported. Including interaction terms between
less support for including quadratic terms for age and season. rats and sex did not improve model fit and we conclude that
Models with rat and possum abundance were better than any relationship between rat abundance and survival was the
models explicitly modelling the effect of 1080 treatment on same for male and female robins.
our treatment and control areas (models 1 and 9 in Table 2).
Close examination of the best pest control models,
indicated that in both 2013 and 2014, nest success in the Discussion
treatment area increased after 1080. This is presumably because
of the dramatic decline in rat abundance, while in the non- Pest control
treatment area, nest success decreased as rat numbers rose (Fig. In the absence of a beech mast in 2013, rats were in low
5). In 2015 and 2016 nest success decreased in the treatment abundance and the 1080 operation reduced them to undetectable
area with increasing rat abundance, while in the non-treatment levels. There was a beech mast before the 2014 1080 operation,
area nest success increased as rat numbers decreased. and rat tracking rates rose steeply to reach 94% before the
This analysis suggests that rat, possibly possum, but not operation which reduced rat tracking rates to 12% three weeks
stoat abundance, had an impact on robin nest success, and that after the operation. This reduction in rat abundance represents
1080 treatments had a substantial impact on nest success by about a 98% kill rate, but the residual rat abundance was still
reducing rat abundance. higher than desired. Tennyson Inlet was one of seven 1080
operations that failed to reduce rats to below 5% tracking
Adult survival rate during the 2014 beech mast (Elliott & Kemp 2016), but
During the study 134 banded robins were monitored, 67 in it also had one of the highest rat tracking rates before the
each of the non-treatment and treatment areas. Males made up 1080 operation.
the majority of banded adults, with 80 males and 54 females Following the 2014 1080 operation, rats increased steadily
(1.5:1 ratio). Both 1080 operations had a maximum active- over the next two years, reaching abundances higher than
1080-period of 35 days until 100 ml of rain had fallen. After before the two 1080 operations. Rats are known to recover
the 2013 1080 operation two SI robins disappeared, a male quickly after pest control in small treatment blocks (Innes &
and a female (already described in the nest failures during the Skipworth 1983) and although the Mount Stanley treatmentBell et al.: Pest-control in beech mast years 7 Figure 5. South Island robin nest success in treatment and non-treatment areas in relation to 1080 operations. Error bars are 95% confidence intervals. Figure 6. Modelled relationship between adult robin survival and rat tracking rate. Shaded areas are 95% confidence intervals. block is on a peninsula, much of the peninsula was untreated able to rapidly increase in abundance following the 1080 such that no part of the treatment area was more than 2 km from operation, they do not explain why the rat population rose to untreated land. Furthermore, surviving rats are likely to have higher levels than before the beech mast and 1080 operations. had access to a good food supply after the 1080 operation and This phenomenon has been observed before and has been are likely to have continued breeding. McQueen and Lawrence explained by a reduction in competition from possums for (2008) found that rat diets contained beech seeds well after high energy foods such as fruit and seeds (Sweetapple et al the time of germination and speculated that rats cached seeds 2006; Sweetapple & Nugent 2007). A modelling exercise by securing a food supply into the summer months. While the Tompkins and Veltman (2006) predicted that the elimination proximity of uncontrolled rat populations and the availability of possums would have little impact on rat abundance in beech of food within our treatment area can explain why rats were forests, but they speculated that in podocarp-hardwood forests
8                                                                                                 New Zealand Journal of Ecology, Vol. 45, No. 2, 2021

Table 3. Plausible models exploring the relationship between adult SI robin survival and a suite of possible explanatory
variables. All models included recapture probabilities specified by time + sex. QAICc was estimated using a c-hat value
of  1.351.
__________________________________________________________________________________________________________________________________________________________________

Model                                     npar            QAICc            ΔQAICc             weight
__________________________________________________________________________________________________________________________________________________________________

rat                                        39            1484.39              0.00              0.17
rat + possum                               40            1485.25              0.86              0.11
.                                          38            1485.28              0.89              0.11
rat + active                               40            1485.34              0.95              0.11
rat + Sex                                  40            1485.42              1.02              0.10
rat + season                               40            1485.77              1.38              0.09
since1080                                  39            1485.94              1.55              0.08
area + since1080                           40            1486.35              1.96              0.07
rat + stoat                                40            1486.55              2.16              0.06
area                                       39            1487.23              2.83              0.04
rat * Sex                                  41            1487.53              3.14              0.04
area * since1080                           41            1488.46              4.07              0.02
__________________________________________________________________________________________________________________________________________________________________

it might have considerable impact. Our study area included                                Possums preyed on a similar number of SI robin nests to
both higher altitude beech forests and low altitude podocarp-                        stoats, but our models nonetheless suggest a weak relationship
beech forests and our results seem therefore consistent with                         between nest success and possum abundance (Fig. 4).
Tompkins and Veltman’s (2006) prediction.                                                 Armstrong et al. (2006) and Parlato and Armstrong (2012)
     The increase in stoat abundance that occurred in the                            found that adult male and female North Island robin survival
non-treatment area in response to the beech mast and rodent                          was similar when predators were rare but was lower in females
increase (Fig. 2) was completely suppressed in the treatment                         when predators were common. They attributed this difference
block by the two 1080 operations, and stoat numbers recovered                        to predation of nesting females. We detected no difference
to similar, but not higher levels after the two 1080 operations.                     between male and female survival and our study was carried
                                                                                     out at > 500 m a.s.l. where rats were most often uncommon
SI robin nest success and survival                                                   and any difference in survival between males and females
Rats were the main identifiable cause of nest failure in our                         was likely to be small and undetectable with our small sample
study, followed by stoats, possums and ruru. Rats were also                          size. Contrary to this reasoning, Powlesland (1983) found an
the only identifiable predator of nesting adults. Rat numbers                        interaction between seasonality and sex, with similar survival
fluctuated more in response to beech mast and 1080 operations                        rates between the sexes during the summer, but higher mortality
than other predators, and rat abundance was the best explainer                       amongst males in the winter.
of patterns of nest success and adult survival.
     Our models showed that nest success and adult survival                          Net effect of 1080 on SI robins
were both negatively affected by increasing rat numbers. We                          Although a small number of robins may have been killed and
also found a weak negative relationship between nest success                         a small number of nests may have failed because of 1080, any
and possum abundance. Additionally, the models showed that                           such effects were small and probably trivial. The effect of
both aerial 1080 operations were associated with increases in                        changes in nest success caused by changes in rat abundance
nest success. Although two nest failures and two adult deaths                        associated with 1080 treatments are, in contrast, large.
may have been caused by 1080, our models provided no                                      Over the period of our study, robins were slightly better
evidence of a short-term negative impact of 1080.                                    off in our treatment area due to an increase in breeding success
     The observed positive improvements in nest success                              associated with 1080 use in 2014. This increased breeding
associated with 1080 in our study were short-lived. Within a                         success was greater than the decrease in nest success associated
year of the second 1080 operation the relationship between                           with increasing rat abundance over the two years following the
treatment and non-treatment nest success had returned to its                         1080 drop. However, rat numbers increased in our treatment
pre-treatment state. After two years, nest success had become                        area for another year after our study ceased. If nest success
considerably worse in the treatment block, almost certainly                          continued to be negatively affected by high rat numbers,
because rat numbers had risen to higher levels in the treatment                      after 4 years robins would probably have been worse off in
block than they had in the non-treatment block. Rat numbers                          the treatment than the non-treatment area. If 1080 operations
continued to rise for another year after the end of our study                        had been undertaken at 3-year intervals, then there probably
(Fig. 2) so it is likely that SI robin nest success would have                       would have been a small net benefit to robins in our treated area
been worse in the treatment area than the non-treatment area                              The potential benefit to robins of 1080 operations such
in both the second and third year after the 1080 drop.                               as those at Tennyson Inlet might be improved if kill rates of
     Although stoats were the second most important predator                         target species are improved and opportunities for recolonisation
of SI robin nests in our study, we were unable to detect any                         reduced. Controlling rat numbers by poisoning and or trapping
effect of stoats on nest success in our models. This is probably                     along coastal buffers and tracks as well as on neighbouring
because compared to other causes of nest failure, nest predation                     land may be vital to the success of vulnerable species in small
by stoats was rare, and because the abundance of stoats and rats                     1080 treatment areas.
were highly correlated, any impact of stoats on nest success                              The recovery of rats in our treatment block to higher levels
was obscured by the greater impact of rats.                                          after the 2014 1080 operation than in our non-treatment block is
Bell et al.: Pest-control in beech mast years 9
of considerable consequence in the assessment of the usefulness References
of 1080 operations for SI robins. Had rats recovered only to
the same population abundance as without treatment, then a Armstrong DP, Raeburn EH, Lewis RM, Ravine D 2006.
single 1080 operation would be of unequivocal benefit to SI Modeling vital rates of a reintroduced New Zealand robin
robins and a series of operations would be beneficial regardless population as a function of predator control. The Journal
of treatment frequency. Our results suggest however, that at of Wildlife Management 70: 1028–1036.
sites like ours, 1080 treatments might only provide long-term Bates D, Meaechler M, Bolker B, Walker S 2015. Fitting linear
benefit if they are repeated at no more than 3 yearly intervals, mixed-effect models using lme4. Journal of Statistical
or if rats are suppressed to very low abundances or immigration Software 67: 1–48.
reduced by controlling rats on adjoining land, in our case over Bolker B 2014. Logistic regression, accounting for differences
the whole peninsula. in exposure, updated 30 September 2014. https://rpubs.
Our results have similarities and differences to studies com/bbolker/logregxp. (Accessed 1 February 2021)
carried out near Dunedin (Schadewinkel et al. 2014; van Heezik Bowen LH, Morgan DR, Eason CT 1995. Persistence of
et al. 2020). At both Dunedin and Tennyson Inlet, rat and sodium monofluoroacetate (1080) in baits under simulated
possum numbers were reduced by 1080, and in both locations rainfall. New Zealand Journal of Agricultural Research
rat numbers recovered to higher levels than before treatment. 38: 529–531.
At both sites the effects of direct mortality from 1080 were Brown KP, Moller H, Innes J, Jansen P 1998. Identifying
small or non-existent. At Tennyson Inlet, however, there was predators at nests of small birds in a New Zealand forest.
a detectable increase in SI robin nest success following 1080 Ibis 140: 274–279.
and a subsequent decline in nest success the following year, Burnham KP, Anderson DR 2002. Model selection and
while no such change was observed near Dunedin. The most multimodel inference: a practical information-theoretic
likely explanation for this difference is that rat abundance was approach. New York, Springer Verlag. 515 p.
low at the Dunedin sites, and robin nest success was high even Clout MN, Craig JL 1995. The conservation of critically
in the absence of pest control (Van Heezik et al. 2020), so that endangered flightless birds in New Zealand. Ibis 137:
pest control made little or no difference. 181–190.
Aerially applied 1080 is likely to be of benefit to small Eason CT, Ross J, Miller A 2013. Secondary poisoning risks
forest birds like SI robins where predators, particularly rats from 1080 poisoned carcasses and risk of trophic transfer
are abundant, but not at places where rats are uncommon. – a review. New Zealand Journal of Zoology 40: 217–225.
At lowland sites, or sites adjoining lowlands, aerial 1080 Elliott GP, Kemp J 2016. Large-scale pest control in
may suppress rat abundance for only a short time and they New Zealand beech forests. Ecological Management &
may subsequently rise to even higher abundances. At such Restoration 17: 200–209.
sites 1080 will only be of benefit to birds such as SI robins Elliott GP, Kemp J, Russell JC 2018. Estimating population
when it is carried out frequently, unless very high kill rates growth rates from tracking tunnels. New Zealand Journal
are achieved and reinvasion is prevented. At higher altitude of Ecology 42: 269–272.
sites, aerial 1080 might be of more benefit to birds such as SI Gillies C, Williams D 2013. DOC tracking tunnel guide v2.5.2:
robins, regardless of its frequency or effectiveness, because Using tracking tunnels to monitor rodents and mustelids.
at these sites, rats recover much more slowly after 1080 use. Hamilton, Department of Conservation. 14 p.
There is therefore a clear need for further research, especially Green W, Rohan M 2012. Opposition to aerial 1080 poisoning
long-term (10 plus years) monitoring of the abundance of small for control of invasive mammals in New Zealand: risk
forest birds at a range of sites where 1080 is repeatedly used perceptions and agency responses. Journal of the Royal
at a range of different frequencies. Society of New Zealand 42(3): 185–213.
Greene TC, Dilks PJ, Westbrooke IM, Pryde MA 2013.
Monitoring selected forest bird species through aerial
Acknowledgements applications of 1080 baits, Waitutu, New Zealand.
New Zealand Journal of Ecology 37: 41–50.
A big thank you to the Picton Department of Conservation office Holdaway RN 1989. New Zealand pre-human avifauna and its
who oversaw both 1080 operations with special thanks to Phillip vulnerability. New Zealand Journal of Ecology 12: 11–25.
Clerke and Frank Rosie. A big thank you to all contractors and Innes JG, Skipworth JP 1983. Home ranges of ship rats in a
volunteers who assisted with field work, especially Mitchell small New Zealand forest as revealed by trapping and
Bartlett, Vanessa Smith, and Robyn Blyth. This project would tracking. New Zealand Journal of Zoology 10: 99–110.
not have been possible without the support from the Duncan Innes JG, Warburton B, Williams D, Speed H, Bradfield P
Bay community; a huge thank you to you all, and a special 1995. Large-scale poisoning of ship rats (Rattus rattus)
thank you to John and Pam Harvey, Peter and Jenny Archer, in indigenous forests of the North Island, New Zealand.
and Linda and Doug Booth. New Zealand Journal of Ecology 19: 5–17.
Innes JG, Kelly D, Overton JM, Gillies C 2010. Predation and
other factors currently limiting New Zealand forest birds.
New Zealand Journal of Ecology 34: 86–114.
Author Contributions King CM 1983. The relationship between beech (Nothofagus
sp.) and populations of mice (Mus musculus), and the
MB & GE conceptualised, designed the methodology, and
demographic and dietary responses of stoats (Mustela
ran the investigation. MB wrote the original manuscript; DA
erminea), in three New Zealand forests. Journal of Animal
and GE reviewed and edited the work. HR, TR, CV, AM, and
Ecology 52:141–166.
KM were all involved in the investigation
King CM, Moller H 1997. Distribution and response of rats
Rattus rattus, R. exulans to seedfall in New Zealand beech10 New Zealand Journal of Ecology, Vol. 45, No. 2, 2021
forests. Pacific Conservation Biology 3: 143–155. New Zealand Journal of Ecology 38: 315–321.
Laake J 2013. RMark: An R interface for analysis of capture- Schauber EM, Kelly D, Turnchin P, Simon C, Lee WG, Allen
recapture data with MARK. Seattle, NOAA. 25 p. RB, Payton IJ, Wilson PR, Cowan PE, Brockie RE 2002.
McQueen S, Lawrence B 2008. Diet of ship rats following a Masting by eighteen New Zealand plant species: The
mast event in beech (Nothofagus spp.) forest. New Zealand role of temperature as a synchronizing cue. Ecology 83:
Journal of Ecology 32: 214–218. 1214–1225.
Meenken D, Booth LH 1997. The risk to dogs of poisoning Sweetapple PJ, Nugent G 2007. Ship rat demography and diet
from sodium monofluoroacetate (1080) residues in following possum control in a mixed podocarp-hardwood
possum (Trichosurus vulpecula). New Zealand Journal forest. New Zealand Journal of Ecology 31(2): 186–201.
of Agricultural Research 40: 573–576. Sweetapple PJ, Nugent G, Poutu N, Horton P 2006. Effect of
Morgan D, Warburton B, Nugent G 2015. Aerial prefeeding reduced possum density on rodent and stoat abundance
followed by ground based toxic baiting for more efficient in podocarp-hardwood forests. New Zealand Department
and acceptable poisoning of invasive small mammalian of Conservation Research and Development Series 231.
pests. PLoS ONE 10(7): e0134032. Wellington, Department of Conservation. 25 p.
Morris GA, Nugent G, Whitford J 2016. Dead birds found Tinnemans JSJ, Elliott GP, Rawlence TE, McDonald A,
after aerial poisoning operations targeting small mammal Nydegger Bell MA, Bell CW, Moran KJ 2019. Costs and
pests in New Zealand 2003–14. New Zealand Journal of benefits of aerially applied 1080 poison to western weka
Ecology 40: 361–370. (Gallirallus australis australis). New Zealand Journal of
Murphy EC, Robbins L, Young JB, Dowding JE 1999. Ecology 43(1): 3353–3364.
Secondary poisoning of stoats after an aerial 1080 poison Tompkins DM, Veltman CJ 2006. Unexpected consequences
operation in Pureora Forest, New Zealand. New Zealand of vertebrate pest control: predictions from a four-species
Journal of Ecology 23: 175–182. community model. Ecological Society of America 16(3):
Nugent G, Warburton B, Thomson C, Sweetapple P, Ruscoe W 1050–1061.
2011. Effect of prefeeding, sowing rate and sowing pattern van Heezik Y, Ray SM, Jamieson IG, Allen O, Schadewinkel
on efficacy of aerial 1080 poisoning of small-mammal R 2020. Impacts of aerial 1080 predator control on nest
pests in New Zealand. Wildlife Research 38: 249–259. success and adult survival of South Island robins. New
National Possum Control Agencies 2008. Possum control Zealand Journal of Ecology 45(1): 3407.
monitoring using the wax tag method. Wellington, National Veltman CJ, Westbrooke IM 2011. Forest bird mortality and
Possum Control Agencies. 21 p. bait practices in New Zealand aerial 1080 operations
Parlato E, Armstrong DP 2012. An integrated approach for from 1986 to 2009. New Zealand Journal of Ecology
predicting fates of reintroductions with demographic 35(1): 21–29.
data from multiple populations. Conservation Biology Wardle JA 1984. The New Zealand beeches. Wellington,
26: 97–106. New Zealand Forest Service. 447 p.
Parliamentary Commissioner for the Environment 2011. Warburton B, Cullen R 1995. Cost-effectiveness of different
Evaluating the use of 1080: Predators, poisons and silent possum control methods. Science for Conservation 4.
forests. Wellington, Parliamentary Commissioner for the Wellington, Department of Conservation. 17 p.
Environment. 85 p. Westbrooke IM, Powlesland RG 2005. Comparison of impact
Powlesland RG 1983. Breeding and mortality of the South between carrot and cereal 1080 baits on tomtits (Petroica
Island robin Petroica australis australis in kowhai bush macrocephala). New Zealand Journal of Ecology 29(1):
Kaikoura New Zealand. Notornis 30: 265–282. 143–147.
Powlesland RG, Knegtmans JW, Marshall ISJ 1999. Costs and
benefits of aerial 1080 possum control operations using Received: 22 October 2020; accepted: 19 April 2021
carrot baits to North Island robins (Petroica longipes), Editorial board member: Audrey Lustig
Pureora Forest Park. New Zealand Journal of Ecology
23: 149–159.
Powlesland RG, Wills DE, August ACL, August CK 2003.
Effects of a 1080 operation on kaka and kereru survival
and nesting success, Whirinaki Forest Park. New Zealand
Journal of Ecology 27: 125–137.
Robertson HA, Dowding JE, Elliott GP, Hitchmough RA,
Miskelly CM, O’Donnell CFJ, Powlesland RG, Sagar
PM, Scofield RP, Taylor GA 2012. Conservation status
of New Zealand birds, 2012. Wellington, Department of
Conservation. 22 p.
Rotella JJ, Dinsmore SJ, Shaffer TL 2004. Modelling nest-
survival data: a comparison of recently developed methods
that can be implemented in MARK and SAS. Animal
Biodiversity and Conservation, 27: 187–205.
Russell JC 2014. A comparison of attitudes towards introduced
wildlife in New Zealand in 1994 and 2012. Journal of the
Royal Society of New Zealand 44: 136–151.
Schadewinkel RB, Senior AM, Wilson DJ, Jamieson IG
2014. Effects on South Island robins (Petroica australis)
from pest control using aerially applied 1080 poison.You can also read