The Economics of Electricity Reliability
←
→
Page content transcription
If your browser does not render page correctly, please read the page content below

Energy Institute WP 336

              The Economics of Electricity Reliability

   Severin Borenstein, James Bushnell, and Erin Mansur

                                     March 2023

Energy Institute at Haas working papers are circulated for discussion and comment purposes.
They have not been peer-reviewed or been subject to review by any editorial board. The Energy
Institute acknowledges the generous support it has received from the organizations and
individuals listed at https://haas.berkeley.edu/energy-institute/about/funders/.

© 2023 by Severin Borenstein, James Bushnell, and Erin Mansur. All rights reserved. Short
sections of text, not to exceed two paragraphs, may be quoted without explicit permission
provided that full credit is given to the source.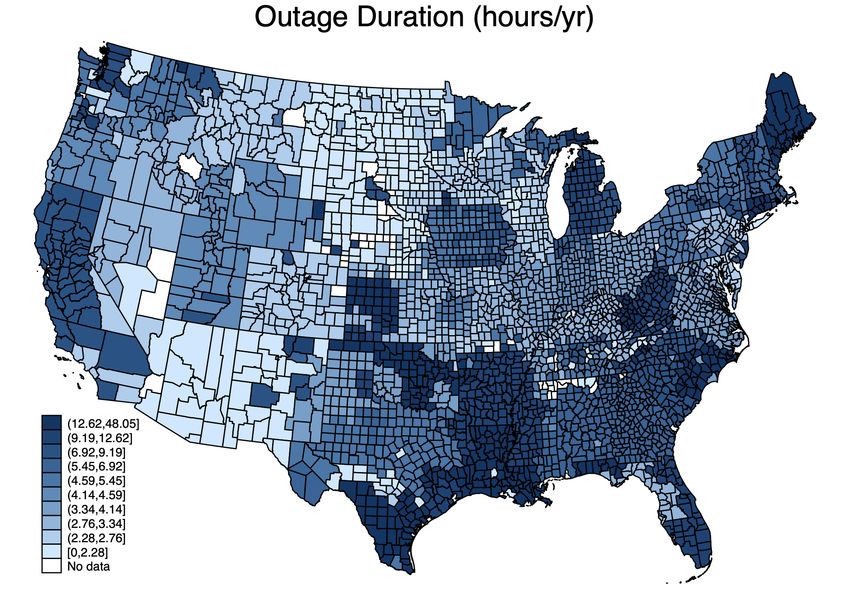
The Economics of Electricity Reliability

        By S EVERIN B ORENSTEIN , J AMES B USHNELL AND E RIN M ANSUR*

          The physics of an electrical grid requires that the supply injected into the
          grid is always in balance with the quantity consumed. If that balance
          is not maintained, cascading outages are likely to disrupt supply to all
          consumers on the grid. In the past, vertically integrated monopoly util-
          ities have ensured that supply is adequate to meet demand and maintain
          grid stability, but with deregulation of generation, assuring adequate
          supply has become much more complex. The unique characteristics of
          electricity distribution means that there are immense potential external-
          ities among market participants from supply shortfalls. In this paper,
          we discuss the institutions that US electricity markets have developed
          to avoid destabilizing supply shortfalls when there are multiple gener-
          ators and retailers in the market. Though many of the markets rely on
          standardized requirements for supplier reserves, we conclude that recent
          technological progress may steer future evolution towards a system that
          relies to a greater extent on economic incentives.

    On August 14, 2003, a midsized power plant owned by an Ohio electric utility
(FirstEnergy) suffered an unplanned shutdown. Shortly thereafter several poorly-main-
tained large transmission lines failed. By late afternoon, voltage in its service territory
had dropped to dangerous levels. The only way to restore stability would have been to in-
terrupt service to a large portion of the Cleveland area, but no such service interruption
was implemented. By 4:00 PM, uncontrolled outages began quickly cascading outward
from Ohio, first to Detroit and Toronto, and then to Pennsylvania and New York. The
outages eventually reached parts of nine US states and most of Ontario, which suffered
intermittent blackouts for more than a week. All told, more than 50 million people were
affected. Estimates of total costs were $4-$10 billion in the US and 0.7% of monthly
GDP in Canada (U.S.-Canada Power System Outage Task Force, 2004).

  Typically, when the term “reliability” is used in the context of a consumer
product, it refers to the product’s quality or longevity rather than to the ability
to acquire the product at all.1 In developed economies, electricity is one of the
few consumer products for which the term reliability has always been applied
to product availability.
  Electricity resembles a service much more than a good. It is very costly to
store for even seconds, so it must be produced largely at the same time that it

   * Borenstein: Haas School of Business, UC Berkeley, severinborenstein@berkeley.edu; Bushnell: Depart-
ment of Economics, UC Davis, jbbushnell@ucdavis.edu; Mansur: Tuck School of Business, Dartmouth,
erin.mansur@dartmouth.edu
    1 Only with the global pandemic and follow-on disruptions throughout the global supply chain has the
availability of many products no longer been taken for granted.
                                                   1
is consumed. Demand varies minute to minute, so the barriers to storage mean
that suppliers must be responsive to the fluctuations in demand. Unlike most
services, however, electricity can be transported over relatively long distances at
near zero cost up to transmission capacity, so production and consumption of
the product need not be physically proximate. Still, transmission has capacity
constraints, so large areas can be part of the same market most of the time, but
sub-areas can become isolated quite rapidly.2
   In most markets, a temporary supply shortage leads to high prices, isolated
stockouts, or other non-market rationing schemes. The physics of an electrical
grid, however, means that a supply-demand imbalance can cause two critical
characteristics of electricity—voltage and frequency—to deviate from their re-
quired levels, which can damage both appliances using the electricity and gen-
eration units producing it. To mitigate that risk, generators have protective de-
vices that disconnect them from the grid when such deviations occur. Those
protective disconnections, however, worsen the voltage or frequency deviations
on the grid, potentially causing more disconnections and, ultimately, triggering
a cascade. Thus, electricity is almost unique among commodities in the way
that a local supply-demand imbalance can cascade into widespread service dis-
ruptions, potentially affecting millions of customers located far away from the
original market imbalance, as happened in 2003.
   Despite this possibility of serious negative spillovers from a local imbalance,
electricity grids typically cover very large areas due to the value of supply di-
versification in maintaining supply-demand balance. Even with conventional
generation resources, assuring adequate supply is challenging, due to the risk of
generator outages and the uncertainty of peak demand levels. Because outages
and demand are imperfectly correlated across regions, connecting them into a
common grid reduces the cost of capacity needed to reduce the probability of
a supply shortfall below any given level. In the continental US, there are three
main grids – roughly covering west of the Rocky Mountains, east of the Rockies,
and Texas – each of which connects many different utility service areas.
   Due to the unique physics of electricity, maintaining on-demand availability
to millions of customers requires a precise juggling of real-time delivery sys-
tems. Furthermore, the complexity of electricity flow on a grid with millions of
connected sources and sinks means that it is not practical in real time to estab-
lish which entities are responsible for a supply shortfall or surplus.3 Because
this interdependence stretches across areas served by different electric utilities,

    2 Beyond transmission capacity constraints on individual lines, movement of electricity around the grid is
also constrained by Kirchhoff’s Law, which dictates that electricity flows among multiple paths on a grid in
inverse proportion to the resistance of each path. Unlike natural gas or water, there are no cheap valves that
can be used to direct electricity to the most valuable location. As a result, the capacity to move electricity
between locations is a very complex physics relationship that depends on the demands and supplies at each
node of the grid.
    3 In fact, grid operators keep the system in balance not directly by measuring output from generation and
consumption from customers in real time, but indirectly by measuring voltage, frequency, and other attributes
that reflect aggregate supply-demand balance at various locations on the grid.
                                                      2
extensive rules have been developed over the decades to manage reserves and
operational standards in real time.
   Standards for operations and reserves help reduce local imbalances and gen-
erally prevent them from cascading to neighboring areas. Most economists who
study electricity markets agree that relying purely on market forces to provide
these types of real-time services would not be efficient, because of imperfect in-
formation and the fluctuating, and potentially massive, externalities from a lo-
cal supply-demand imbalance. However, for long-run investments in electricity
generation capacity to maintain grid reliability there is less agreement on the role
of markets versus regulation.
   In this paper, we review the historical and current landscape of regulations
and markets created to assure reliability of this unusual, and critical, product.
Unlike very short-run electricity imbalances, shortfalls in planning and invest-
ment can be assigned to specific actors as they occur. Thus, while real-time oper-
ations to assure reliability are generally carried out by a central grid operator—
called a Regional Transmission Organization (RTO) or Independent System Op-
erator (ISO) in the US4 —advanced procurement of adequate supply is typically
less centralized. Furthermore, the market design and mechanisms for reward-
ing investments in supply capacity vary greatly, from “energy-only” wholesale
markets—where all compensation comes from selling electricity—to various forms
of remuneration for capacity availability, whether or not that capacity produces
electricity at the time.5 Regardless of the design, these markets are facing new
challenges as they use less “dispatchable” generation (e.g., natural gas, coal, or
nuclear) and more “intermittent” sources that fluctuate exogenously, like wind
and solar.
   In one sense, the problem faced in electricity supply is similar to any industry
in which a complex web of vertically-related firms must coordinate on produc-
tion and remuneration to deliver a product to consumers. Electricity, however,
is possibly the most challenging situation due to the physics of grid stability, the
high cost of storage, the shared network of transmission, the mix of for-profit
companies with non-profit or heavily regulated firms, and the critical role this
product plays in the functioning of an economy.

              I.   A Short Primer on Electricity Regulation and Deregulation

   The electricity industry has four main segments: generation, transmission, dis-
tribution, and retailing/billing. The first three involve physical hardware to pro-
duce and distribute electricity, while the fourth is a procurement and account-
ing function. Historically, all these segments were vertically integrated within

   4 We are not aware of any systematic difference between organizations that call themselves RTOs and those
that call themselves ISOs. Throughout this paper we will refer to RTOs to represent either type of organization.
   5 The term energy-only is a bit of a misnomer in the sense that these markets do also procure and price
ancillary services as well as electricity. Nonetheless, the term highlights the absence of any additional long-
run compensation for capacity.
                                                       3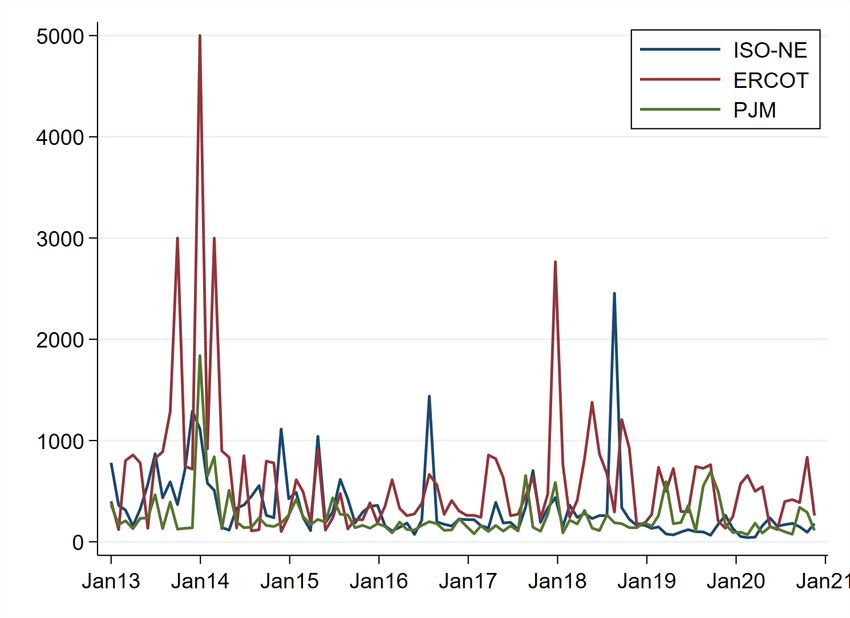
regional utility companies operating with monopoly franchises for serving cus-
tomers within each of their territories (Joskow, 1997). There was also some trad-
ing among regional utilities, and there were some utilities—primarily munici-
pal or cooperative distribution utilities—that purchased all of their power from
other utilities and engaged only in distribution and retailing/billing.6
   While some vertically-integrated utilities were owned by local governments
or associations of governments, the majority of electricity in the US was and
still is sold through investor-owned utilities under regulation by state agen-
cies. Decades of such regulation under cost-of-service principles raised concerns
about the incentives provided to regulated utilities and their resulting efficiency
(Borenstein and Bushnell, 2000).
   Starting in the late 1990s, several US states began restructuring their power
sectors. Electricity generators began to earn market prices, and independent
power producers could enter into this market. Furthermore, in many regions,
the incumbents (the vertically-integrated, investor-owned utilities) were required
to sell off their generation or operate it in a separate entity under market prices.
Decisions about the type and amount of investment in new generation capac-
ity shifted from a regulatory forum to a decentralized, market-based process.
Power transactions, rather than being internal to a firm or between neighboring
utilities, were to be made through a centralized wholesale power market.
   Those centralized markets are operated by RTOs, which run the auctions that
clear the wholesale energy markets as well as order minute by minute adjust-
ments in output from generators in order to constantly balance supply and de-
mand at each location. To do this, the RTOs also run markets for “ancillary
services,” which are short term commitments by some generators to make ca-
pacity available that can increase or decrease output at the request of the RTO.
RTOs also ensure reliable and non-discriminatory access to transmission sys-
tems. High-voltage power lines (i.e., transmission) and low-voltage ones (i.e.,
distribution) continue to operate as natural monopolies. As such, they remain
under economic regulation at either the state or federal level. As in the decades
before, investments in transmission and distribution (T&D) assets are reviewed
by federal and state governing bodies and costs recovered under cost-of-service
regulation principles.
   Around the same time that many states moved to deregulate electricity gen-
eration, a smaller number adopted various forms of “retail competition.” The
phrase means that customers can purchase their electricity from retailers other
than the utility that provides local physical distribution of the electricity. Such
competitive retailers need not be in the physical side of the electricity business,
and most are not. Instead, they procure electricity from generators under longer-
term contracts, or out of the wholesale spot market, and sell electricity to re-

     6 The industry also includes Federal Power Marketing Administrations, such as Bonneville Power Admin-
istration and Tennessee Valley Authority, which focus on the generation and transmission segments, and have
little or no presence in distribution or retailing/billing.
                                                    4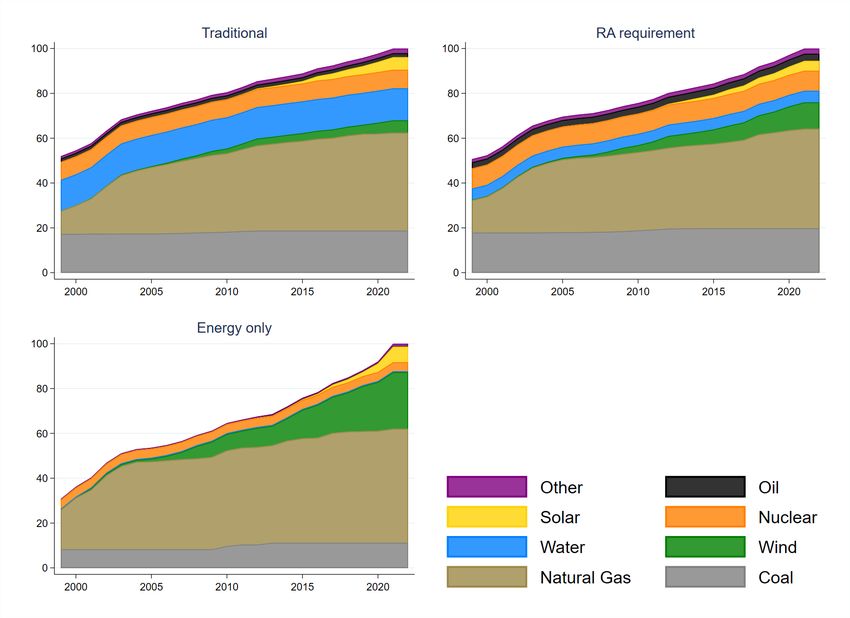
tail customers. In most states with retail competition—including Texas, Ohio,
Massachusetts—the retailers are for-profit companies, but in other states—such
as California and Illinois—retail competitors can also, or only, be local govern-
ment agencies. By the nature of such retail competition, neighboring customers
need not be buying power from the same retail provider. All retailers, whether
competitive for-profit, competitive non-profit, regulated investor-owned utility,
or government entity, are collectively known as load-serving entities (LSEs).
   Many states with retail competition retain a regulated “default provider” op-
tion for customers who choose not to actively switch to another provider. To
date, retail competition has proven more popular with larger commercial and
industrial customers. The majority of residential customers remain with their
default provider, with the exception of Texas which does not have a regulated
default retail provider (Borenstein and Bushnell, 2015).
   Importantly, even in deregulated states, the reliability of a household’s elec-
tric supply is decoupled from its choice of retail service provider. The regulated
utility distribution company delivers power to all retail customers to meet their
real-time demand, regardless of which retailer is procuring power for the cus-
tomer. Retailers are then responsible for covering the wholesale cost of all elec-
tricity delivered to their customers. When there is a supply shortfall, stability of
the system is maintained through “load shedding,” demand reductions achieved
by cutting all power to some customers. Typically, that is applied randomly by
neighborhood with no consideration of which retail provider has procured in-
sufficient supply.
   As of 2021, about 69% of all electricity delivered in the US is in regions that
are part of RTOs and about 44% is procured in markets with significant retail
competition.7

                                II.   Reliability in Electricity Systems

   As the experience from the 2003 blackout illustrates, electricity reliability is a
function of much more than just adequate investment in generation capacity. In
fact, by far the most common cause of electricity service interruptions (i.e., black-
outs) is a localized failure in the distribution system, such as might be caused by
a tree branch falling on a power line. Electricity service interruptions can be cat-
egorized as localized distribution outages, larger-area transmission outages, or
supply shortfalls, any of which, if not properly managed, can lead to cascading
system outages.
   When shortages of supply have occurred—with recent examples in California

    7 EIA form 861 provides data on electricity sales in Megawatt-hours (MWh). We define customers as being
in an RTO if their retail provider is in a balancing authority (BA) that is one of the seven RTOs shown in Figure
4. Retail competition is state policy. Thus, we define retail competition as having electricity sales in a given
‘market’ (a BA-state pair) that are from non-utility retail providers (their service type in the EIA-861 sales data
is not ‘Bundled’). A market is considered to have significant retail competition if non-utility retailers account
for at least 10% of sales.
                                                        5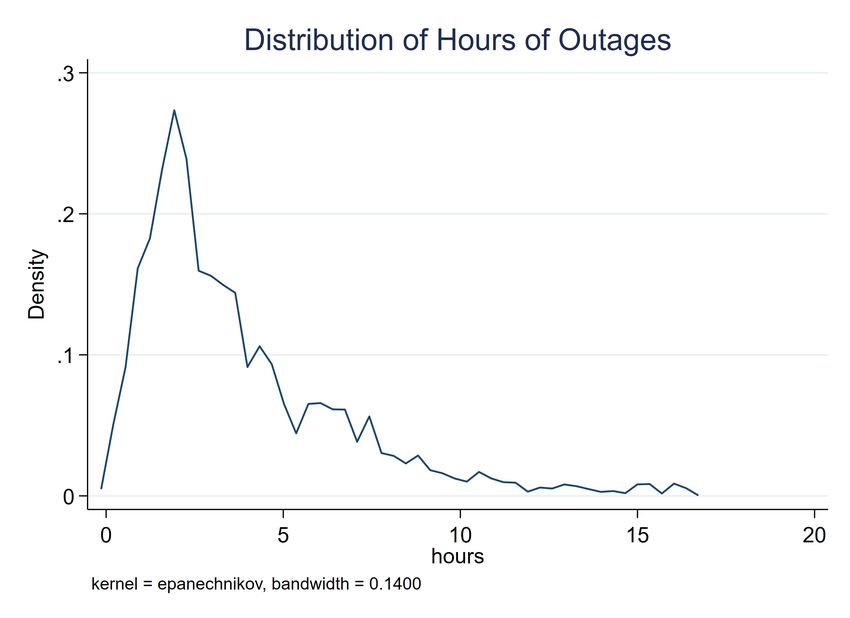
(2020), Texas (2021), Tennessee (2022) and North Carolina (2022)—shortfalls are
generally anticipated far enough in advance to manage the shortage without dis-
rupting supply to the vast majority of customers. Even during the Texas energy
crisis in February 2021—the largest and most costly service interruption since
the 2003 Northeast blackout—over 25% of projected consumption was curtailed,
but the remaining 75% was delivered by the still-operating regional grid (UT
Austin Committee, 2022). As serious as the Texas crisis was, it did not create
cascading outages and far more drastic disruptions, though it came extremely
close (Blunt and Gold, February 24, 2021).
  Cascading outages—the most severe and rare type of outage by far—arise
when there is a localized shortfall, usually due to the failure of a generation or
transmission resource, that is not contained quickly enough by interrupting local
customers. This is the distinctive feature of electricity systems: a local supply-
demand imbalance effectively can disrupt the grid on a very large scale if not
dealt with quickly and properly. In this way a small supply shortfall, which in
markets for other goods and services would result in rationing supply to a small
number of customers, in electricity can result in interrupting service to all de-
mand, not just the amount that is in excess of available supply.

                          A.    Causes and Magnitudes of Outages in the US

   Many outages are unplanned, last-minute responses to weather or issues with
the grid as discussed above. However, there are also planned outages that are
usually for purpose of maintenance on distribution lines. Recently, planned out-
ages have also been used in California due to the risk of wildfires and the re-
sulting need to de-energize some transmission or distribution lines in order to
prevent them from sparking fires (known as “Public Safety Power Shutoffs”).
The data below do not make a distinction of whether the outage was planned or
not.
   Distribution utilities report information on the frequency and duration of out-
ages.8 For some utilities, we observe whether an outage was initiated at the dis-
tribution system (low voltage) or the transmission network (high voltage). The
high-voltage outages might be caused by insufficient generation resources or by
problems with the transmission wires. The System Average Interruption Dura-
tion Index (SAIDI) measures how many minutes the average customer served
by a distribution utility experienced outages for a given year. Another index,
SAIFI, measures the frequency of outage events: how many times a year did the
average customer at a utility experience an outage.
   From 2015 to 2020, customers experienced an average of 1.34 outages a year
with an average cumulative duration of 5.67 hours annually. Distribution system
outages account for the vast majority (87%) of customers’ outage minutes, with

  8 See   the Annual Electric Power Industry Report (EIA form 861).
                                                     6
the balance being due to transmission or system supply shortfalls.9
These outages are not distributed evenly throughout the country. Figure 1
shows the distribution of the number of hours per year of outages across util-
ities, weighted by the number of customers, truncated at the 95th percentile.
While most customers just experience a couple hours of outages annually, the
distribution has a long right tail with some averaging over 15 hours a year. En-
tergy (a large utility in Louisiana) averages over 38 hours a year and some small
cooperatives are over 100 hours. Figures 2 and 3 show spatial distribution of
the average number of annual outages and minutes without power by county
for the contiguous US. We see that customers in some states (namely, Louisiana,
Maine, Oklahoma, West Virginia, and Connecticut) experience more than twice
as much time with outages than the national average. In addition to these states,
outages are also more common in Alaska and Vermont.
Figure 1. : Density of annual hours of outages across Utilities
9 Distribution system outages are the ‘System Average Interruption Duration Index with Major Event Days
Minus Loss of Supply’. This index follows the Institute of Electrical and Electronics Engineers (IEEE) standards
for measuring an outage duration (SAIDI). We use the measure that includes all outages (a major event day
is an “interruption or group of interruptions caused by conditions that exceed the design and operational
limits of a system” (see https://www.eia.gov/electricity/annual/html/epa_11_01.html). From this, the
utilities remove ‘loss of supply’, which is an outage that was initiated from the high-voltage system.
7Figure 2. : Annual Number of Outages by County
Figure 3. : Annual Minutes of Outages by County
8The Electric Emergency Incident and Disturbance Report (Form DOE-417) lists
specific large outages and other major events like the 2021 Texas energy crisis.10
Table 1 pools reports over the past 20 years. While the 2003 Northeast blackout
and the 2021 Texas crisis are notable, there are large events in most years. In fact,
despite the Texas electricity crisis in 2021, that year overall had a similar total
number of customers affected and energy losses from outages as other years.
Table 1 shows the largest events (reported in millions of customers affected and
power losses) from 2002 to 2021 by region and event type. Most are weather
related.
B. The Economic Cost of Unreliable Electric Supply
While it is clear that power outages are costly to customers, it is much less
clear exactly how costly. Within the electricity industry, the cost of an outage is
characterized by the “Value of Lost Load” (VOLL), a concept used for planning
and investment decisions. Somewhat surprisingly to economists, policy discus-
sions typically are about a single VOLL per kWh number, rather than a demand
curve for electricity services with some end-uses producing much greater value
than others. Gorman (2022) presents an intellectual history of VOLL and dis-
cusses the ways in which it overlaps with standard economic consumer theory,
and the ways in which it departs. A single VOLL is somewhat consistent with an
approach in which retail price is unresponsive to supply/demand balance and
rationing is unrelated to the value derived from a particular use by a particular
customer. In that case, the aggregate lost gross consumer surplus from a quantity
shortfall would, in expectation, be equal to the size of the shortfall multiplied by
the average gross consumer surplus across uses, which the VOLL is intended to
reflect.11 Even in that case, however, VOLL fails to account for critical charac-
teristics of outages that would cause the lost consumer surplus to vary, such as
weather and other environmental factors at the time of the outage, the extent of
warning customers are given prior to the outage, as well as the size and length
of the outage. The 2021 Texas energy crisis, for instance, illustrates that an out-
age during extreme cold that lasts for multiple days, and in some cases covers
large areas so critical electricity services are not available nearby, is likely to be
particularly costly per lost MWh.
There is an extensive literature on the economic effects of the availability and
reliability of electricity in developing countries. This literature has not reached
consistent findings. Some papers have found relatively modest economic effects
in the short run (Dinkelman, 2011; Lee et al., 2020; Burlig and Preonas, forth-
coming). However, others have found larger effects when the economy more
fully adjusts over time (Lipscomb et al., 2013; Fried and Lagakos, forthcoming).
10 Note that not all of these events are outages as it lists all major disturbances and unusual occurrences.
11 Thus, the use of VOLL bears some resemblance to the use of the “value of a statistical life” numbers that
are often used in policy analysis, except there is a potentially more straightforward market source for deriving
VOLL.
9Table 1—: Major Outages by Event Type, State and Year
Customers
Affected Power Loss
Event Type Region Year (millions) (Gigawatts)
Cascading Blackout Northeast US 2003 7.37 78.64
Winter Storm Uri Texas 2021 2.12 16.41
Hurricane Florence North Carolina 2018 1.78 15.00
North American derecho Atlantic/Midwest 2012 8.60 13.61
Hurricane Wilma Florida 2005 3.24 10.00
Severe Weather Washington state 2018 4.20 10.00
Transmission Nevada 2021 1.30 9.00
Severe Weather Nevada 2020 1.40 8.18
Hurricane Ike Texas 2008 4.65 8.09
System Operations Nevada 2021 1.30 8.00
System Operations AZ/CA 2011 2.00 7.00
Hurricane Isabel NC/VA 2003 1.80 6.51
Tropical Storm Isaias New York Area 2020 2.94 6.22
Hurricane Frances Florida 2004 2.78 6.00
Hurricane Matthew Florida 2016 1.20 5.60
Hurricane Katrina Louisiana 2005 2.08 5.54
Hurricane Irma Florida 2017 3.92 4.50
Generation Inadequacy Texas 2011 1.07 4.00
Wild Fires California 2014 1.40 3.90
Weather/Transmission California 2019 0.97 3.19
System Operations Puerto Rico 2016 1.48 2.75
Cable accidentally cut California 2005 0.90 2.58
Hurricane Rita Lower Miss. Valley 2005 1.61 2.30
Severe Weather Puerto Rico 2011 0.93 2.20
Equipment Trip/Failure Puerto Rico 2012 0.90 1.80
Severe Weather Missouri/Illinois 2006 2.50 1.50
Hurricane Charley Florida 2004 1.20 1.40
Hurricane Jeanne Puerto Rico 2004 1.42 1.24
Severe Weather Maryland 2011 0.87 1.11
Hurricane Ivan Southeast US 2004 0.92 0.92
Blackouts in developing countries have been shown to have economic costs on
manufacturers, by altering inputs (Fisher-Vanden et al., 2015) and changing their
scale of operations (Allcott et al., 2016). Blackouts are transitory shocks that re-
duce workers’ earnings and lead to lower birth weights (Burlando, 2014).12
12 Additional papers examine another reliability issue not common in industrialized countries, namely, un-
stable voltage or frequency (Trimble et al., 2016; Zhang, 2018; Carranza and Meeks, 2021; Berkouwer et al.,
10There is, however, very little work on the effects of electricity reliability in
the US or other advanced economies. In part, this is likely because levels of
reliability are so high that it is difficult to tease out the longer run impacts of
variation in reliability among US states or between countries with developed
economies. There are a few studies of specific blackout events, including the
Northeast blackout of 2003 and Texas in 2021, but even those extreme events
raise substantial estimation challenges. Gorman (2022) discusses some attempts
to infer the economic cost of unreliable supply from assumed elasticities of de-
mand, but points out that this omits all of the factors that cause the economic loss
to vary across events and customers. Some of the challenges are fairly specific to
electricity, such as fixed prices and random rationing, but others are present in
a wide range of issues associated with supply shortfalls, such as the correlation
of demand with supply shocks and the impact of the shortfall’s time span and
prior warning of it.
III. Economics of Supply-Demand Balancing in Electricity Spot Markets
As discussed above, periodically grid operators ration electricity through load
shedding in order to keep localized shortfalls from expanding into regional black-
outs. It is natural for an economist to ask why rationing is required at all, and
why prices are not able to clear market imbalances. After all, even with rela-
tively inelastic demand and strict capacity constraints, at some price the market
would be expected to clear. Under standard assumptions, a perfectly competi-
tive market charging the market clearing price in each period maximizes welfare
in the short run. Furthermore, as shown by Steiner (1957) and Boiteux (1960), the
scarcity rents created when demand strains generation capacity incentivize effi-
cient generation investment—both quantity and technology type—in the long
run.
In this section, we describe the combination of factors that have historically
made this mainstream economic view of market clearing a fringe idea in elec-
tricity (Joskow and Tirole, 2007). Our focus is primarily on electricity systems
that have deregulated wholesale electricity generation markets, as is the case in
most of the US and most developed economies, though we also discuss how the
issues manifest in more traditional vertically-integrated service areas.
The changing regulation of electricity generation in many developed economies
during the 1990s and 2000s decentralized responsibility for investments in gen-
eration capacity. State and regional organizations continued to produce forecasts
of demand and of generation resources, but no single entity was tasked with the
responsibility of investing in the generation capacity necessary to meet the de-
mand forecasts. While some economists expected that electricity prices would
n.d.). For example, Meeks et al. (2021) note that voltage fluctuation is a major issue in the Kyrgyz Republic.
The authors use a randomized control trial to examine how installing smart meters affects service quality and
find that treatment results in less voltage fluctuation and more electricity sales.
11provide sufficient information and incentive to support investment, others ar-
gued for procurement mandates that are applied to all LSEs or a centralized
market for procurement of generation capacity availability, as distinct from the
sale of electricity itself. A number of electricity market factors are highlighted by
those who see a need for greater regulation or coordination of capacity procure-
ment.
A. Little demand-side price response
Due to fluctuating and inelastic demand and supply functions, along with
very costly storage, the wholesale price of electricity can vary drastically even
within a day. On high-demand days, the wholesale price during the minutes or
hour with the tightest supply/demand balance can be 10 times or more the price
during lower demand times of the same day. In almost no cases, however, do
retail customers see any reflection of those prices. Instead, customers generally
face prices that are set months or longer in advance—either a constant price at all
times, or higher pre-set prices during some hours than others. Even such “time-
of-use” (TOU) prices, however, reflect very little of the variation in wholesale
prices, because peak demands and fluctuating supply constraints are typically
weather driven and unpredictable months in advance.13 Retail suppliers, how-
ever, are typically required to serve whatever quantity a customer demands at
these pre-set prices, what is known as a “requirements contract.”
As a result, the derived demand for electricity in the wholesale market be-
comes extremely inelastic at a given point in time, regardless of how much con-
sumers would actually respond if they faced retail prices that moved more dy-
namically with wholesale prices. This absence of real-time price signals to con-
sumers also exacerbates market power concerns, as the inelastic derived demand
makes the exercise of market power more profitable in the wholesale market.
B. Price caps in wholesale markets
Producers typically face price caps in the spot market for generating energy.
While firms generally hedge risk with long-term contracts and trade most of the
energy in advance, the prices for those trades are determined knowing that the
final spot price is limited. In some cases, price caps may limit the ability of
producers to exercise market power. However, they could also result in excess
demand if they are set below the competitive level. For example, this could occur
if short-run demand is even slightly elastic and fuel prices spike or other factors
cause short run marginal cost to rise above the price cap.
One common argument for capping the price of electricity and wholesale mar-
kets is based on the fact that electricity is physically supplied in real time, but
13 See Borenstein (2005). However, Schittekatte et al. (2022) provides an analysis suggesting that TOU pric-
ing may become more reflective of costs under high levels of shiftable loads that may result with electrification
of vehicles and buildings.
12financial settlements take place weeks later. So a buyer might be unaware that
they are consuming at an astronomical spot price, and be on the hook much
later for that payment. Wholesale buyers, however, submit demand quantities
that are a function of price, so they could impose their own price ceiling on their
wholesale purchases.
C. Correlated risks in generation availability
Supply-demand imbalances increase in likelihood if power plant outages may
result from common shocks. For example, a natural gas pipeline accident or
extreme cold could limit fuel supply for all gas-fired plants in a region, as hap-
pened in Texas in 2021. Similarly, a lull in regional wind associated with ex-
treme heat would limit production from all wind turbines. For conventional
technologies, most unplanned outages are primarily due to uncorrelated shocks,
such as equipment failures. However, as electricity systems decarbonize by in-
creasing generation from intermittent renewable resources—wind and solar—
availability will become more correlated across power generation sources either
due to known variation like the sun setting or stochastic events like cloud cover
or wind lulls.
D. Random rationing makes supply shortfalls a public bad
The likelihood of supply-demand imbalances due to the combination of price
caps, highly inelastic demand, and correlated risks is heightened when the ex-
pected peak demand is nearly as great as the entire aggregate capacity in the
system (i.e., when the reserve margin is tight). Because such imbalances are ad-
dressed by shutting off power by distribution circuit—without regard to will-
ingness to pay to avoid being blacked out or to who helped contribute to the
shortage by not investing in, or contracting for, capacity—power shortages are
turned into a “public bad” where individual retailers can free ride on one an-
other.
These challenges in wholesale markets imply that there are extraordinary con-
sequences of insufficient capacity investment. Like many capital-intensive in-
dustries where firms face uncertain demand in making irreversible investments,
power generation can exhibit boom-bust cycles. While other such industries—
such as resource extraction and semiconductors—have seen periods of high prices
followed by excess entry and a price crash, we do not see many calls for coor-
dinated firm investments in those industries. In fact, where such entities ex-
ist, such as OPEC, the negative impacts of their collusive activities are typically
highlighted. Nonetheless, because of the notable economic challenges discussed
here, some argue that there is need for coordinated capacity investment in elec-
tricity.
13IV. Current Approaches to Long-Run Supply Adequacy
Currently in the US, there are three general approaches to supporting long-
run capacity investment that is sufficient to meet expected demand, a process
called “resource adequacy” (RA) within the industry. The first approach is the
traditional electricity industry structure in which a monopoly utility makes in-
vestment under either the close regulation or direct ownership of the govern-
ment. The second approach is a deregulated wholesale “energy-only” structure,
similar to the process that drives investment in most other commodity markets.
Firms make decentralized and independent investment decisions based largely
upon expectations of future electricity prices. The third approach applies a hy-
brid of deregulation and centralized planning by imposing capacity procure-
ment requirements on electricity retail service providers operating in deregu-
lated markets. Figure 4 shows the seven US RTOs, of which only ERCOT has an
energy-only structure. The others markets follow the third approach and have
RA requirements (e.g., capacity markets).14 The areas in white remain under tra-
ditional vertical integration and manage resource adequacy primarily through
the state regulatory oversight process. We discuss the benefits and risks associ-
ated with each approach below.15
Figure 4. : Regional Transmission Organizations
14 Source is https://www.ferc.gov/sites/default/files/2020-05/elec-ovr-rto-map.pdf.
15 Some of the utilities in the white area of the map, while vertically integrated, participate in wholesale
markets that have some resource adequacy requirements, so the determination of capacity needs is a hybrid
of state regulatory oversight and the requirements of the wholesale markets in which they participate. Some
utilities within some of the RTOs remain vertically integrated, in that they still own significant generation that
is subject to state regulation, but by virtue of being part of the RTO, they are required to be part of the RTO’s
RA program.
14It is important to recognize that significant new capacity has been built under
all three approaches. Figure 5 shows the cumulative percent of existing capacity
(namely those still operating as of 2021) by the year that the capacity was added
to the grid.16 This is not a measure of total capacity in each year as plants that
have retired over this time are not included.
Figure 5. : Percent of Existing Capacity Reported Cumulatively by Initial Year
A. Traditional Vertical Integration and Regulation
Among the vertically integrated electric utilities, which still serve about one-
third of the US demand, the typical RA process involves joint planning between
the utility and its regulators to forecast future demand and establish “needs”
for new investment. Specific generation quantities and types, as well as alterna-
tives such as new transmission or demand reduction programs, are negotiated
between utility and regulator. Investment in new capacity is then either made
directly by the utility or purchased via a competitive solicitation overseen by
16 Data are from EIA form 860. All plants that began operating before 2000 are grouped in 1999.
15regulators. Once the need for new capacity is established, the recovery of in-
vestment costs is largely guaranteed by the regulator, except in the case of ex-
treme cost overruns or gross negligence. The coordination of investment and
retirement decisions for both generation and transmission is centralized within
a single decision-making process.
At first glance, the combination of regulatory oversight, vertical integration,
and monopoly franchise would seem to greatly simplify the process of resource
planning. The incentive to free ride on the supply of another retailer is sub-
stantially reduced, though it can still arise to some extent between utility service
areas that are part of the same grid, known in the industry as “leaning.”17
However, the traditional system lacks incentives for efficient investment given
the near-guaranteed recovery of investment costs.18 The system can create a
theoretical bias toward capital (Averch and Johnson, 1962), although the specific
implementation of regulation matters (Joskow, 1974). In general, the process can
create incentives to inefficiently overbuild, thereby enhancing system reliability
but at a potentially inflated cost (Joskow, 1997). Indeed, most of the impetus for
restructuring the industry inside the US arose in states with high rates that could
be traced to either excessive or inefficient investments in capacity (Borenstein
and Bushnell, 2000).
B. Deregulated wholesale markets without resource adequacy requirements
As described in Section I, the deregulation of generation meant the decentral-
ization of investment decisions in that sector. Regulatory reviews of investment
decisions had largely been motivated by a need to justify and approve expen-
ditures that would be added to the capital rate base of a regulated monopoly.
With deregulation, the capital invested in generation was no longer guaranteed
a regulated rate of return, and the dynamic therefore shifted from a concern over
excess investment to one of potential inadequacy.
As with markets for most commodities, many deregulated electricity markets
around the world rely upon expectations of future prices to provide the signal
and incentive for investment in generation capacity. Indeed, wholesale electric-
ity prices are quite sensitive to capacity margins. While prices typically range
from $10-$80 per MWh, negative prices and prices exceeding $1000 occur com-
monly (Table 2).
These markets depend on energy prices to signal the need for investment and
thus tend to feature high price caps and exhibit more volatile spot-market prices
Figure 6 shows the highest hourly price in a given month for the ERCOT (Texas)
17 The North American Electric Reliability Corporation (NERC), an industry association, has for decades
coordinated standards to prevent leaning between utility control areas. Shortly after the 2003 Northeast black-
out, the Federal Energy Regulatory Commission gave NERC authority to impose mandatory standards and
to enforce penalties for failure to meet them (Nevius, 2020).
18 Investments are evaluated by state regulators based on a ‘used and useful’ criterion. Rarely are costs
excluded from the rate base, which are then passed on to customers.
16Table 2—: Summary Statistics of Spot Prices in Wholesale Electricity Markets
Mean SD Min P10 Median P90 Max
CAISO 33.87 39.85 -186.32 13.43 29.14 48.93 985.76
ERCOT 27.51 44.14 -24.18 14.54 21.99 38.94 5001.00
ISONE 40.24 45.39 -157.85 14.77 28.52 71.17 2454.57
MISO 28.19 19.41 -29.94 17.45 24.36 40.80 1805.60
NYISO 27.24 26.86 -223.93 10.57 23.01 41.38 927.48
PJM 32.17 31.37 -229.98 17.12 26.21 48.11 1839.28
SPP 23.82 26.62 -57.42 11.46 19.75 35.53 1592.68
Notes: In most markets, hourly spot prices (in $ per MWh) are FERC 714 system lambdas that correspond to
average real-time prices in markets from January 2013 to December 2020. CAISO prices are from
www.energyonline.com.
energy-only market as well as for the two RTOs with the most mature capacity
markets. Of all of the RTOs, ERCOT has experienced the largest, most frequent,
and longest price spikes. While this mirrors the investment process in most other
industries, electricity markets face the challenges discussed earlier that exacer-
bate the size and potential disruption from supply-demand imbalances. Because
these imbalances are so costly, grid operators in energy-only markets typically
attempt to provide guidance on future demand and other information intended
to enable producers to plan more effectively.
Futures markets help enable capacity investment for production of a commod-
ity when prices are unstable by aggregating information and beliefs about the
future price, and by lowering the cost of making trades to hedge future prices.
Unfortunately, due to the properties of electricity, futures markets have had very
limited success. Since a futures contract specifies exact characteristics for de-
livery of a product—most importantly, in this case, the location and timing of
delivery—the contracts will be most valuable if prices at the specified time and
place of delivery are highly correlated with prices for delivery at other loca-
tions or times, or for closely related products. This minimizes “basis risk,” the
volatility of the price differential between the contracted commodity and the
commodity price for which one or both sides of the market is trying to hedge
risk. Electricity prices, however, exhibit extreme basis risk, with high storage
cost allowing temporally nearby prices to differ drastically and the potential for
transmission constraints allowing locationally nearby prices to differ drastically.
As a result, forward contracts for output from generation, while still fairly stan-
dardized in form, do not trade in a liquid or transparent market.
Finally, many energy-only wholesale markets are in areas with substantial re-
tail competition. The higher and more volatile energy prices heighten price risk
for retailers in energy-only markets. This price risk can provide a stronger incen-
tive for retailers to procure - or hedge - their energy in forward markets. Some
retailers physically hedge this risk by vertically integrating between generation
17Figure 6. : Maximum Hourly Real-time Prices by Month and Market
and retailing functions. Some, however, benefit from bankruptcy laws by offer-
ing a fixed retail price and not hedging: if the wholesale spot price ends up low,
they make money; if the wholesale price ends up high, they exit. When retailers
fail to hedge, however, that reduces the quantity of power purchased through
long-term contracts. Such contracts may be key to supporting investment in a
capital-intensive industry with irreversible investments.
In Texas, the massive reliability problems triggered by winter storm Uri in
February 2021 put the energy-only paradigm under greater scrutiny. It is not
clear, however, that the typical capacity markets would have coped much better
with that disruption. A critical element of winter storm Uri was the inability of
much of the installed generation capacity to operate reliably, in some cases due
to direct mechanical failures, but in more instances resulting from the lack of
available natural gas supply. As discussed below, many markets with capacity
requirements feature relatively weak incentives to ensure reliable performance
from the capacity that is procured, and the performance requirements in markets
that do feature them are arguably weaker than the $9000/MWh energy price that
was available for any generator that was able to produce during Uri.
18C. Deregulated wholesale markets with capacity payments
Many restructured power markets have adopted mechanisms that compensate
generators for maintaining adequate capacity in addition to payments for the
electricity produced from that capacity (Joskow, 2008). These regions combine
concepts from traditional regulation, where ratepayers paid for the construc-
tion and operating costs of power plants, and energy-only markets where cus-
tomers pay market prices for electricity. These deregulated wholesale markets
have preserved a layer of regulatory planning by creating a distinction between
“capacity” and the goods (e.g., electrical energy) produced by that capacity. In
general, capacity is procured through a coordinated planning process while en-
ergy is purchased in a more decentralized way. As we will discuss below, the
distinction between capacity and energy has always been somewhat blurry, and
is becoming more so with the advent of new supply technologies.
All markets with capacity payments follow a similar process with important
distinctions as to how each step in the process is implemented. At a high level,
this process entails the following steps.
1) A forecast of resource capacity need is determined at either a system or
individual load-serving entity level. These forecasts range from months to
several years into the future.
2) Capacity is procured in quantities that are certified to meet forecast needs.
The procurement is implemented in some regions by a central entity (such
as an RTO) and in others by a mandate applied to individual LSEs.
3) Capacity either does or does not perform during periods of tight resource
needs. The performance requirements and incentives placed upon the ca-
pacity that is procured has varied greatly across regions and over time.
A series of extremely contentious regulatory hearings have focused on the pro-
cess, the amount, and price of capacity that is procured. In the eastern US, grid
operators centrally procure capacity for all LSEs, running reverse auctions where
producers offer to have capacity available during a specific time period. In Cal-
ifornia, and much of the Great Plains, LSEs (including utilities) are obligated to
procure or self-supply an amount of capacity based on the peak demand they
serve, similar to an insurance mandate. Somewhat surprisingly, only recently
has attention begun to focus on the performance and reliability benefits actually
provided by the capacity that is procured.
Part of the argument for capacity payments is the presence of price caps in the
associated energy markets, which are in turn justified by concerns over excessive
market power in the energy markets. Price caps in electricity energy markets
are believed to deny suppliers legitimate scarcity rents at times, creating a so-
called “missing money problem” that constrains investment in capacity (Joskow,
2006; ?). Capacity payments are intended to replace those missing scarcity rents
19(Bushnell, 2005). While the justification for capacity payments can be traced to
market power concerns, it is important to note that the supply of capacity can
also be vulnerable to market power.
When suppliers are overly concentrated, a mandate to purchase capacity from
those suppliers can bestow market power upon them, at least in the short run.
This market power can be exacerbated when capacity procurement is divided
into localized markets with few sellers (Bowring, 2013). Conversely, state gov-
ernments and regulators have been accused of depressing capacity prices in
an anti-competitive manner by subsidising local generation through regulatory
procurement, tax credits, and other incentives.19
The forecasting process entails projecting peak electricity demand needs at ei-
ther a systemwide or LSE level. Projections of systemwide demand are more
reliable as they do not require forecasts of the market shares of individual LSEs.
Partly for this reason, regions that have adopted longer-term capacity requirements—
more than a year in advance—tend to do centralized capacity procurement by
the RTO based on systemwide demand forecasts.
The capacity planning approach has generally relied upon an explicit or im-
plicit assumption that if systems are capable of meeting the hour of highest sys-
tem demand, they will also be able to operate reliably in all other hours of the
planning horizon. In other words, this approach assumes that if a system has
enough capacity to meet its peak demand, it will have excess capacity in all other
hours. This assumption has always been tenuous when applied to resources for
which nameplate capacity may not reflect their ability to produce in a particular
hour. This is true not only of renewable electricity, but also “energy-limited” re-
sources such as hydroelectric power and storage. As these resources have come
to comprise a growing share of the mix, the standard planning paradigms have
become more stressed.
The supply shortages experienced in California during a heat wave in August
2020 provide an illustration of this issue. While California had a capacity require-
ment in place, it was focused on meeting hours of peak demand, usually in the
late summer afternoon. However, the rapid expansion of solar power in Califor-
nia over the last decade left the state with ample supply during peak hours, but a
critical need in the early evening as the sun set, which became known as the net
demand peak (net of generation from intermittent renewables). On August 14,
2020, California was forced to implement blackouts around 6:30 PM, more than
an hour after demand had peaked, when output was rapidly declining from
solar farms, which had been credited with over 3000 MW of capacity towards
meeting resource adequacy needs for that month (California ISO, 2021).20
Renewable and hydroelectric resources are not the only ones for which name-
19 Several RTOs have deployed Minimum Offer Price Rules (MOPR), essentially bid floors on supply offers
into capacity markets, in an attempt to offset these subsidies. These rules have been controversial in recent
years as they have raised the cost of procuring nuclear and renewable resources (Aargaard et al., 2022).
20 Solar was generating 3460 MW at 6:30 PM, but dropped by more than half by 7 PM and was down to 195
MW by 7:30 PM.
20plate capacity has at times proven to be a poor measure of reliability contribu-
tions. Older fossil power plants have experienced periods of frequent outages,
and historic approaches for penalizing such outages have been criticized as too
weak. In addition, fuel supply, particularly that of natural gas, has proven to
be a significant contributor to reliability problems in several regions, the most
notable being the experience of Texas during winter storm Uri in 2021.
Faced with resources whose availability was viewed as unreliable, some re-
gions have adopted more aggressive performance incentives for resources that
sell capacity. The main policy question concerns what types of availability prob-
lems should be the financial responsibility of the resource and what problems
should be considered a force majeure. Traditionally, for example, a capacity re-
source would not be considered responsible for a shortage of natural gas or low
levels of wind. Furthermore, penalties have been relatively modest even for out-
ages that were deemed the responsibility of the resource (Bushnell et al., 2017).
More recently, some RTOs, such as PJM and New England, have moved to shift
more liability for non-performance onto the sellers of capacity and have applied
steep penalties, on the order of $1000s per MWh to resources that are unavail-
able during a period of regional scarcity. By sharply increasing the per-MWh
cost of unavailability, such penalties create performance incentives for resources
that approach similar levels experienced in energy-only markets.21
V. Going forward: Decarbonization and Technological Change
Electricity policy faces the challenge of reducing GHG emissions while ensur-
ing reliable and affordable power. Costs have drastically declined for generation
from wind and solar—the two technologies most associated with decarbonization—
but output volatility from these sources would make supply less reliable if not
combined with other resources. Luckily, progress in complementary technolo-
gies continues, from energy storage and automated demand response to “firm”
carbon-free generation, such as new technologies for nuclear power and geother-
mal.
The shift to these alternative technologies affects power markets in three im-
portant ways: its impact on average wholesale energy prices; its impact on ca-
pacity market prices; and the extent to which intermittency of wind and solar,
and energy limitations of batteries, create new reliability concerns that are not
satisfactorily addressed by conventional RA crediting. Each of these concerns
have been observed in restructured electricity markets. In California, for exam-
ple, the penetration of utility-scale solar has helped drive low, or even negative,
energy prices during the middle of the day (Bushnell and Novan, 2021). In addi-
21 These so-called “performance capacity” policies have not been universally supported. Some critics fear
that these policies shift too much risk to supply resources and could as a result lead to either under-investment
or higher capacity prices. Others have pointed to the fact that penalties have rarely been applied. Natural gas
shortfalls at some plants in New England during recent cold-weather conditions caused ISO-NE and PJM to
trigger performance penalties for only the second time in over five years Barndollar (2023)
21tion to influencing energy prices, renewable generation has earned an increasing
share of capacity payments.
One key policy question, therefore, is whether alternative resources, such as
renewable generation or battery storage, can and should provide a comparable
form of “capacity” as conventional resources. Such questions get to the heart
of what has been a central issue with RA policy from the start: what exactly
constitutes “capacity” under such policies?
RTOs have struggled even to define the attributes that constitute the bound-
aries between conventional and alternative resources. Lithium-ion batteries pro-
vide a useful illustration. Battery chemistries continue to evolve and with them,
their performance characteristics: charging and discharging speeds, round-trip
energy loss, and capacity degradation and failure probabilities from different
sorts of usage profiles. As an electricity storage technology, batteries must also
be charged at some point, so their reliability value depends on the ability to
adequately charge as well as discharge when they are called upon. And the
incremental value of storage depends on the dispatchability of the electricity
generating technologies on the grid. A system with high levels of dispatchable
carbon-free generation will derive less value from storage technologies than one
more dependent on intermittent renewables.
Among the key questions that have been debated and periodically revised are
the following:
• Should capacity qualifying to provide RA be limited to resources that can
be made available on demand, or evaluated based upon a probabilistic
expectation of performance?
• How location specific should capacity procurement be?
• What performance obligations should be required?
• What are the penalties for non-performance?
These questions highlight the distinction between an energy-only setting and
those with compensation for capacity. Performance in an energy-only setting is
simply the sale of energy (or ancillary services) in a daily or hourly market. If a
unit is operating and selling into the market, it earns revenue. If it is not, then
it earns no revenue. Under a capacity payment paradigm, qualified units earn
revenue in advance and can keep those earnings, in most cases even if the unit is
not available under a long set of possible exemptions. When RA resources were
of similar technologies and operated by firms with similar incentives, common
assumptions about availability did not distort procurement very much. How-
ever, with more diverse resources, RTOs are again revisiting their assumptions
about performance and the incentives provided to resources committed through
RA markets.
Resource mix and resource adequacy paradigms also have implications for en-
ergy markets. Increasing generation shares from intermittent resources without
22You can also read