The Climate Change Performance Index Results 2012
←
→
Page content transcription
If your browser does not render page correctly, please read the page content below
The Climate Change
Performance Index
          Results 2012

                  C H A NGE
               TE
          CLIMAORMANCE

             de
           PERF

           in  x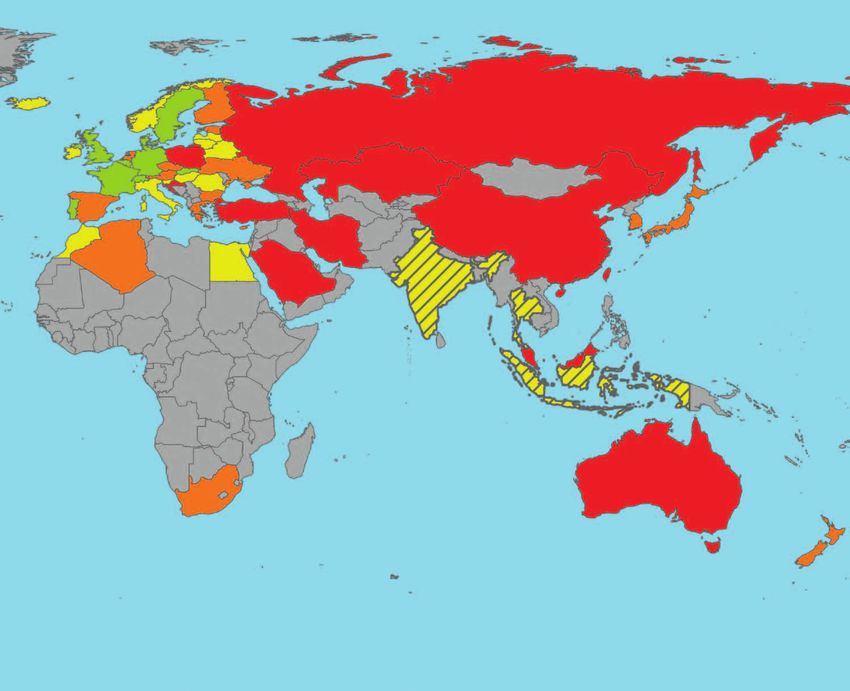
G e r m a n watch                                        CAN
    Germanwatch - Bonn Office                                Climate Action Network Europe
    Kaiserstraße 201                                         Rue d‘Edimbourg 26
    53113 Bonn, Germany                                      1050 Brussels
    Ph.: +49 (0) 228 - 60492-0                               Belgium
    Fax: +49 (0) 228 - 60492-19
                                                             Ph.: +32 (0) 28 94 46 70
    Germanwatch - Berlin Office                              Fax: +32 (0) 28 94 46 80
    Schiffbauerdamm 15
    10117 Berlin, Germany                                    E-Mail: info@climnet.org
    Ph.: +49 (0) 30 - 28 88 356-0                            www.climnet.org
    Fax: +49 (0) 30 - 28 88 356-1

    E-Mail: info@germanwatch.org
    www.germanwatch.org

    Authors: Jan Burck, Christoph Bals, Kathy Bohnenberger

    Editing: Anika Busch, Simone Ackermann, Gerold Kier

    Design: Dietmar Putscher, Cologne
    www.dietmar-putscher.de

    Printed on 100% recycled paper

    December 2011

    Purchase Order Number: 12-2-01e

    ISBN 978-3-939846-89-5

    This publication can be downloaded at:
    www.germanwatch.org/ccpi

    With financial support from the European Union
    and the Barthel Foundation

2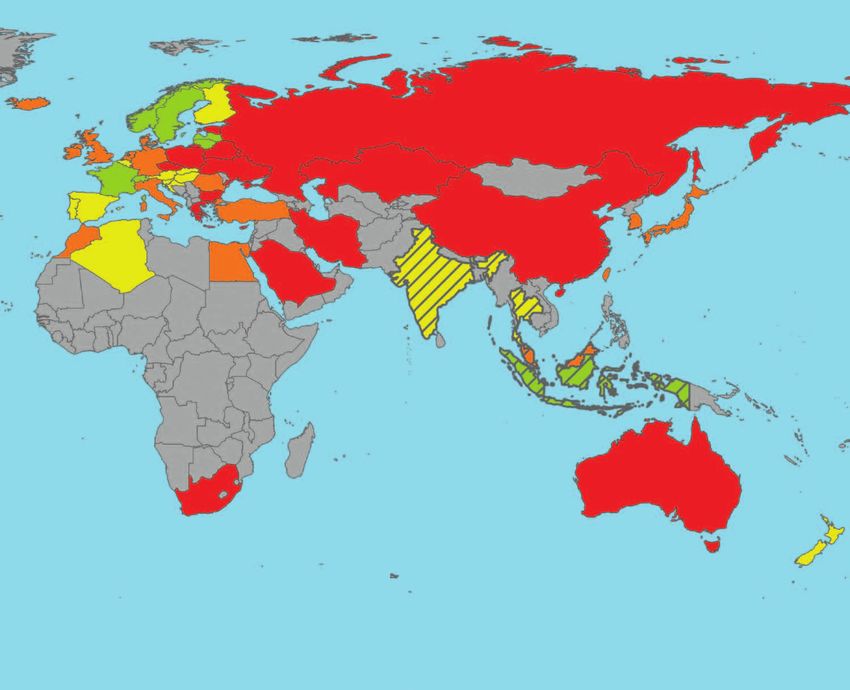
F o r e word                                                                CLIMATE CHANGE
                                                                             PERFORMANCE
Dear Reader,

The Climate Change Perfor-
                                                                            index
mance Index (CCPI) aims at
enhancing transparency of na-
tional and international efforts
to avoid dangerous climate
change. On the one hand, this
tool quickly shows who is doing
what regarding climate change.
On the other hand, it provides
more information about the strengths and weak-
nesses of different countries in various sectors.
Due to data limitation, this publication only covers
emissions from CO2 emissions arising from the use
of fossil fuels. It does not deal with emissions from
deforestation, agriculture and waste, but we hope to
integrate these in the next edition of the CCPI.

The following publication is issued by Germanwatch
and Climate Action Network Europe. However, none
of this could have been possible without the help of
the over 200 energy and climate policy experts from
around the world.

Each of these experts has greatly assisted us by tak-
ing their time to provide invaluable reviews of na-
tional and international climate and energy policies.
These experts are working hard in their own coun-
tries to fight for the implementation of the climate
policy that we desperately need.

Best regards,
                                                        C o nt e nt s

                                                        Foreword                                    3

Jan Burck                                               1. Key Findings                             4

                                                        2. About the CCPI                           5

                                                        3. Overall Results
                                                           Climate Change Performance Index 2012    6
                                                           CCPI World Map                           8

                                                        4. Partial Results
                                                           4.1 Emissions Trend                     10
                                                           4.2 Emissions Level                     12
                                                           4.3 Climate Policy                      14

                                                        5. Country Comparison:
                                                           South Africa and Mexico                 16

                                                        6. Climate Change Performance Index
                                                           by Country Group                        18

                                                        7. Sources                                 19

                                                                                                        3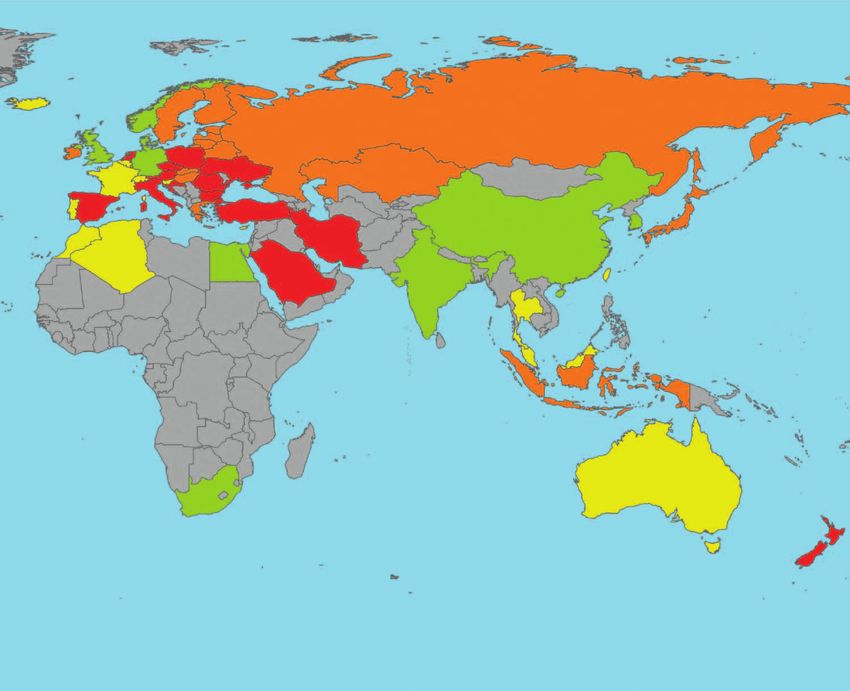
1. Key Findings

    This years Climate Change Performance Index (CCPI)         tion policy is rapidly intensifying through nation-
    shows some interesting and worrying results.               ally binding energy-intensity reduction targets
                                                               and a three-percent renewable-energy portfolio
    ■ As in the years before, we still cannot reward any       requirement. By now, China, which was previ-
      country with the rankings 1-3, as no country is do-      ously considered a “nobody” in renewable energy
      ing enough to prevent dangerous climate change.          production, is installing about half of the global
    ■ Sweden is back at the top and ranks 4th. This is es-     renewable energy capacity per year. China’s posi-
      pecially due to their low emissions level and good       tion in the index will dramatically improve as soon
      emissions trend in some sectors (esp. housing sec-       as these positive trends will influence its emis-
      tor). However, Swedish experts are criticising the       sions trend.
      Swedish climate policy as being not ambitious          ■ One important factor for this years’ index is the
      enough and insufficient with regard to the 2°C           financial and economic crisis of 2008 and 2009,
      limit.                                                   which, as an unintended positive side effect, had
    ■ The UK, ranked 5th, has shown strong elements of         a favourable influence on emissions trends of,
      environmental leadership, but recently there have        e.g., Ireland and Spain, both of which climb up
      been worrying signs (e.g. ignoring recommen-             ten ranks in the Emissions Trend Indicator.
      dations of the Committee on Climate Change to          ■ The economic crisis also signified an opportu-
      tighten up the intervening carbon budgets) that          nity for countries with high emissions levels to
      the UK is stepping back from its efforts, which has      remodel their economies to include policies for a
      kept them from achieving the top position.               sustainable use of environmental regeneration. In
    ■ Brazil lost its top ranking because of increasing        order to include this development and bring the
      emissions. Also, the emissions from deforestation        index up-to-date, a new indicator which measures
      have increased since the end of 2010. Brazil would       the trend of CO2 per capita emissions from 2009
      have received a worse ranking if the absolute            to 2010 is included in this year’s index. This in-
      emission indicators reflected not only energy, but       dicator rewards countries for which the financial
      also forest-related emissions.                           and economic crisis led not only to a dent in a con-
                                                               tinuously rising emissions trend, but which also
    ■ Germany’s new energy concept and a relatively            contributed to further reductions in emissions
      good emissions trend resulted in a better evalu-         during economic recovery.
      ation of the national climate policy and, there-
      fore, a climb from the seventh to the sixth rank.
                                                             ■ Australia has made encouraging steps towards
      However, the emissions level in Germany is still         improved climate policy. The experts recognized
      too high for a top placement.                            the new carbon tax as especially positive. Due to
                                                               continuously high emissions, Australia remains
    ■ Overall, mostly due to discouraging emissions lev-       in the last quarter of the CCPI. However, the lat-
      els and trends, the three lowest-ranking countries       est emissions trend and the policy evaluation
      are Saudi Arabia, Kazakhstan and Iran.                   made Australia climb ten ranks and indicate that
                                                               Australia has the ability to climb up in future rank-
    ■ The US has climbed up two ranks mainly due to its        ings.
      reduction in emissions as a result of the economic
      crisis. However, the US remains at the bottom end      ■ Poor emissions trends and poor policy evaluations
      of the index because of poor policy evaluations          made the Netherlands lose twelve ranks.
      and a very high emissions level.
                                                             ■ There are several leading countries in Europe,
    ■ India dropped 13 ranks because of a worse overall        above all Sweden, UK and Germany. Here, per-
      performance, especially because of a worse per-          formance rankings have increased during the last
      formance in the emissions trend.                         year. However, within Europe, countries such as
                                                               Turkey, Poland and Croatia hold some of the low-
    ■ China’s climate performance is full of contradic-        est positions in the overall ranking. This is partly
      tions. While China (in absolute, not in per-capita       due to their policy evaluations. During its presi-
      terms) remains the world’s largest CO 2 emit-            dency of the European Council, Poland blocked
      ter with dramatically growing emissions (with a          the proposed EU’s 30 percent reduction target
      growing gap when comparing China with all other          (until 2020).
      countries), the focus on national emissions reduc-

4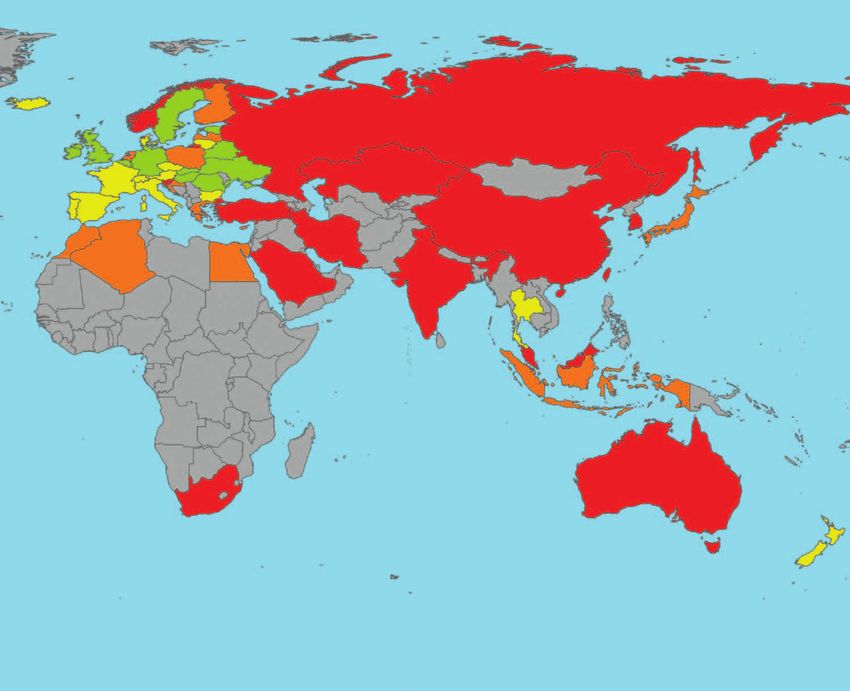
■ Within the first ten-ranking countries, Denmark                   ■ The average grades for the national and interna-
     improved its performance the most. This can be                    tional policies are weak. Most experts are not sat-
     attributed to its improved national and interna-                  isfied by far with the efforts of their governments
     tional climate policy.                                            with regard to the 2°C limit.

■ It is especially worrying that the global trend to-               ■ This year’s host country of the UN Climate Summit,
     wards burning coal (and oil from tar sands) has                   South Africa, is showing an improved performance
     not been stopped. This is the main reason why we                  in the field of national climate policy each year.
     see emissions per gross domestic product (GDP)                    However, their emissions are still relatively high
     increasing in many countries.                                     and the country remains addicted to coal.

■ There is a robust trend towards increasing nation-                ■ China, Mexico, Korea and South Africa are the
     al renewable energy capacity. Especially China,                   countries with the best policy evaluation. Mexico
     the US and Germany are successful in this field.                  was explicitly rewarded for the excellent COP
                                                                       Presidency last year in Cancun.
■ The countries with the worst score in the indicator
     ‘emissions levels’ are Kazakhstan, Saudi Arabia
     and Estonia.

2. About the CCPI

The Climate Change Performance Index is an instru-                  The ranking results are qualified in relative (bet-
ment supposed to enhance transparency in interna-                   ter – worse) and not absolute terms (good – bad).
tional climate politics. Its aim is to encourage po-                Therefore, even countries with high rankings have
litical and social pressure on those countries which                no reason to sit back and relax. On the contrary, the
have, up to now, failed to take ambitious actions on                results illustrate that even if all countries were as
climate protection as well as to highlight countries                involved as the current “trailrunners”, efforts would
with best-practice climate policies.                                still be insufficient to prevent dangerous climate
                                                                    change.3
On the basis of standardised criteria, the index eval-
uates and compares the climate protection perfor-                   Hence, again this year, no country was awarded one
mance of 58 countries that are, together, respon-                   of the rankings one to three. The poor performance
sible for more than 90 percent of global energy-re-                 of the majority of the ten largest CO2 emitters (Table
lated CO2 emissions. 80 percent of the evaluation is                2) is particularly alarming. These countries account
based on objective indicators of emissions trend and                for more than 60 percent of global CO2 emissions.
emissions level (50 percent for emissions trend, 30                 Therefore, their future willingness and ability to pur-
percent for emissions level).1 20 percent of the index              sue sustainable climate policy is a requirement for
results are built upon national and international cli-              avoiding a highly dangerous level of climate change.
mate policy assessments by more than 200 experts                    However, the latest emissions trend shows that none
from the respective countries. An example of the                    of these countries has started sufficiently decou-
methodology of the index can be found under section                 pling CO2 growth and GDP growth.4
5 “Country Comparison“ and extensive explanations
are available in “The Climate Change Performance
Index: Background and Methodology”.2

1
    Regarding the emissions trends, the CCPI 2012 compares the time period between 2004 and 2009. For the emissions level, data
    from the last three years with available data (2007 to 2009) is taken into account.
2
    www.germanwatch.org/klima/ccpi-meth.pdf
3
    The most serious consequences of global warming (dangerous climate change) might be avoided if global average temperatures
    will not exceed 2° above pre-industrial levels. To ensure this, global GHG emissions must be reduced by 80 percent by 2050.
4
    PWC: Counting the cost of carbon: Low carbon economy index 2011, www.pwc.com/gx/en/low-carbon-economy-index
                                                                                                                                  5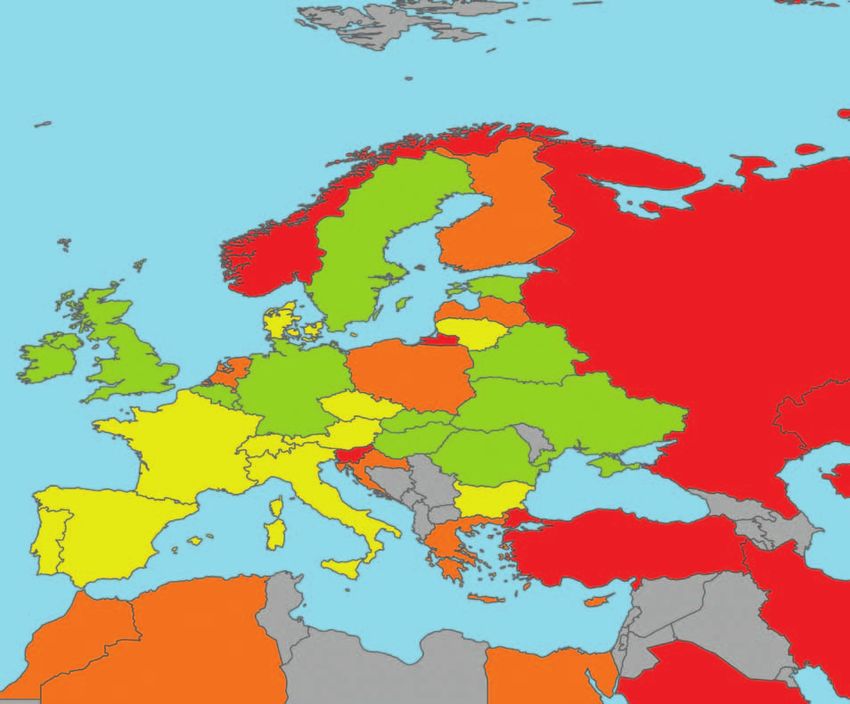
3. Overall Results
Climate Change Performance Index 2012
Table 1:
Rank Country Score** Partial Score Rank Country Score** Partial Score
Tendency Trend Level Policy Tendency Trend Level Policy
1* – – 21 - Egypt*** 59.1
2* – – 22 T Latvia 59.1
3* – – 23 T India 58.6
4 E Sweden 68.1 24 T Thailand 58.4
5 E United Kingdom 67.4 25 T Morocco 57.9
6 E Germany 67.2 26 T Indonesia 57.2
7 T Brazil 66.9 27 T Belarus 56.3
8 E France 66.3 28 R Romania 55.9
9 E Switzerland 65.1 29 E Slovenia 55.6
10 E Mexico 64.6 30 E Italy 55.4
11 E Slovakia 64.0 31 E Luxembourg 55.2
12 E Denmark 63.9 32 E New Zealand 54.5
13 E Belgium 63.8 33 T Algeria 54.4
14 R Portugal 62.9 34 E Austria 54.3
15 T Norway 61.9 35 R Spain 54.2
16 E Lithuania 61.4 36 E Cyprus 54.0
17 E Ireland 60.9 37 T Finland 53.9
18 T Hungary 60.7 38 T South Africa 53.6
19 T Malta 60.6 39 T Ukraine 53.3
20 E Iceland 59.8 40 E Estonia 53.0
comparison with previous year © Germanwatch 2010 comparison with previous year © Germanwatch 2011
* None of the countries achieved positions one to three. ** rounded
No country is doing enough to prevent dangerous climate change. *** new in the CCPI 2012
6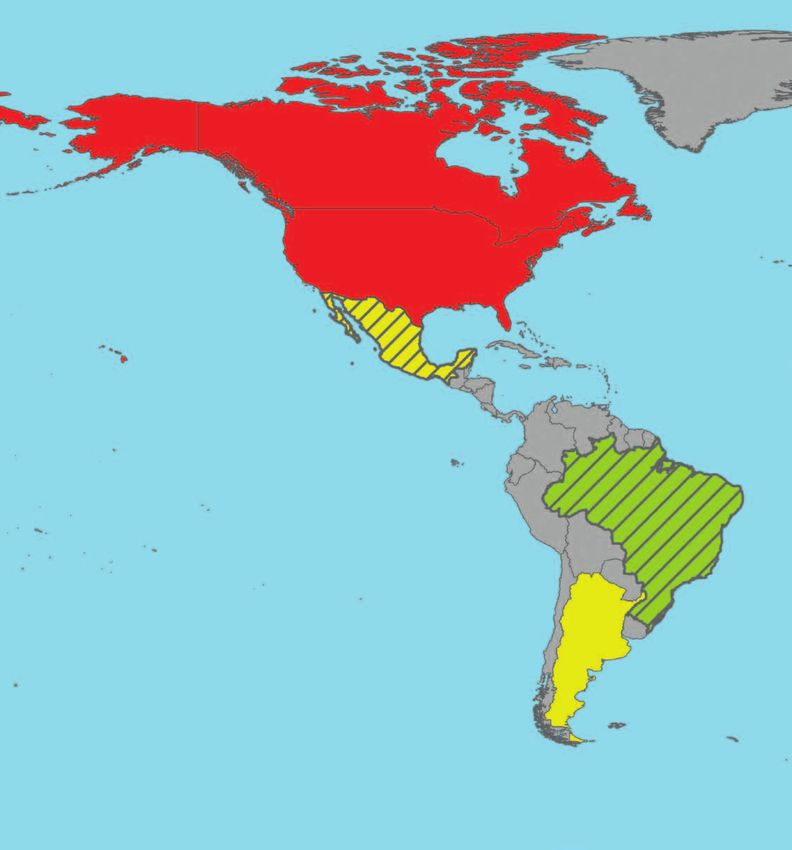
CLIMATE CHANGE

                                                                                                                     index
                                                                                                                      PERFORMANCE

Rank Country                          Score** Partial Score
Tendency                                          Trend        Level Policy

41   T      Korea, Rep.                    52.3
                                                                               Table 2:
                                                                               Index ranking of the 10 largest CO2 Emitters
42   T      Netherlands                    51.4
                                                                                Country                 Share of Global    CCPI Rank
43   T      Japan                          51.1                                                         CO2 Emissions*    2011 2012

44   E      Bulgaria                       51.1                                 United Kingdom              1.61 %           8        5

45   T      Argentina                      50.8                                 Germany                     2.59 %           7        6

46   T      Czech Republic                 50.4                                 India                       5.47 %        10         23

47   T      Greece                         50.3                                 Korea, Rep.                 1.78 %        34         41

48   E      Australia                      49.8                                 Japan                       3.77 %        38         43

49   E      Malaysia                       49.2                                 USA                        17.91 %        54         52

50   T      Chinese Taipei                 49.0                                 Canada                      1.80 %        57         54

51   T      Singapore                      48.9                                 Russia                      5.28 %        48         55

52   E      USA                            48.5                                 China                      23.71 %        56         57

53   T      Croatia                        47.2                                 Iran                        1.84 %        52         60
                                                                               * energy related                           © Germanwatch 2011
54   E      Canada                         46.3

55   T      Russia                         45.1                                Index Categories
                                                                                            Emissions Trend (50% weighting)
56   T      Poland                         45.1
                                                                                            Emissions Level (30% weighting)
57   T      China                          44.6                                             Climate Policy (20% weighting)

58   T      Turkey                         41.7                                Rating
                                                                                            Very good
59   R      Kazakhstan                     38.1
                                                                                            Good
60   T      Iran                           36.0                                             Moderate
                                                                                            Poor
61   R      Saudi Arabia                   24.5
                                                                        0,0                 Very poor
           comparison with previous year                  © Germanwatch 2011

                                                                                                                                               7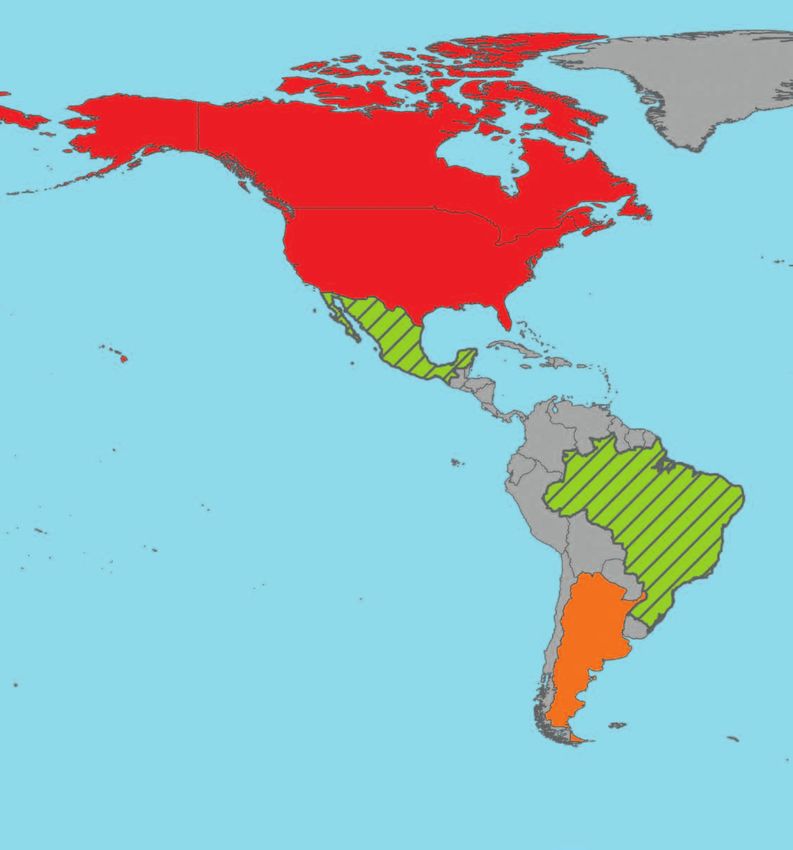
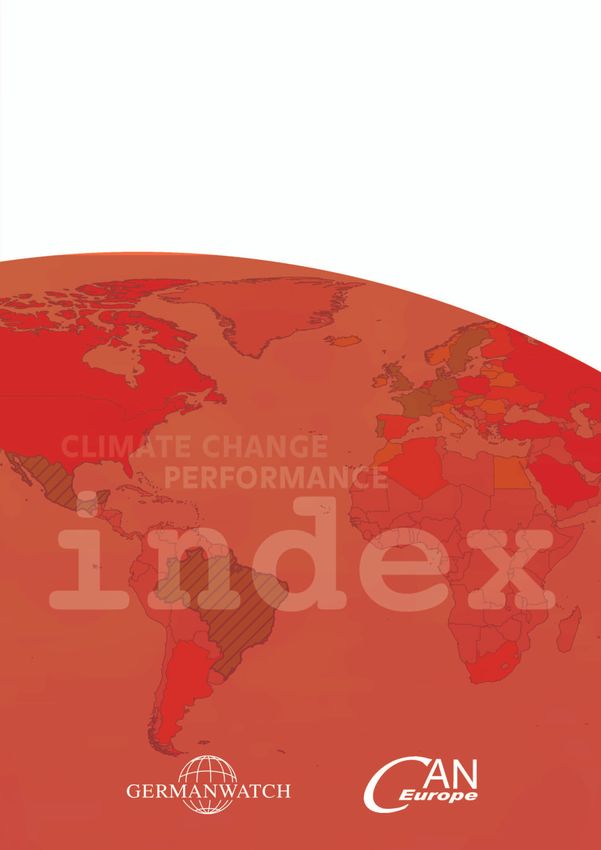
3. Overall Results • CCPI World Map

                                    Map 1a

                               CLIMATE CHANGE

                               index
                                PERFORMANCE

                 Map 1b

                                                                  © Germanwatch 2011

    As portrayed on the world map, the highest rank-        focuses on energy-related emissions, which make up
    ings are awarded to several European countries and      roughly 60 percent of GHGs. Especially in countries
    to Brazil and Mexico. These nations are listed as the   such as Brazil and Indonesia, where emissions from
    relatively best performers in climate change protec-    deforestation amount to 80 and 45 percent of total
    tion among the 58 countries.                            emissions respectively, efforts to reduce emissions
                                                            from deforestation and forest degradation must in-
    Due to the lack of reliable data on issues such as      crease, and financial support from the international
    deforestation and land-use change, activities which     community must be provided. For those countries,
    are responsible for around 20 percent of global         the rating would be quite different if forest emis-
    greenhouse gas (GHGs) emissions, the index only         sions were taken into account.

8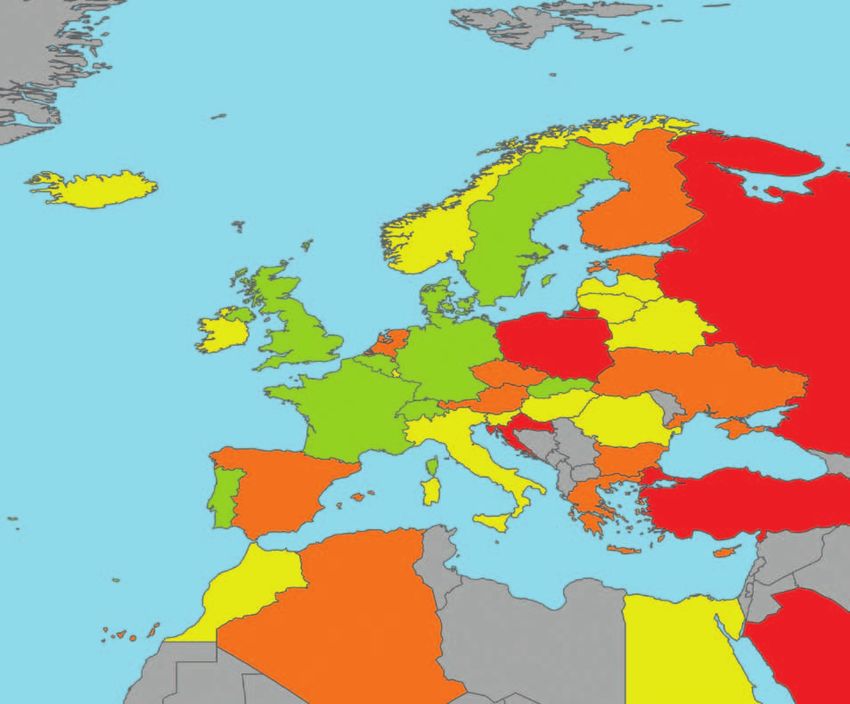
© Germanwatch 2011

As shown in the EU-focused map, climate change         Performance
performance varies widely across the continent.
                                                            Very good
Within Europe, there are some leading countries,
above all Sweden, UK and Germany. Here, perfor-             Good
mance rankings have increased during the last year.         Moderate
However, within Europe, countries such as Turkey,
Poland and Croatia hold some of the lowest posi-            Poor
tions in the overall ranking. This is partly due to         Very poor
their policy evaluations. Poland was, together with
                                                            Not included in assessment
Italy, the leader of those EU states which blocked
the adoption of the proposed 30 percent emissions           More than 10% of total emissions
                                                            from land use changes. They are not
reduction target (until 2020) in the EU. Poland was         included in the index calculations.
also actively blocking EU climate funding decisions.

                                                                                                  9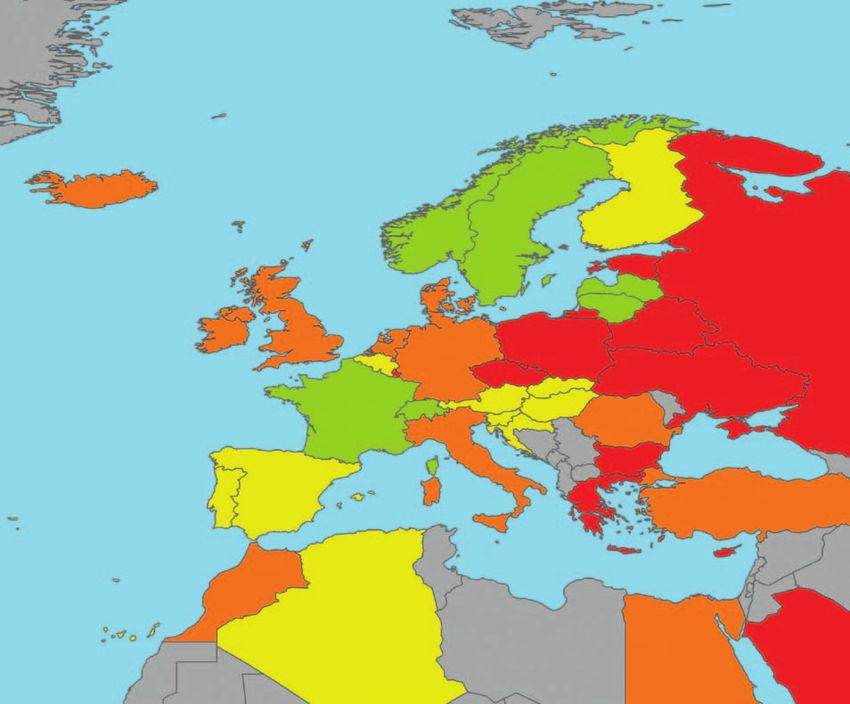
4.1 Partial Results • Emissions Trend

                                     Map 2a

                           CLIMATE CHANGE

                           index
                            PERFORMANCE

      Map 2b

                                                                    © Germanwatch 2011

     The emissions trend is the most important indicator      especially as their emissions reductions are mainly
     set within the CCPI, as it composes 50 percent of        a result of the economic crisis and not due to active
     the ranking’s weight. Therefore, if countries wish       reduction policy.
     to improve their ranking, it is vital to lower their
     emissions trend; yet, while policy decisions largely     Conversely, China, Saudi Arabia, Iran, Korea and
     contribute to the trend, it takes time until they have   Kazakhstan have the worst emissions trend meas-
     an effect. The map clearly shows that only European      ured over the last five years. In China and Korea the
     countries managed to achieve a better-than-aver-         emissions trend might improve in the coming years
     age ranking this year, especially the Ukraine, Ireland   due to a relatively good trend of renewable energy
     and Slovakia. However, even these countries are          policy. The green growth strategy of Korea cannot
     not on track to prevent dangerous climate change,        yet be seen in the latest emissions data.

10
© Germanwatch 2011
Performance
Very good
Good
Moderate
Poor
Very poor
Not included in assessment
114.2 Partial Results • Emissions Level
Map 3a
CLIMATE CHANGE
index
PERFORMANCE
Map 3b
© Germanwatch 2011
Regarding emissions levels, results are poor across cause lock-in situation of many states – the 2˚C
the board and inadequate by far to meet the 2˚C limit will be without reach within this decade, if
limit set by the UNFCCC in Cancun. this trend continues. The increases in energy ef-
ficiency are not big enough by far to counter this
Due to high oil and gas prices, coal has a competi- effect. Investments in renewable energy continue
tive advantage. The heavy increase in coal use is to grow dramatically, but the basis on a global scale
the most relevant factor for the massive increase in is not yet high enough to produce a negative emis-
global absolute emissions. New coal power stations sions trend.
12Performance
Very good
Good
Moderate
Poor
Very poor
Not included
in assessment
More than 10% of total
emissions from land use
changes. They are not
included in the index
calculations.
© Germanwatch 2011
Table 3: Key Data for the 10 Largest CO2 Emitters
Country CCPI Rank Share of Share of Global Share of Share of
2011 2012 Global Primary Energy Global GDP Global
CO2 Emissions* Supply Population
United Kingdom 8 5 1.61 % 1.62 % 2.71 % 0.91 %
Germany 7 6 2.59 % 2.62 % 3.49 % 1.21 %
India 10 23 5.47 % 5.56 % 7.11 % 17.09 %
Korea, Rep. 34 41 1.78 % 1.89 % 1.78 % 0.72 %
Japan 38 43 3.77 % 3.88 % 5.28 % 1.88 %
USA 54 52 17.91 % 17.80 % 17.68 % 4.55 %
Canada 57 54 1.80 % 2.09 % 1.59 % 0.50 %
Russia 48 55 5.28 % 5.32 % 2.38 % 2.10 %
China 56 57 23.71 % 18.70 % 19.35 % 19.80 %
Iran 52 60 1.84 % 1.78 % 0.90 % 1.08 %
Total 65.76 % 61.27 % 62.27 % 49.84 %
*energy related © Germanwatch 2011
134.3 Partial Results • Climate Policy
Map 4a
CLIMATE CHANGE
index
PERFORMANCE
Map 4b
© Germanwatch 2011
More than 200 experts from non-governmental Countries with the best national climate policy eval-
organizations (NGOs) contributed to the prepara- uations are China, Korea and India. Germany will
tion of the index by rating their countries’ national probably improve at the national level, through the
and international climate policies. The results are established plan to shift away from nuclear energy
illustrated on “Map 4. The Evaluation of Countries’ and the prospective coal phase-out, which ultimate-
National and International Climate Policy”. This year, ly sets incentives for renewable energy and energy
the experts’ assessment for the first time contains an efficiency investments.
evaluation on the policy of deforestation and forest
degradation – a first step to including this highly rel- Furthermore, Australia rose ten ranks on the national
evant sector in the methodology of this index. level by enacting a state-wide carbon price (and a
prospective emission trading system) in November
2011.
14© Germanwatch 2011
The lowest rank in climate policy is still held by Saudi Performance
Arabia. Through its vast financial resources and large
Very good
capability to produce solar and hydrogen-based en-
ergy, it has the opportunity to play a leading role Good
in finding solutions to climate change. However, as Moderate
evident by its extremely high emissions levels and
trends as well as lack of positive policy approach- Poor
es – on national and especially international levels Very poor
–, Saudi Arabia remains a considerable part of the
Not included in assessment
problem.
On the international level, the efforts of Mexico,
Norway, UK and South Africa are being rewarded
with especially good evaluations by local and inter-
national experts. Also in this field, Saudi Arabia, Iran,
Italy, Canada and Turkey’s assessment results were
especially bad.
155. Country Comparison: South Africa and Mexico
Table 4: South Africa
Indicator Score* Rank** Weight Rank**
Electricity 59.0 45 7.0%
Industry 74.5 23 6.0%
Sectoral
Trend Road Transport 52.0 45 3.0%
Emissions Trend International Aviation 84.9 12 3.0% 51
Residential 0.0 61 4.0%
Renewable Energy Trend 11.0 51 7.0%
CO2 per Capita Emissions Trend 50.7 16 5.0%
Target Performance Comparison 49.3 43 15.0%
CO2 per Primary Energy Unit 24.1 48 15.0%
Emissions Level Primary Energy per Capita 84.2 30 7.5% 51
Primary Energy per GDP Unit 56.4 54 7.5%
national 77.5 13 10.0%
Climate Policy 11
international 82.8 7 10.0%
Overall 53.6 100.0% 38
*Minimum: 0, maximum: 100 **out of 61, none of the countries achieved positions one to three. © Germanwatch 2011
The weighted sum of each country’s scores for all par- Africa ranks poorly, while Mexico achieves an aver-
tial indicators makes up the country’s overall score, age ranking. South Africa’s strong coal dependency
determining its position in the index. However, the is the main reason for this difference. The increas-
ranking does not state how much and in which regard ing use of coal is another reason that explains why
a country’s performance differs from the others. To South Africa has dropped nine ranks compared to
see how much the individual country results differ, last years’ index in the average of all emissions level
one must examine the scores of the various indica- indicators.
tors.
Furthermore, a difference can be found in anoth-
This year’s comparison of Mexico and South Africa er sub-indicator: Mexico’s results are much better
provides a closer look at the 2010 and 2011 hosts (rank 13) than South Africa’s (rank 30) regarding the
of the UN climate conferences. In comparison to primary energy use per capita.
last year, South Africa has dropped nine ranks in the
overall ranking, and Mexico has dropped one rank. Regarding emissions trends, the rankings for sub-
Both countries’ rankings differ fundamentally in indicators vary greatly between South Africa and
some of the indicators. The following analysis looks Mexico. They have little in common concerning
at the background of these individual indicators: their strengths and weaknesses in individual indica-
tors. South Africa’s ranking is relatively lower than
With regard to the sub-indicators of the emissions Mexico’s in terms of emissions trends of electricity,
level ‘CO2 per primary energy unit’ and ‘primary en- transport, and the residential sector, in the renew-
ergy per gross domestic product (GDP) unit’, South able energy trend, CO2 per capita emissions trend
16CLIMATE CHANGE
index
PERFORMANCE
Table 5: Mexico
Indicator Score* Rank** Weight Rank**
Electricity 76.8 22 7.0%
Industry 65.1 35 6.0%
Sectoral
Trend Road Transport 50.0 48 3.0%
Emissions Trend International Aviation 81.5 26 3.0% 24
Residential 52.9 22 4.0%
Renewable Energy Trend 14.9 42 7.0%
CO2 per Capita Emissions Trend 57.6 11 5.0%
Target Performance Comparison 67.2 20 15.0%
CO2 per Primary Energy Unit 34.4 28 15.0%
Emissions Level Primary Energy per Capita 92.4 13 7.5% 20
Primary Energy per GDP Unit 85.1 29 7.5%
national 68.3 21 10.0%
Climate Policy 6
international 100.0 4 10.0%
Overall 64.6 100.0% 10
*Minimum: 0, maximum: 100 **out of 61, none of the countries achieved positions one to three. © Germanwatch 2011
and target-performance comparison; however, the evaluation of national climate policy of the coun-
Mexico has poorer scores concerning its sectoral try shows a strong improvement: South Africa could
trend in industry, road transport and international gain 29 ranks. These new policy approaches will later
aviation. The sector in which Mexico ranks worst is be translated into a change in emissions trend. It will
road transport; this can be explained by insufficient be interesting to see whether the ambitious South
promotion of alternative transport to cars in cities African Renewables Initiative (SARi) – a cooperative
as well as the increase of car use for long-distance project with a number of European countries for a
transport. rapid increase in the share of renewable energy –
will be translated into reality.
Compared to last year, South Africa has lost some
ranks in all trend indicators, especially in the sectoral The good evaluations of Mexico’s international cli-
trends for electricity, industry, and national trans- mate policy originate mainly from the excellent per-
port, and the target-performance comparison. This formance as COP president in Cancún.
reflects the country’s distance from the necessary
emissions trend. It is therefore not astonishing that
South Africa has lost 18 ranks compared to last year
when considering all trend indicators together.
Though South Africa’s performance has degraded
in the emissions trend and emissions level, there is
still reason for hope since (compared to last year)
176. Climate Change Performance Index by Country Group
The following tables show countries categorised by
groups which enables a comparison of emitters with
more or less similar basic conditions.
Table 6: Climate Change Performance Index for OECD Member Countries
Rank Country Score Rank Country Score Rank Country Score
4 Sweden 68,1 15 Norway 61.9 41 Korea, Rep. 52.3
5 United Kingdom 67.4 17 Ireland 60.9 42 Netherlands 51.4
6 Germany 67.2 18 Hungary 60.7 43 Japan 51.1
8 France 66.3 20 Iceland 59.8 46 Czech Republic 50.4
9 Switzerland 65.1 30 Italy 55.4 47 Greece 50.3
10 Mexico 64.6 31 Luxembourg 55.2 48 Australia 49.8
11 Slovakia 64.0 32 New Zealand 54.5 52 USA 48.5
12 Denmark 63.9 34 Austria 54.3 54 Canada 46.3
13 Belgium 63.8 35 Spain 54.2 56 Poland 45.1
14 Portugal 62.9 37 Finland 53.9 58 Turkey 41.7
© Germanwatch 2011
Table 7: Climate Change Performance Index for EU Member Countries
Rank Country Score Rank Country Score Rank Country Score
4 Sweden 68,1 17 Ireland 60.9 35 Spain 54.2
5 United Kingdom 67.4 18 Hungary 60.7 36 Cyprus 54.0
6 Germany 67.2 19 Malta 60.6 37 Finland 53.9
8 France 66.3 22 Latvia 59.1 40 Estonia 53.0
11 Slovakia 64.0 28 Romania 55.9 42 Netherlands 51.4
12 Denmark 63.9 29 Slovenia 55.6 44 Bulgaria 51.1
13 Belgium 63.8 30 Italy 55.4 46 Czech Republic 50.4
14 Portugal 62.9 31 Luxembourg 55.2 47 Greece 50.3
16 Lithuania 61.4 34 Austria 54.3 56 Poland 45.1
© Germanwatch 2011
Table 8: Climate Change Performance Index for Countries in Transition
Rank Country Score Rank Country Score Rank Country Score
11 Slovakia 64.0 28 Romania 55.9 46 Czech Republic 50.4
16 Lithuania 61.4 29 Slovenia 55.6 53 Croatia 47.2
18 Hungary 60.7 39 Ukraine 53.3 55 Russia 45.1
22 Latvia 59.1 40 Estonia 53.0 56 Poland 45.1
27 Belarus 56.3 44 Bulgaria 51.1 59 Kazakhstan 38.1
© Germanwatch 2011
18CLIMATE CHANGE
index
PERFORMANCE
Table 9: Climate Change Performance Index for Newly Industrialised Countries
Rank Country Score Rank Country Score Rank Country Score
7 Brazil 66.9 25 Morocco 57.9 49 Malaysia 49.2
10 Mexico 64.6 26 Indonesia 57.2 50 Chinese Taipei 49.0
21 Egypt 59.1 33 Algeria 54.4 51 Singapore 48.9
23 India 58.6 38 South Africa 53.6 57 China 44.6
24 Thailand 58.4 45 Argentina 50.8 58 Turkey 41.7
© Germanwatch 2011
Table 10: Climate Change Performance Index for ASEAN Member Countries plus India, China,
Japan and Korean Republic
Rank Country Score Rank Country Score Rank Country Score
23 India 58.6 41 Korea, Rep. 52.3 50 Chinese Taipei 49.0
24 Thailand 58.4 43 Japan 51.1 51 Singapore 48.9
26 Indonesia 57.2 49 Malaysia 49.2 57 China 44.6
© Germanwatch 2011
7. Sources and further reading recommendations
• BP (2011):Statistical Review of World Energy, www.bp.com/statisticalreview
• “The Climate Change Performance Index: Background and Methodology”
www.germanwatch.org/klima/ccpi-meth.pdf
• IEA (2011a): CO2 Emissions from Fuel Combustion. Paris.
• IEA (2011b): Renewables Information. Paris.
• IPCC (1997): Revised 1996 IPCC Guidelines for National Greenhouse Gas Inventories.
www.ipcc-nggip.iges.or.jp/public/gl/invs1.html
• PWC(2011): Counting the cost of carbon: Low carbon economy index 2011
www.pwc.com/gx/en/low-carbon-economy-index
• Höhne; Phylipsen; Ullrich; Blok (2005): Options for the second commitment period of the Kyoto Protocol.
Climate Change. Nr. 02/2005. Umweltbundesamt. www.umweltdaten.de/publikationen/fpdfl/2847.pdf
• Meinshausen (2005): On the risk of Overshooting 2 �. Paper presented at Scientific Symposium “Avoiding
Dangerous Climate Change”, MetOffice, Exeter, 1-3 February 2005. www.pikpotsdam.de/~mmalte/sim-
cap/publications/meinshausenm_risk_of_overshooting_final_webversion.pdf
• Freudenberg (2003): Composite Indicators of Country Performance: A Critical Assessment.
STI Working Paper 2003/16. Paris.
• Meinshausen, M. et al. (2009). Greenhouse-gas emission targets for limiting global warming to 2°.
Nature 458(7242): 1158.
• WBGU (2003): Climate Protection Strategies for the 21st Century. Kyoto and Beyond. Special Report.
Berlin. www.wbgu.de/wbgu_sn2003_engl.html
19Germanwatch
Following the motto “Observing, Analysing, Act- Germanwatch is funded by membership fees, dona-
ing”, Germanwatch has been actively promoting tions, grants from the “Stiftung Zukunftsfähigkeit”
global equity and the preservation of livelihoods (Foundation for Sustainability), and by grants from
since 1991. In doing so, we focus on the politics a number of other public and private donors.
and economics of the North with their world-
wide consequences. The situation of marginalised You can also help to achieve the goals of German-
people in the South is the starting point of our work. watch and become a member or support our work
Together with our members and supporters as well with your donation:
as with other actors in civil society, we intend to
represent a strong lobby for sustainable develop- Bank fuer Sozialwirtschaft AG
ment. We endeavour to approach our aims by ad- BIC/Swift: BFSWDE33BER
vocating fair trade relations, responsible financial IBAN: DE33 1002 0500 0003 212300
markets, compliance with human rights, and the
prevention of dangerous climate change.
CAN Europe
Climate Action Network Europe (CAN-E) is recog- The vision of CAN is a world striving actively towards
nised as Europe‘s leading network working on cli- and achieving the protection of the global climate
mate and energy issues. With over 100 members in a manner that promotes equity and social justice
in 25 european countries, CAN-E unites to work to between peoples, sustainable development of all
prevent dangerous climate change and promote communities, and protection of the global environ-
sustainable energy and environment policy in ment. CAN unites to work towards this vision.
Europe.
CAN‘s mission is to support and empower civil
The Climate Action Network (CAN) is a worldwide society organisations to influence the design and
network of over 365 Non-Governmental Organi development of an effective global strategy to
zations (NGOs) working to promote government, reduce greenhouse gas emissions and ensure its
private sector and individual action to limit human- implementation at international, national and local
induced climate change to ecologically sustainable levels in the promotion of equity and sustainable
levels. development.You can also read