The Behavioural Insights Team - Update Report 2015-16
←
→
Page content transcription
If your browser does not render page correctly, please read the page content below

The Behavioural Insights Team
Update Report 2015-16
Update Report 2015-16

2            © Behavioural Insights Ltd. Not to be reproduced without the permission of the Behavioural Insights Team
Update Report 2015-16

Contents

 Forewords                                                                                                              4
 Rt. Hon. Ben Gummer, Minister for the Cabinet Office
 Sir Jeremy Heywood, Cabinet Secretary and Head of the Civil Service

 Executive Summary                                                                                                       6

   1. Health and Wellbeing                                                                                              11

   2. Education and Skills                                                                                              19

   3. Home Affairs                                                                                                      29

   4. Energy, Sustainability and Consumers                                                                              38

   5. Growth, Employment and Productivity                                                                               45

   6. Giving and Social Action                                                                                          50

   7. Reducing Fraud, Error and Debt                                                                                    55

   8. Manchester, Local and Devolved Authorities                                                                        59

   9. International Programmes                                                                                          67

   10. Australia                                                                                                        74

   11. North America                                                                                                    81

   12. Singapore                                                                                                        89

 Conclusion                                                                                                             94

 Endnotes                                                                                                               96

             © Behavioural Insights Ltd. Not to be reproduced without the permission of the Behavioural Insights Team        3
Update Report 2015-16

Foreword

                               To govern is to serve: we build the foundations – security, a
                               legal system, education, infrastructure, health services, social
                               protection – on which people build their lives. Traditionally, that
                               relationship is mediated through legislation, legislation devised
                               according to an educated guess at how people will respond. Too
                               often that guess is wrong: we have to return to problems we
                               thought had been solved or to correct perverse outcomes that
Rt. Hon. Ben Gummer,
                               were not anticipated at the beginning. Perhaps most importantly,
Minister for the               opportunities were missed to achieve a policy end without the
Cabinet Office
                               need for writing new law.
Herein lies the strength of the Behavioural Insights Team (BIT). By employing behavioural
evidence and empirically-based research, BIT can help ensure that where possible
we deliver policy aims by working with the way that people live their lives, rather than
interposing – often to little effect – with the crude armoury of the legislating state; and
where legislation is necessary, BIT can help ensure that it is designed correctly so that is
has the greatest chance of achieving its desired ends.
If you want proof of BIT’s success, look no further than the fact that even though it
was only established in 2010, it is now a central part of how government goes about its
business. So successful is it that its services are now purchased by other governments and
organisations around the world. That work, both in the UK and abroad, has grown even in
the last year – in complexity, scale and importance – as this report amply reflects.
We can be very proud that the Behavioural Insights Team is a creation of this government,
this Civil Service and this country. It has grown to become a recognised world-leader in
helping governments better help the people we are elected to serve. This report illustrates
that remarkable journey and points to the still more considerable achievements that lie
ahead.

Ben Gummer

4             © Behavioural Insights Ltd. Not to be reproduced without the permission of the Behavioural Insights Team
Update Report 2015-16

Foreword

                                 In September last year I spoke at the Behavioural Exchange
                                 conference hosted by the Behavioural Insights Team (BIT). There
                                 were 90 speakers, including Daniel Kahneman, Richard Thaler
                                 and Steven Pinker; and 900 delegates representing more than 30
                                 different countries, including 200 people from UK government
                                 departments.
                                 In my remarks, I explained how and why the UK has embraced
Sir Jeremy Heywood,              the use of behavioural science. A number of the world-leading
Cabinet Secretary
and Head of the Civil
                                 academics in attendance mentioned that, while many of the
Service                          academic findings from the behavioural science field originate from
                                 US research, the UK Government was now considered to be the
                                 global leader in application of the field.
When you read this report you will see why. It shows how almost every government
department is now using behavioural science to help improve the way that public services
are run or policies are delivered. It also shows how the scale and level of ambition
have risen over the years – something that I have seen first hand as the chair of the
Commissioning Board that sets BIT’s priorities for its UK government work.
This report shows how the early work that BIT started with HMRC to reduce fraud, error
and debt has been just as effective in countries around the world. In Costa Rica, it’s
helping to treble tax declarations rates. Similar interventions in Poland helped increase
payments by 17 per cent. The thinking behind these interventions is now underpinning the
Foreign Office’s strategy towards tackling corruption around the world.
Similarly, this report shows how behavioural insights can be used in targeted areas, from
encouraging doctors to reduce the number of antibiotics they prescribe, to encouraging
young learners to persist with their studies. But it also illustrates how behavioural insights
can be used to inform system design, such as reshaping markets to work better for
vulnerable consumers, or refashioning government procurement platforms to make them
more ‘intuitive’ to use, saving money in the process.
Chairing the BIT’s Commissioning Board and learning about some of these low or no
cost, high-impact, policy interventions, remains one of my most interesting, and often
enjoyable, responsibilities as Cabinet Secretary. BIT has brought a fresh and empirical lens
to thinking about the challenges we face. It also illustrates a wider point: that governments
and public services must – and can – be innovative, creative, and person-centred, yet also
pragmatic, fleet-of-foot, and literally experimental, testing and learning all the time. I’m
proud that the UK Civil Service has produced such an institution, and delighted to see its
work being taken up across the public sector and the world.

Jeremy Heywood

                © Behavioural Insights Ltd. Not to be reproduced without the permission of the Behavioural Insights Team   5
Update Report 2015-16

Executive Summary

                                                                   Introduction
                                                                   The Behavioural Insights Team (BIT) exists
                                                                   to achieve social impact by introducing a
                                                                   more realistic model of human behaviour
                                                                   to policy making. This report summarises
                                                                   the range and impact of BIT’s work over
                                                                   the past 12 months. In addition to the
David Halpern, Chief          Owain Service,
Executive of BIT and          Managing Director
                                                                   projects we have undertaken with the UK
National Advisor on           of BIT                               government, the report provides summaries
‘What Works’                                                       of work conducted by our offices in Sydney,
                                                                   New York, and Singapore.

Health and Wellbeing
Over the past year, BIT’s health work has grown in ambition and impact. This report
sets out the results from several large scale trials, including our work on antimicrobial
resistance. This showed that informing doctors that they are prescribing more antibiotics
relative to 80 per cent of their medical peers, reduces the number of unnecessary
prescriptions by 3.3 per cent (more than 73,000 prescriptions) – helping to address what
the Chief Medical Officer has identified as perhaps the greatest medical threat of our age.
We present the findings from our Counting Calories paper, which fundamentally re-
examines the way that official statistics measure calorie consumption, itself part of our
wider programme of work with Public Health England and others to make it easier for
citizens to live healthier lives. And we explain the new ways in which BIT has applied
behavioural insights to healthcare systems - for example through our innovative work on
procurement.

Education and Skills
BIT has now run a variety of interventions in educational settings. In this report we set out
findings from some of the largest trials ever run in Further Education (FE) Colleges. The
two year ‘Alert’ trial showed that regular text messages designed to encourage learners
to keep going increased pass rates by 12 per cent. A trial that sought to improve learners’
‘grit’ via a set of online modules increased attendance rates by nearly 10 per cent. And the
‘Study Support’ trial, in which learners nominate two people to help them, increased FE
College attendance by 11 per cent.
We also explain the work BIT is undertaking on apprenticeship policy, and the research we
have undertaken on young people’s study and career options. Alongside this policy work
we set out new findings from trials with employers. In one trial we sent CVs containing
different qualifications to job advertisements. We then measured which were most likely
to get a response. Including Functional Skills increases responses by more than 50 per
cent; while including GCSEs more than doubles responses.

6               © Behavioural Insights Ltd. Not to be reproduced without the permission of the Behavioural Insights Team
Update Report 2015-16

Home Affairs
The report covers new findings from our work with the Home Office, police and local
authorities in relation to crime and policing. This includes the latest version of the Mobile
Phone Theft Index, whose aim is to inform consumers and to encourage manufacturers’
efforts to improve security. This year’s Index shows that the HTC M8 phone is now the
most targeted phone in London, closely followed by the Samsung Galaxy S6 Edge.
We also present the results from our analysis of inappropriate calls received by the police.
One of the most intriguing findings from the analysis is that even a very slight pause in
answering leads to a dramatic reduction in the proportion of inappropriate calls. For
example, after a 3 second pause, the number of inappropriate calls is cut by a half; and
after 6 seconds they are reduced by almost 90 per cent. Analysis like this could help
police to respond more rapidly to citizens who most need assistance.

Energy, Sustainability and Consumers
Our work on consumers, energy and sustainability has continued to have a strong focus
on helping people to save energy (and money). The first stage of our evaluations of
Nest ‘smart thermostats’ have shown very promising early results, and the Department
of Business, Energy and Industrial Strategy (BEIS) has launched a new programme of
evaluations to test alternatives to in-home displays in smart meters.
Meanwhile, we have published a new report (with Citizens Advice) on what behavioural
science might add to our understanding of how to regulate consumer markets. The report
argues that regulators should be designing remedies with ‘behavioural market failures’ at
the forefront of their thinking. Such behaviourally-based remedies can greatly improve
market functioning: lowering costs, improving quality, and particularly, protecting more
vulnerable consumers.

Productivity and Growth
We have a long running programme of work on productivity and growth. Many of these
initiatives need time for their results to emerge. In this year’s report we are sharing the
details of several new projects that we think will be of widespread interest, including some
of the first trials aimed at addressing the role of ‘animal spirits’ in the economy – swings
between over-optimism and excessive pessimism by business and consumers, that can
lead to bubbles on the one hand, or ‘irrationally’ choke off growth on the other.
We also detail the work that we have done in relation to reducing implicit bias in
recruitment practices. This includes the new online platform that we have built – Applied
– which enables organisations to use these insights to reduce bias, and increase predictive
accuracy in recruitment.

             © Behavioural Insights Ltd. Not to be reproduced without the permission of the Behavioural Insights Team   7
Update Report 2015-16 Giving and Social Action We have many new findings relating to giving and social action. This includes a series of trials on Youth Social Action Fund interventions, which show that such programmes help to improve participants’ skills for work and life compared with those who do not attend the programmes. We set out results from work with the National Citizen Service (NCS) that tested the most effective ways of encouraging young people to sign up to the programme. The preliminary findings show that introductory videos showcasing the activities of NCS alumni increase expressions of interest in participation in the programme by 32 per cent. Reducing Fraud, Error and Debt In this year’s report, we are including several results from new work with HMRC. The first group of trials demonstrates the impact of different letters helping to prevent people incurring tax debts and fines by prompting individuals before the payment deadline. SMS messages that gave feedback to those who had been late before increased subsequent payment rates by nearly 50 per cent. We also present results from a set of trials that seek to change the behaviour of corporations that fail to pay their tax on time. These show that simple changes in communications can help and encourage them to pay what they owed. For example, a trial showed that a letter with a more educational content (containing helpful tips to make payment easier) increased payments by 15 per cent. Manchester, Local and Devolved Government In May 2016, BIT opened a new office in Manchester. The office will work directly with the Greater Manchester Combined Authority (GMCA), which will act as BIT’s new hub in the North of England. The initial work is likely to focus on improving the efficiency of services; and over time it will focus on more complex interventions in areas like health and social care. Alongside this work in Manchester, we have conducted numerous trials with local authorities across England and Wales, on areas including Council Tax payment, social care charges and voter registration. A Council Tax trial in Medway showed that the use of social norms in letters increased payments by 11 per cent (and would lead to £2 million being brought forward if rolled out). Changes to social care statement letters in Surrey increased payments amongst those who had just started receiving adult social care by 32 per cent. 8 © Behavioural Insights Ltd. Not to be reproduced without the permission of the Behavioural Insights Team
Update Report 2015-16
International Programmes
Over the past year, we have expanded the number, range and ambition of overseas
programmes that we support from the UK. Our tax compliance work has shown impressive
results in Costa Rica and Poland. In Costa Rica, for example, behavioural reminders nearly
tripled the rates of declarations. The new letters in Poland increased payments by 17 per
cent, which would have brought forward $1.1 million of additional tax revenue if they had
been sent to all taxpayers. The work with tax authorities is now being expanded through a
new programme with the Global Innovation Fund.
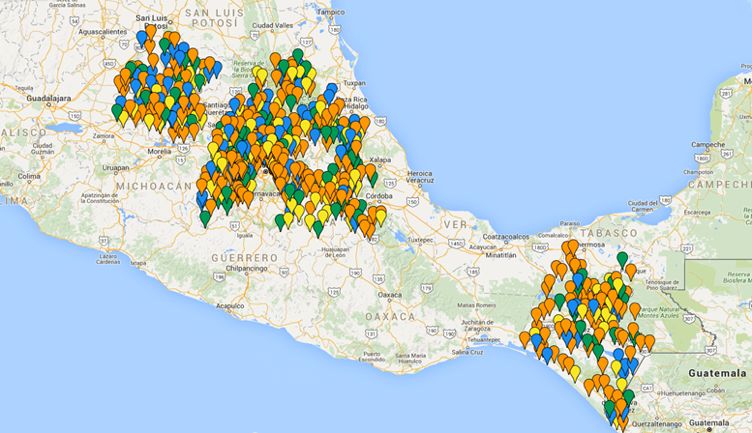
We have begun projects that are tackling more entrenched behaviours – such as maternal
health in Mexico, medical adherence in Moldova, and a new programme of work on anti-
corruption in the wake of the Prime Minister’s summit in May 2016.
Australia
One of BIT’s longest and most impactful global partnerships is with the Government of
New South Wales (NSW). BIT helped the Department for Premier and Cabinet (DPC) to
create their own dedicated Behavioural Insights Unit (BIU) from 2012. BIT continues to
support the New South Wales team, whose work was recognised internationally when it
was awarded the ‘Global Practitioners Award’ at last September’s Behavioural Exchange
conference.
Alongside findings from the partnership with New South Wales Department of Premier
and Cabinet, we report on trials BIT has conducted with other partners, including
VicHealth and Movember. One trial, using FitBit activity trackers, showed that giving more
personalised feedback significantly increases levels of activity. And that this effect was
most pronounced for the least active, who took 2,646 steps when given personalised
feedback, but only 1,800 when given more generic feedback.
North America
In September 2015, BIT set-up a new office in New York. The first six months of activity
have focused exclusively on supporting the Bloomberg Philanthropies ‘What Works
Cities’ initiative. In this report, we set out the results from lots of the early trials across
six US cities, all of which involve small changes to policies and processes that have had a
disproportionate impact.
In Denver, postcard prompts helped increase by 8 per cent the number of people
renewing their license plates online. In Chattanooga, behaviourally informed courtesy
letters helped increase by 13 per cent the number of people paying their bills (and thereby
avoid follow-up action). And in New Orleans, text message prompts helped encourage
hundreds of people to book free doctors appointments.
© Behavioural Insights Ltd. Not to be reproduced without the permission of the Behavioural Insights Team 9Update Report 2015-16 Singapore In July 2016, BIT established a new office in Singapore. This builds on the programmes we have been running since 2012 with the Ministry of Manpower, and more recently with the Public Services Division of the Prime Minister’s Office. The new office will enable BIT to provide more on-the-ground support to the Singaporean Civil Service. Our findings from trials run over the past year show that simplifying and pre-committing individuals to appointments for retirement savings advice more than doubled attendance rates. Conclusion It has been another exciting year for the field of behavioural insights, which is now becoming more mainstream across the UK Civil Service and increasingly, amongst governments around the world. Not only are we now seeing behavioural insights being applied in more areas, but we are also seeing the development of more complex interventions and evaluations. This report illustrates these changes. But it also offers insights into where we might go next, to help have even greater social impact over the coming months and years. Finally, we include in the report interventions that did not work too: where the effect of the intervention was no better than the control group. It is as important to know what does not work, as well as what does. Understandably, governments – and even academics – often worry about publishing ‘null results’. But we believe it is much better to establish that an intervention or change does not work on a small scale, rather than blindly leap to implementation on a larger or national scale. We hope that the lead that BIT has taken on this practice will help to make it easier for others to do the same. 10 © Behavioural Insights Ltd. Not to be reproduced without the permission of the Behavioural Insights Team
Update Report 2015-16

1. Health and Wellbeing

                                  Many of the most significant drivers of health are behavioural,
                                  but most health research spending continues to be focused on
                                  clinical cures (rather than preventing the behaviours that cause
                                  ill health). We believe that better health outcomes and increased
                                  efficiency can be achieved by applying behavioural insights to
                                  health policy, the stewardship of public health, and the delivery
                                  of healthcare.
Michael Hallsworth,     In 2015-16 BIT’s health work expanded into many of these areas,
Director, Health and Tax
                        and on a much larger scale. Our research on obesity has begun
                        to change the way that national statistics are collected. We’ve
published cutting edge research on reducing prescriptions of antibiotics and we’ve started
large projects looking at how millions of pounds might be saved through changing the way
that the NHS sets up its procurement systems.
All of these projects have been carried out in partnership with other organisations
– including the Department of Health (DofH), Public Health England (PHE), East Kent
Hospitals University NHS Foundation Trust, the Health Foundation, and VicHealth. We
would like to thank them for their support.

Measuring calorie consumption
BIT recently published a report, Counting Calories,1 which re-examines the way that official
statistics measure calorie consumption. We produced this work in response to recent
reports which noted that official statistics show a large decline in calorie consumption
during the same period that obesity rates have gone up. This led some commentators to
claim that declining physical activity must be the driver of obesity, rather than increased
calorie consumption.2
Our report concluded that national surveys are underestimating our true calorie intake.
We know this because reported calorie consumption is too low to sustain our current
weight, even if we were only doing the minimum possible level of exercise. More accurate
methods of measurement show a much higher calorie intake (see Figure 1.1).

                 © Behavioural Insights Ltd. Not to be reproduced without the permission of the Behavioural Insights Team   11
Update Report 2015-16
Figure 1.1: Reported calorie intake versus estimated true calorie intake for adults
3,000
2,882
Avergage calorie consumption per
2,500
person, per day, 2011/13 (kcal)
2,446
2,000 2,192
1,916
1,500
1,000
500
0
Reported energy Reported total Minimum average Energy expenditure
intake (National purchases of consumption to shown by National
Diet and Nutrition calories (Living sustain current Diet and Nutrition
Survey data) Costs and Food weight Survey Doubly
Survey data) Labelled Water study
We also presented evidence that we have been increasingly under-reporting our calorie
intake over time. The scale of this reporting is so large that it could explain the apparent
fall in calorie intake. Our conclusion was supported by looking at another data source,
showing that surveys of economic activity have increasingly failed to capture true levels
of purchases. When we adjusted the reported calorie figures to take this change into
account, it showed that calorie consumption has been increasing since the 1990s (see
Figure 1.2).
Finally, our report addressed the argument that a fall in physical activity has been the main
driver of obesity. This is not a plausible explanation: the reduction is equivalent to every
single adult in England jogging for around an hour less a day, every day, than they were in
the 1970s (or half an hour less than in 1993). We also showed that falling levels of activity in
the workplace do not provide the answer.
12 © Behavioural Insights Ltd. Not to be reproduced without the permission of the Behavioural Insights TeamUpdate Report 2015-16
Figure 1.2: Calories consumed in the home (Living Costs & Food Survey), corrected and
uncorrected for under-reporting
2,900
2,700
Daily consumption (kcal)
2,500
2,300
2,100
1,900
1,700
1,500
1974
1975
1976
1977
1978
1979
1980
1981
1982
1983
1984
1985
1986
1987
1988
1989
1990
1991
1992
1993
1994
1995
1996
1997
1998
1999
2000
2001
2002
2003
2004
2005
2006
2007
2008
Corrected for under-reporting Reported
The report has major policy and data collection implications. On policy, the implication is
clear: we should continue to focus on reducing calorie intake and not assume that physical
activity alone is the solution to obesity. On data collection, we need to develop new
methods for compiling statistics that take into account our growing tendency to misreport
consumption. The Government Statistical Service is establishing a cross-departmental
team to address the issues raised in our report.
Reducing antibiotic prescribing
The growth of antimicrobial resistance (AMR) is one of the major health challenges of our
time. The UK’s Review on Antimicrobial Resistance has forecast that AMR will result in 10
million deaths and $100 trillion in unachieved GDP a year by 2050.3
PHE, BIT and England’s Chief Medical Officer (CMO) ran a randomised trial to test whether
General Practitioners (GPs) reduce their prescription rates when they are informed that
they are prescribing antibiotics at a relatively high rate, compared with their peers. The
intervention was simple and cheap, and was published in a recent edition of The Lancet.4
We sent 800 of the 1,600 GP practices a letter from the CMO stating ‘the great majority
(80 per cent) of practices in [the recipient’s local area] prescribe fewer antibiotics per
head than yours’. The letter also contained three simple, actionable alternatives to
immediate prescriptions (such as delayed prescriptions in which the patient picks up the
prescription at a later date if it is still needed).
Over six months, those who received the letter reduced their antibiotic prescribing rates
by 3.3 per cent compared with those who did not. This led to 73,406 fewer antibiotic
prescriptions. To put this result into perspective, we calculated that if the letter had been
sent to all eligible practices (as it was at the end of the trial), England’s overall antibiotic
prescribing rate would have fallen by 0.85 per cent. The current Five Year UK strategy has
a target to reduce antibiotic prescribing by 4 per cent.
© Behavioural Insights Ltd. Not to be reproduced without the permission of the Behavioural Insights Team 13Update Report 2015-16
Figure 1.3: GP antibiotic prescribing rates during the study period (2014-15)
160
Antibiotic items dispensed per
1,000 weighted population
150
140
130
120
110
September October November December January February March
(preintervention)
Control Treatment
N=1,581 GP practices
The NHS is exploring how this feedback could be incorporated into standard business
procedures. BIT itself will be working with Oxford University’s openprescribing.net website
to test the most effective ways of presenting prescribing feedback. This kind of feedback
could be used in other areas where there is high variation in clinical practice.
Accident and Emergency re-attendance
There is currently high demand for A&E services, putting pressure on NHS trusts and staff.
NHS England’s Urgent and Emergency Care Report 5 states that 40 per cent of patients
attending A&E are discharged requiring no treatment at all. A National Audit Office report6
notes that approximately 20 per cent of admissions are for conditions that could be
managed effectively by primary, community or social care services.
We have been working on two projects related to re-attendances at A&E. The first is a
smaller trial, focused on A&E attendance in general. Here, BIT worked with East Kent
Hospitals University NHS Foundation Trust and focused on one particular behavioural
factor: lack of feedback to users who make avoidable visits. We tested a simple way
of providing this feedback: the hospital sent a personal letter to people who recently
attended A&E, but whose health concerns could have been dealt with elsewhere. The
letter gave alternative care options in the local area that would allow people to be seen
more quickly and was accompanied by a reminder card for easy reference.
Letters were sent out between January and September 2015 and follow-up data on
attendance was collected until the end of February 2016. The letters did not result in a
statistically significant difference in attendance rates (see Figure 1.4). This is one of the
first pieces of rigorous evidence on how feedback (and information in general) affects A&E
attendance behaviour.
14 © Behavioural Insights Ltd. Not to be reproduced without the permission of the Behavioural Insights TeamUpdate Report 2015-16
Figure 1.4: Effect of letter on re-attendance rates
8
6
Percentage
5.2
4 5.3
2
0
No letter Letter
N=10,889
** pUpdate Report 2015-16
With support from the Health Foundation, BIT is running a set of trials with King’s College
London that test the best ways of framing choices to reduce waste and improve efficiency.
The trials are likely to include: using design features or prompts, social norm messages,
informing purchasers of which products other people selected, the provision of cost and
savings feedback, and the impact of providing product quality ratings. Alongside these
trials we will assess the overall impact of introducing the new system in order to inform
a possible wider roll-out of throughout the NHS. We will report on the progress of this
project in next year’s Update Report.
Sugar-sweetened beverages in hospitals
Working in partnership with Alfred Health and VicHealth, BIT Australia conducted a trial
to test whether patients and staff could be encouraged to choose healthier alternatives
to sugar-sweetened beverages. Specifically, the trial looked at what the impact of a price
increase on sugar-sweetened drinks would be.
We tested the impact of this increase by randomly allocating half of the vending machines
in Alfred Health’s hospitals to having a price difference. In these machines, all high calorie
‘red’ drinks, including fruit juices, were subject to a 20 per cent price increase. The prices
in the other machines were kept exactly the same. This trial ran for six months between
August 2015 and January 2016. The aim of the trial was to move people away from the ‘red’
drinks and towards lower calorie ‘amber’ drinks, which included all diet and sugar-free
alternatives, and ‘green’ drinks, which were water.
We found that there was a significant reduction in the number of ‘red’ drinks being sold.
In standard pricing, 49.1 per cent of the drinks sold were high calorie ‘red’ drinks, but in
machines with the 20 per cent price increase, only 44.1 per cent of the drinks sold were
‘red’ (see Figure 1.5 below).
Figure 1.5: Effect of labelling and price reduction on beverage sales
60
Percentage of ‘red’ products sold
49.1 **
40
44.1
20
0
Control Treatment
N=235,979
** pUpdate Report 2015-16
We also investigated whether there was a significant impact on the total sales of drinks.
We did not find a statistically significant difference in the total number of sales between
the treatment and the control group. Interestingly, we did find that fewer litres of drinks
overall were being consumed. This seemed to be driven by the fact that the 20 per cent
price differential also had an effect on the size of drinks that were being purchased.
Among the ‘red’ drinks, we found a significant decrease in sales for the larger products
(costing more than $4) but a small increase in the sales for smaller products (which cost
less than $4).
This trial was one of the many that BIT Australia conducted with VicHealth, the full details
of which are set out in David Halpern’s final report: Behavioural Insights and Healthier
Lives.8
Diabetes prevention
Type 2 diabetes is a growing problem in the UK and worldwide, and treatment costs of
£8.8 billion a year account for just under 9 per cent of the annual NHS budget.9 There
are currently 5 million people in England at high risk of developing Type 2 diabetes - but
positive changes to lifestyle, including improved diet and greater levels of physical activity
can help to prevent this happening.
Increasing physical activity is recommended by The National Institute for Health and Care
Excellence (NICE) to prevent Type 2 diabetes in people at high risk.10 As a result, many
local authorities provide free physical activity courses for people at risk. We wanted to
see whether the impact of these programmes could be improved by enhancing them with
motivational SMS messages (which would also be cheap to implement).
This project was carried out for PHE and was implemented in partnership with Southwark
Council, Refer-all Ltd and Fitbug Ltd. It aimed to improve the outcomes and engagement
of individuals attending the Walking Away From Diabetes programme delivered by
Southwark’s Hub Team. This programme seeks to reduce the risk of pre-diabetic
individuals via a 12 week programme of increased physical activity and improved eating
habits. Participants were given pedometers and asked to track their step activity, which
meant that we could easily measure the effects of the trial.
We trialled the presence of motivational and social comparison feedback messages,
whereby half of the participants received the messages and half did not. Participants
were encouraged to upload their step counts and the automated SMS message service
delivered different messages depending on how individuals were performing. Our outcome
measure was a reduction in a widely used clinical measure for risk of diabetes, namely the
HbA1c score (a measure of blood glucose levels).
We found no statistically significant improvement as a result of the text messages.
However, the trial did allow us to evaluate the general impact of the Walking Away from
Diabetes programme, which was found to significantly reduce an individual’s blood glucose
levels (see Figure 1.6), although the text messages had no additional effect. As we will see
in Chapter 10, however, other feedback mechanisms to encourage people to exercise
more have been shown to work in different contexts.
© Behavioural Insights Ltd. Not to be reproduced without the permission of the Behavioural Insights Team 17Update Report 2015-16
Figure 1.6: HbA1c readings before and after the Walking Away From Diabetes programme
50
**
40 43.6
42.4
HbA1c readings
30
20
10
0
Pre Post
N=245
** pUpdate Report 2015-16
2. Education and Skills
The last year has seen a huge growth in interest in the application
of behavioural science to education and skills policy in the UK and
in the rigorous use of evaluations to test and trial ‘what works’ in
educational settings. Much of the credit for this change has to go
to the Education Endowment Foundation (EEF), which more than
any other organisation has helped to show how it is possible to run
large scale evaluations in school settings.
Zhi Soon, Director, BIT has also been at the forefront of this agenda, not least through
Productivity
the dedicated Behavioural Research Centre for Adult Skills and
Knowledge (ASK) that we set up with backing from the Department
for Business, Innovation and Skills in September 2014. Last year, we reported some of the
early findings from the small trials we had run through ASK in its first year. This year, we
can report on some of the biggest trials ever run in the sector.
We are also conducting a number of projects with the then-Department for Business,
Innovation and Skills, now Department for Education (DfE), on apprenticeship policy and
with the Careers and Enterprise Company (CEC) on how young people make their study
and career choices. This will ultimately result in behavioural science influencing policy in
these important areas in the future.
Adult Learner Engagement and Retention
One of the major reasons for creating ASK was to enhance our understanding of
interventions that might help adults to become more literate and numerate.
In our previous Update Report, we gave interim results for a trial that aimed to improve
attendance rates at adult numeracy and literacy classes by sending learners weekly text
messages. We called this ALERT (the Adult Learner Engagement and Retention Trial). These
messages were designed to encourage learners to keep going even if they were struggling
with the material and to create a sense of social belonging in their college. The interim
results showed that after three weeks these weekly messages increased attendance
compared to the control group.
We now have the final results of the trial, which are shown in Figure 2.1. They show that
the improvement in attendance, compared with the control group, persisted all the way
through to the end of the year. More importantly, they show that learners who received
our text messages were also 12 per cent more likely to pass all of their exams.
© Behavioural Insights Ltd. Not to be reproduced without the permission of the Behavioural Insights Team 19Update Report 2015-16
Figure 2.1: Effect of encouraging weekly text messages on exam performance and
attendance
80
*
60
64.4
57.4
Percentage
*
40
41.3
34.0
20
0
Attendance Passed all exams
Control Treatment
N~2,000
** pUpdate Report 2015-16
The second intervention was an online Values Affirmation (VA) exercise, which we
developed with Professor Geoffrey Cohen and his team at Stanford. The intervention
involved, amongst other things, an exercise in which students were encouraged to think
about what is most important to them in their lives, and then to write about times when
these values were particularly important to them and why.
There is substantial research, including that conducted by BIT, which has shown that
exercises of this kind are effective at helping people to overcome ‘stereotype threat’, a
situation where people are or feel themselves to be at risk of conforming to stereotypes
about their group. ‘Stereotype threat’ can create a self-fulfilling prophecy where
underperformance confirms the stereotype. Our extensive qualitative work in FE colleges
combined with the existing behavioural science literature has led us to believe that some
FE college students might be experiencing ‘stereotype threat’, particularly those who
had previously struggled to attain maths and English qualifications. The intervention was
designed to improve attainment and also learners’ attendance.
The chart (Figure 2.2) below shows the effect of the VA intervention on mid-year
attendance rates for all learners and then separately for learners retaking their GCSEs and
for learners taking Functional Skills courses. Functional Skills courses tend to be taken
by learners whose priority is to develop their numeracy and literacy skills for work and
everyday life rather than further academic study.
Looking at all learners together, the VA intervention did not lead to a statistically
significant improvement in attendance rates overall. However, further analysis suggests
that the intervention appears to have been effective for learners taking Functional Skills
courses, improving attendance rates by as much as 20 per cent, but was ineffective for
those studying for GCSEs. This is a good example of how an intervention might appear
to be ineffective, but a deeper analysis suggests that it works for a specific group of
people – those studying the ‘less academic’ courses who otherwise tended to have lower
attendance rates (subject to confirmation in future trials).
Figure 2.2: Effect of the ‘grit’ and Values Affirmation interventions on mid-year
attendance for all learners, GCSE learners and Functional Skills learners
60
Percentage of classes attended
** **
47.8 47.3 49.7
40 43.6 45.6 45.1 46.6
43.9
38.7
20
0
All learners GCSE learners Functional Skills
learners
Control Values Affirmation Grit
N=8,986
** pUpdate Report 2015-16
The third intervention was run as a separate trial in partnership with Harvard Professor,
Todd Rogers. It sought to leverage the power of the students’ social networks and the
potential role of these networks in supporting educational outcomes. The student
nominated up to two individuals, such as a parent or friend, who received text messages
at moments of importance during the education of the student. Nominated ‘Study
Supporters’ were sent weekly texts throughout the academic year. These texts aimed to
prompt the text recipient to provide support, for example in the run up to a test.
The graph below shows that the texts resulted in an 11 per cent increase in attendance
(or an increase of 6 percentage points). This is a huge increase by any measure, and
particularly for a low cost intervention that is relatively easy to implement. Again, we will
wait to see what impact this has on academic performance later this year.
Figure 2.3: Effect of study support interventions on mid-year attendance
70
**
60
50 60.7
54.7
Percentage
40
30
20
10
0
Control Study Supporter
Total N=745
** pUpdate Report 2015-16
Box 2.1: Learning lessons from implementing complex interventions in the field
Alongside the quantitative work in said, “it was helpful because… I don’t think
the trials with FE Colleges, we also I would have got through the year without
undertook qualitative research to better having someone to support [me]…”
understand how the trials were working
The qualitative work also revealed some of
in practice and to learn lessons on the
the challenges in trial implementation. For
implementation of future interventions.
example, in order to maintain the rigour of
This included carrying out 25 in-depth
the trial, the tutors were not able to know
interviews with learners in relation to
of the content of each of the intervention
each of the three interventions to capture
groups. This proved to be a source of
their experiences and perceptions of the
frustration, which tutors felt made it harder
exercises and the challenges associated
for them to play as strong a role as they
with the implementation. Additionally,
would have liked in actively encouraging
we interviewed tutors who delivered the
learners to engage in the programme.
interventions in their classrooms.
BIT believes that, wherever possible, it is
These interviews, particularly with learners,
worth conducting qualitative work of this
were overwhelmingly positive. Learners
kind alongside a quantitative study, and
mentioned that the exercises had helped
using the results to add nuance and to
them express themselves, and had even
inform future work.
improved their relationships with their study
supporters. For example, one interviewee
Network nudges to raise awareness of workplace learning
Some large organisations offer in-house English and maths functional skills classes,
tailored to the working context. These classes are a great opportunity for employees to
improve their skills, but employers sometimes face challenges with take-up. We worked
with a large public transport network provider to raise awareness of the classes on offer.
We wanted to test the impact of peer networks on sign-ups, so we divided up learners
who had attended classes over the past three years and got in touch with learners to see
whether they would refer their friends. This idea takes forward the concept of ‘network
nudges’ that we reported on in last year’s Update Report in relation to charitable giving.
The first group simply received an email asking for feedback on their experience. The
second group were asked to reach out to their friends and colleagues. The third group
got an incentive: anyone who signed up to a class would go into a lottery to win shopping
vouchers worth £250 or £25. We had postulated that the incentive would motivate past
learners to notify their friends, and then those friends, to sign up to courses.
This third group had sign-up rates more than double those of the other two. At first glance,
there is a relatively simple explanation. Offering an incentive increases the number of
people who sign up. However, we think that something more interesting may be going
on. There is a chance that the lottery may help to destigmatise signing up for a course by
providing an alternative rationale for the learner (instead of admitting that their maths was
not up to scratch, learners could say it was because of the prize). That said, it is worth
noting that the sign-up rates overall were extremely low: even in the most successful arm,
only around one in 1,000 staff responded to a prompt from their colleague.
© Behavioural Insights Ltd. Not to be reproduced without the permission of the Behavioural Insights Team 23Update Report 2015-16
Figure 2.4: Sign-up rates by email received
0.12
**
0.10
0.11
0.08
Take-up (%)
0.06
0.04
0.02 0.03 0.04 0.04
0.00
Control Thanks Reach Prize
N=28,602
** pUpdate Report 2015-16
A pilot study with a single Army Education Centre (AEC) showed promising initial results. At
the end of the course, in most cases directly after they sat the exam, we administered a
survey which asked soldiers a range of questions about their satisfaction with the course.
As the graph below shows, soldiers that received the ‘purpose for learning’ intervention
were much more likely to say that they would have taken the course, even if it wasn’t a
requirement for promotion.
We will now be scaling up the trial to around 800 soldiers in 11 sites across four AEC
Groups, to see if there is a similar effect, not just on motivations, but on learning
outcomes too.
Figure 2.5: Percentage stating that they would take the course, even if not required for
promotion
110
Percentage agreeing with question
100
**
80
60 88.0
60.0
40
20
0
Control Affirmed
N=62
** pUpdate Report 2015-16
Perhaps unsurprisingly, we found that qualifications have a positive and significant effect
on responses to job applications. What is more surprising is the size of the effect. Having
GCSEs resulted in a doubling in responses, which is a much higher response rate than for
equivalent Functional Skills qualifications. This may be because employers are less familiar
with these latter qualifications.
Figure 2.6: Percentage response to job applications by qualification type
40
30
**
Percentage
20
**
24.2
10
12.0 17.5
0
Control Functional GCSE
N=1,142
** pUpdate Report 2015-16
Supporting the new Apprenticeships Policy
In June 2015, the UK Government gave renewed priority to apprenticeships. The
commitment was made to reach 3 million apprenticeships by 2020, and to put them
legally on a par with degrees. As a result of this new push, the DfE asked BIT to support it
in rolling out and communicating the new arrangements.
One of the main focuses of BIT’s work is to support DfE to incorporate a range of
behavioural insights into the key touch points for the new apprenticeship levy and the
digital apprenticeship service account. In addition, we are working with teams from the
Skills Funding Agency to drive greater employer engagement with apprenticeships. We
are also investigating how an ‘apprenticeship social contract’ might increase quality,
completion, and benefits for apprentices, employers and training providers.
Much of this work involves running large-scale field trials. Some of these trials will
test mechanisms to encourage the hiring of apprentices. This should provide DfE and
employers with ongoing feedback on what the best ways of increasing uptake might be, as
the Government progresses towards its 3 million apprenticeship target. As an organisation
that now meets the threshold for hiring apprentices, BIT may also soon have some first-
hand experience of the system.
Supporting young people’s study and career decisions
Young people face a difficult challenge as they navigate the increasingly complex pathways
from education to work. In many ways it is positive that they face a wealth of choices and
opportunities that earlier generations could not have imagined. However, this wealth of
choice brings its own challenges.
The CEC commissioned BIT, together with the Cabinet Office Policy Lab, to conduct
independent, theoretically and empirically grounded research on what kind of information
supports young people to make informed choices about their study and career options.
We attempted to track the young people in our sample through their career decision-
making journeys, and to understand at what point they sought information and about what.
We plotted this on two axes to develop a segmentation model (see Figure 2.7).
© Behavioural Insights Ltd. Not to be reproduced without the permission of the Behavioural Insights Team 27Update Report 2015-16
Figure 2.7: Segmentation model of young people’s career information seeking behaviour
Seeking
information
VALIDATING GATHERING
Actively searching for information, Actively searching for information
focused on validating a decision about current decision, future
already made. Searching sector decisions and links between
-specific websites, or on gaining them; seeking comparisons of
Considering a specific option
information on specific qualifications options (either within or across
Considering many options
(i.e. comparing institutions or information sources).
occupational qualifications).
FIXED SATISFICING
Not searching for information Information search behaviour is
because they feel they have passive: searching is extrinsically
sufficient information (correctly motivated (e.g. in careers classes) or
or otherwise). Decided a long time incidental (e.g. seen job portrayed
ago what decision they would make. on television, parents mention it).
Not looking beyond the specific
DISENGAGED
decision they are currently facing,
Disengaged from the decision and or have a general sense of
from support structures designed uncertainty beyond that point.
to assist with decision-making.
No idea what study, career or job
they might do in the future, and
no interest in investigating further.
Not seeking
information
The research showed that young people do not routinely seek out data and information
to inform their decisions. They are more likely to seek an image of a particular career that
they find appealing, which might come from a number of different sources, such as family,
friends or exposure in the media. When data or information was more actively sought, it
was often used to validate existing decisions rather than to explore new options.
The research suggests that we might need to rethink when and how information is
provided to young people, as well as what kind of information is provided. In light of this,
we developed a set of principles for what good information provision to young people
should look like. We are now working with the UK Government, CEC and a number of other
organisations to extend this research further, to test how these principles operate in
practice and to understand the implications for career advice practice in schools.
28 © Behavioural Insights Ltd. Not to be reproduced without the permission of the Behavioural Insights TeamUpdate Report 2015-16
3. Home Affairs
In last year’s Update Report, we pointed out that, historically,
there has been little tradition of conducting behavioural studies
in the policy areas of crime, immigration and national security.
There are good reasons for this: these are complex, sometimes
sensitive policy areas, and it can often take a long time to see
the effect of interventions.
At the same time, it should be recognised that most aspects of
Simon Ruda, Home Affairs policy are ultimately about human behaviour. And
Director, Home Affairs
and International
those studies that have been conducted, such as our work with
Programmes Avon and Somerset Constabulary on increasing diversity in police
recruitment, seem to show that – in some but by no means all
cases – relatively small changes can have big impacts.
So, with this in mind, we are delighted that, as a result of a few of our early studies and the
efforts of our partners in police forces, the Home Office and innovative organisations like
the Dawes Trust, a behavioural approach – including a commitment to testing and trialling
– is becoming more widespread in Home Affairs and related policy areas.
In this section, we report the launch of many new interventions, findings from recent
studies, and several trial results. This includes the latest findings from the Mobile Phone
Risk Index and analysis on police demand.
The Mobile Phone Risk Ratio
In March 2016, the Home Office and BIT jointly published the second edition of Reducing
Mobile Phone Theft and Improving Security,12 a paper which details the nature of mobile
phone theft across England and Wales, including how and when phones are stolen, and
who is most at risk.
A core part of this paper is a second edition of the Mobile Phone Risk Ratio. The ratio
was developed by BIT to show which phones are ‘over-stolen’ – in other words, the
extent to which a particular make and model of phone is stolen more than we would have
anticipated given its share of available phones. It is calculated based on our analysis of
data provided by the Metropolitan Police Service (MPS) on mobile phone thefts during
2015.
© Behavioural Insights Ltd. Not to be reproduced without the permission of the Behavioural Insights Team 29Update Report 2015-16
Figure 3.1: Mobile phone theft ratio based on model of phone
HTC M8
Samsung Galaxy S6 Edge
Apple iPhone 6 Plus
Apple iPhone 6
Apple iPhone 6S
Samsung Galaxy S6
Samsung Galaxy S6
Samsung Galaxy S5
Samsung Galaxy Note
Apple iPhone 5C
HTC One
Apple iPhone 5S
Nokia 635
Samsung Galaxy S4
Apple iPhone 5
Samsung Galaxy Mini
Desire
Samsung Galaxy
Apple iPhone 4S
Apple iPhone 4
Apple iPhone 3
-5 0 5 1 1.5
Theft ratio
Compared with the previous edition of the Ratio, there are a few notable changes. Most
strikingly, the HTC M8 appears to be the most targeted phone compared to its availability,
albeit a relatively uncommon phone, with only 328 thefts occurring in 2015.
The aim of the Ratio is to provide the public with transparent data that allows them to
make more informed consumer choices and to encourage manufacturers’ efforts to
improve security over time.
Police Demand Management
BIT was commissioned by Gwent Police, Dyfed-Powys Police and South Wales Police
through the Home Office Innovation Fund to investigate the nature and causes of calls to
the Police 101 number for non-emergency issues.
We analysed call volume data, provided by each of the police forces, to see if we could
uncover patterns relating to inappropriate calls. When conducting the analysis, as
‘inappropriate calls’ were not coded in the data, we assumed that any phone calls which
were resolved in under 30 seconds were likely to be inappropriate for the police (i.e. the
caller was quickly informed their enquiry was not something the police deal with).
Our analysis revealed a number of patterns. For example, we found that a large proportion
of inappropriate calls originated from repeat callers. For instance, for Dyfed-Powys Police,
25 per cent of all calls relating to Public Service and Welfare incidents were from numbers
that had called before.
30 © Behavioural Insights Ltd. Not to be reproduced without the permission of the Behavioural Insights TeamUpdate Report 2015-16
One of the most intriguing findings from the analysis was that even a very slight pause
in answering leads to a dramatic reduction in the proportion of inappropriate calls. For
example, inappropriate calls are roughly halved by a 3 second pause – or roughly a single
ring on the line. The proportion of inappropriate calls is reduced even more dramatically if
the caller waited for at least 6 seconds for the call to be answered. Around 40 per cent of
calls answered within 1 second were inappropriate, whereas only 10 per cent of those that
waited at least 6 seconds were. It would appear that just hearing the phone ring is enough
prompt many inappropriate callers to drop off the line, whereas serious callers are not put
off (understandably). One possible conclusion from this analysis is that there is an optimal
ring time, perhaps of 6 seconds, which could help reduce inappropriate calls and enable
police to respond more rapidly to citizens who most need assistance.
Figure 3.2: Estimated proportion of calls that are inappropriate, by number of seconds of
ring time
50
40
call is inappropriate (%)
Estimated likelihood
30
20
10
0
0 5 10 15 20
Ring time (seconds)
© Behavioural Insights Ltd. Not to be reproduced without the permission of the Behavioural Insights Team 31Update Report 2015-16
Behavioural trials with West Midlands Police
In 2015, we partnered with West Midlands Police, England’s second largest police force,
to deliver a series of trials in policing. West Midlands Police have a strong commitment
to innovative approaches to policing and understanding ‘what works’. We are grateful for
the efforts of our colleagues there, particularly, the support of Chief Superintendent Alex
Murray, Commander of Solihull Local Policing Unit and founder of the Society of Evidence
Based Policing.
With support from the Dawes Trust, a charity dedicated to supporting innovative ways to
reduce crime,13 we are now just over a year into an 18 month programme of work that aims
to assess the potential for rapid, practical, low-cost, behaviourally-informed interventions
to reduce crime and aid police work.
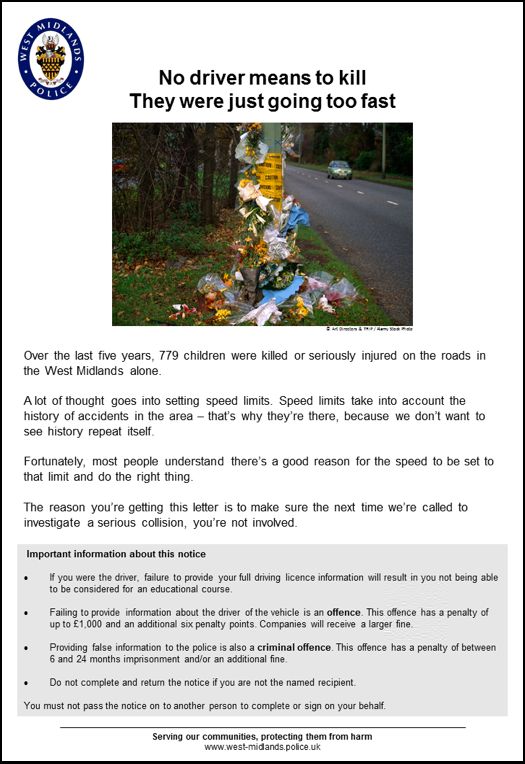
We are trialling a wide range of interventions with West Midlands Police. One of the most
innovative of these is a message written on cell walls in police custody suites (see Figure
3.3 below). The messages were written with the help of an ex-offender who wanted
to help others to turn their lives around as he has. They aim to reduce reoffending by
prompting detainees to identify the triggers and obstacles that might make them more
likely to reoffend in the future and encouraging them to consider steps they could take to
avoid those triggers.
Figure 3.3: A trial to test whether behaviourally-informed messages on cell walls reduces
reoffending amongst those who have been held in police custody
32 © Behavioural Insights Ltd. Not to be reproduced without the permission of the Behavioural Insights TeamYou can also read