The Application of Machine Learning Techniques for Predicting Match Results in Team Sport: A Review
←
→
Page content transcription
If your browser does not render page correctly, please read the page content below
Journal of Artificial Intelligence Research 73 (2022) 1285-1322           Submitted 11/2021; published 04/2022

       The Application of Machine Learning Techniques for
       Predicting Match Results in Team Sport: A Review

Rory Bunker                                                       rory.bunker@g.sp.m.is.nagoya-u.ac.jp
Graduate School of Informatics
Nagoya University
Furocho, Chikusa Ward
Nagoya, Aichi 464-8601, Japan
Teo Susnjak                                                                     t.susnjak@massey.ac.nz
School of Mathematical and Computational Sciences
Massey University
Massey University East Precinct Albany Expressway, SH17, Albany
Auckland 0632, New Zealand

                                                   Abstract
         Predicting the results of matches in sport is a challenging and interesting task. In
     this paper, we review a selection of studies from 1996 to 2019 that used machine learning
     for predicting match results in team sport. Considering both invasion sports and strik-
     ing/fielding sports, we discuss commonly applied machine learning algorithms, as well as
     common approaches related to data and evaluation. Our study considers accuracies that
     have been achieved across different sports, and explores whether evidence exists to support
     the notion that outcomes of some sports may be inherently more difficult to predict. We
     also uncover common themes of future research directions and propose recommendations
     for future researchers. Although there remains a lack of benchmark datasets (apart from
     in soccer), and the differences between sports, datasets and features makes between-study
     comparisons difficult, as we discuss, it is possible to evaluate accuracy performance in
     other ways. Artificial Neural Networks were commonly applied in early studies, however,
     our findings suggest that a range of models should instead be compared. Selecting and
     engineering an appropriate feature set appears to be more important than having a large
     number of instances. For feature selection, we see potential for greater inter-disciplinary
     collaboration between sport performance analysis, a sub-discipline of sport science, and
     machine learning.

1. Introduction
Sport result prediction is an interesting and challenging problem due to the inherently
unpredictable nature of sport, and the seemingly endless number of potential factors that
can affect results. Indeed, it is this unpredictable nature that is one of the main reasons
that people enjoy sport. Despite its difficulty, predicting the results of sports matches is of
significant interest to many different stakeholders, including bookmakers, bettors, and fans.
Interest in match result prediction has grown with the increased availability of sport-related
data online and with the emergence of online sports betting. Sport experts and former
players often make predictions on upcoming matches, which are commonly published in the
media.

©2022 AI Access Foundation. All rights reserved.
Bunker & Susnjak
The application of machine learning (ML) in sport has recently branched widely, and
research surveys exist on predicting sports injuries (Van Eetvelde et al., 2021), applying
predictive analytics to sport training (Rajšp & Fister, 2020), and using predictions for
determining optimal team formations (Ishi & Patil, 2021). Numerous studies also exist that
focus on in-play predictions, which predict the occurrence of specific events during a contest,
e.g., a goal being scored by a specific player. However, the focus of the present survey is
specifically on the application of ML in predicting the outcomes of matches in team sports.
The prediction of final match results is of interest not only to the likes of bookmakers and
bettors but also to players, team management and performance analysts in order to identify
the most important factors in achieving winning outcomes. One important task within
outcome prediction in sport is to select the best set of features for the predictive model.
If the model used is interpretable and incorporates some feature selection mechanisms or,
alternatively, a feature selection method is applied prior to applying the model, the most
important predictive features can be extracted. Although some features, e.g., the match
venue, officials, weather, etc., are external to the sport match, in-play features may identify
areas in which teams can adjust their tactics/strategy to improve performance. Sport
performance analysis, a sub-discipline of sport science, considers performance indicators
(PIs), which are a selection or combination of action variables that aim to define some or
all aspects of a performance, which, in order to to be useful, should relate to a successful
performance or outcome (Hughes & Bartlett, 2002). In this context, the match outcome is,
of course, one measure of performance. Therefore, important features (PIs) are useful for
players, team management and sport performance analysts to identify ways in which they
can improve their performance and achieve winning outcomes. As we will discuss further
below, in this domain we see potential for greater collaboration between sport performance
analysis researchers and machine learning researchers going forward.
In the academic literature, match result prediction in sport has been considered by the
statistics and operations research communities for some time; however, the application of
ML techniques for this purpose is more recent. The first study in this domain appears to
have been published in 1996 (Purucker, 1996); however, it was not until the 2010s when
research activity in this area intensified, as shown in Figure 1(b). This review considers
research papers in this field over the last three decades, but places an inclusion constraint
requiring that papers must have made use of at least one ML technique. To that end,
knowledge-based systems (e.g., fuzzy logic- and rule-based systems), and ratings method-
ologies (e.g., Elo ratings) (Rotshtein et al., 2005; Tsakonas et al., 2002; Min et al., 2008)
were not considered to be in-scope. Due to the large number of papers that have been
published recently, we needed to constrain the scope of this review further to only focus
on the prediction of match results in team sports. Thus, we did not include studies related
to sports played by individuals or in pairs, e.g., horse racing (Davoodi & Khanteymoori,
2010), swimming (Edelmann-Nusser et al., 2002), golf (Wiseman, 2016), tennis (Somboon-
phokkaphan & Phimoltares, 2009) and javelin (Maszczyk et al., 2014). Although this review
has a narrower scope compared to some prior reviews (Table 1), its contribution lies in pro-
viding a more in-depth analysis of the application of ML for sport result prediction in team
sports than the previous survey articles. The present review introduces the reader to a
broad overview of approaches in which ML techniques have been applied for match result
prediction in team sports. A distinct contribution of this work, in comparison to prior
1286Machine Learning for Predicting Match Results in Team Sport
reviews, lies in our discussion of how the characteristics of particular team sports poten-
tially play a role in the ability of ML to be able to accurately predict match results. For
instance, we explore whether the predictability of matches may depend on whether it is
an invasion (time-dependent) sport or a striking/fielding (innings-dependent) sport. We
also discuss how the occurrence and increments of points or goals may also affect the pre-
dictability of match results. Furthermore, we comment on what some of the key drivers
of successful studies have been with respect to how ML has been applied, and how those
elements have contributed to higher predictive accuracies. In addition, this study makes a
meaningful contribution in identifying future research trends and opportunities in this field,
while combining the findings into a useful set of recommendations for other professionals in
this domain. Lastly, as mentioned, we also highlight the possibility for greater collabora-
tion between researchers from sport performance analysis and those from machine learning.
The lack of collaboration between these fields has often resulted in unclear and inconsistent
terminology, and there are significant opportunities to advance research with a more unified
approach.
The remainder of this paper is structured as follows. In Section 2, we outline our
methodological approach and inclusion criteria for this study. Then, in Section 3, we review
the literature in ML for match result prediction in team sport, categorizing sports by type
(invasion sports and striking/fielding sports) and further sub-categorizing studies based on
the individual sport. We also present tabular summaries of the results of the surveyed
studies by sport. Following this, we provide critical analysis and discussion in Section 4,
before concluding in Section 5.
(a) Papers by year (b) Papers by
decade
Figure 1: Figures depicting the number of papers surveyed by (a) year and (b) decade.
2. Methodology
In this section, we firstly outline our inclusion criteria, which specifies the scope of this
review. Secondly, we categorize the algorithms into groups in order to identify trends in
usage over time. Thirdly, we describe the measure of accuracy, which has been (by far)
the most widely-used metric of performance in this application domain, and we also discuss
1287Bunker & Susnjak
why it is indeed an appropriate metric for match result prediction in team sport. Finally,
we describe recurring future research themes extracted from the surveyed studies.
2.1 Inclusion Criteria
We considered studies that used ML to predict match results in team sports, which were
published between 1996 and 2019 (inclusive). To be included in this review, a study must
have applied at least one ML technique. Thus, studies that only considered fuzzy logic-,
ratings- (e.g., Elo) or statistical-based methods were not included.
Figure 2: Number of surveyed studies by sporting code
A total of 31 papers were considered in this review. The distribution of papers by year
and decade of publication can be seen in Figure 1, which shows an explosion in the level
of interest in this field from 2009 onward. The 31 papers covered nine distinct sports and,
given that some papers studied multiple sports, there were a total of 35 sport studies. The
distribution of the number of studies by sport is shown in Figure 2.
We identified four related review papers that were published in the same time period
that we considered. Table 1 shows the methods applied, the types of sports considered,
and what the applied methods covered were aiming to achieve. Taken together, we consider
these aspects to define the scopes of the prior survey articles. Both Haghighat et al. (2013)
and Keshtkar Langaroudi and Yamaghani (2019) included studies that used ML as well as
knowledge-based systems (e.g., systems based on fuzzy and rule-based logic). Haghighat
et al. (2013) covered both team and non-team sports, focusing on match result prediction
specifically, while Keshtkar Langaroudi and Yamaghani (2019) also included studies that
considered tactical decision making. The review of Razali et al. (2018) had a narrower
scope compared to other reviews (and compared to the present review), and focused on
studies applying one specific ML model, a Bayesian Network (BN), for predicting the match
results of one sport, soccer. The survey of Beal et al. (2019) had a wide scope, considering
artificial intelligence methods (of which machine learning, data mining, and knowledge-
based methods are sub-categories) for match result prediction, as well as tactical decision
making, player investments, and injury prediction. Beal et al. (2019) also considered fantasy
sports in addition to team sports.
Unlike prior work, our review provides more up-to-date coverage and draws out more
critical insights compared to previous studies, e.g., Haghighat et al. (2013), who did not, for
1288Machine Learning for Predicting Match Results in Team Sport
Survey Methods Sports Purpose
Machine Learning
Haghighat et al. (2013) Team Sports & Non-Team Sports Match result prediction
& Knowledge-based Systems
Razali et al. (2018) Bayesian Networks Soccer Match result prediction
Match result prediction,
tactical decision making,
Beal et al. (2019) Artificial Intelligence Team Sports & Fantasy Sports
player investments,
injury prediction
Machine Learning
Keshtkar Langaroudi and Yamaghani (2019) Team & Non-Team Sports Match result prediction, tactical behavior
& Knowledge-based Systems
This review Machine Learning Team Sports Match result prediction
Table 1: Comparison of the scope of this review with that of similar surveys covering a
similar time period
instance, discuss the characteristics of the sports that they considered, and how these may
have had an impact on obtained accuracies. They also did not consider whether accuracies
obtained have improved over time, nor did they discuss the appropriateness of different
models for the purpose of sport result prediction, e.g., in terms of their interpretability.
For this paper, we sought to define the scope of the survey such that it is sufficiently
narrow so that the analysis is adequately in-depth but, at the same time, its scope is
not too wide such that the number of surveyed papers is unmanageable. In this review,
we focus on match result prediction, which is a team-level measure of performance. The
scope of Keshtkar Langaroudi and Yamaghani (2019) was somewhat ill-defined in that
they also included, e.g., coverage of Tilp and Schrapf (2015), who considered the use of
ANNs for analyzing tactical defensive behavior in handball, which is not related to the
prediction of player- or team-level results. Although narrower in scope, our review provides
a wider coverage of surveyed papers than Keshtkar Langaroudi and Yamaghani (2019) and
Haghighat et al. (2013), surveying more than double and triple the number of studies,
respectively. In addition, unlike the above-mentioned review papers, we cover the studies
that arose from the 2017 Open International Soccer Database Competition, which was
important in terms of creating a benchmark dataset for soccer match result prediction (the
review of Haghighat et al., 2013 noted that there were no such benchmark datasets at the
time of their review).
2.2 Algorithm Grouping
ML algorithms were grouped into families of algorithms to identify trends in their usage
patterns. All variants of ANN, such as Back Propagation (BP), Feed-Forward, as well as
Self-Organising Maps and Long Short-Term Memory (LSTM) ANNs, were grouped under
the same umbrella of algorithms. CART, C4.5 and WEKA’s J48 algorithm were grouped un-
der the Decision Tree family of methods. RIPPER, FURIA and ZeroR were merged into the
Rule Sets category, while the Local Weighted Learning (LWL) algorithm was merged with
k-Nearest-Neighbors (kNN). Additionally, AdaBoost, XGBoost, LogitBoost, RobustBoost,
and RDN-Boost were grouped in the Boosting category, while Sequential Minimal Opti-
mization (SMO) (Kohonen, 1990) was combined with Support Vector Machines (SVMs).
Methods that combined several different families of ML algorithms into a single decision-
making architecture were termed Ensemble. Although Naı̈ve Bayes and BNs share some
common theoretical foundations, a decision was made to keep them separate since the lat-
ter includes the ability to incorporate domain knowledge to a larger degree, which was a
1289Bunker & Susnjak
motivating factor for its usage in some studies. A histogram depicting the usage patterns
of these algorithm groups, sorted according to their frequency of use, can be seen in Figure
3.
Figure 3: Histogram of usage patterns of the algorithm groups covered in this survey
2.3 Performance Evaluation Metrics
To allow for meaningful between-study comparisons and interpretations, we consider the
accuracy measure as the primary evaluation metric, which the vast majority of surveyed
studies used. Accuracy is defined as the number of correct predictions divided by the total
number of predictions or, equivalently, the proportion of the sum of total true positive and
true negative classifications divided by all samples in the dataset. Although the charts
presented in the remainder of this paper only include studies that reported accuracy as the
measure of performance, all results, including one paper that reported balanced accuracy
and three that reported the average ranked probability score (RPS), are presented in the
results summary tables in Section 3. It should be noted that the results from binary-class
and multi-class problems are not directly comparable since a given level of accuracy becomes
harder to achieve as the number of classes increases. Thus, the accuracies of studies that
used a three-class formulation instead of a two-class formulation are excluded from the
charts for comparative purposes but, again, are reported in the summary tables.
2.4 Future Research Themes
In order to draw out insights across all papers in terms of what the general future research
direction trends might be, a set of recurring general themes were first extracted from all of
the papers. Subsequently, all of the text referring to future research directions across all of
the papers was encoded based on the extracted themes, and a histogram was rendered that
depicts the frequency of each theme.
3. Literature Review
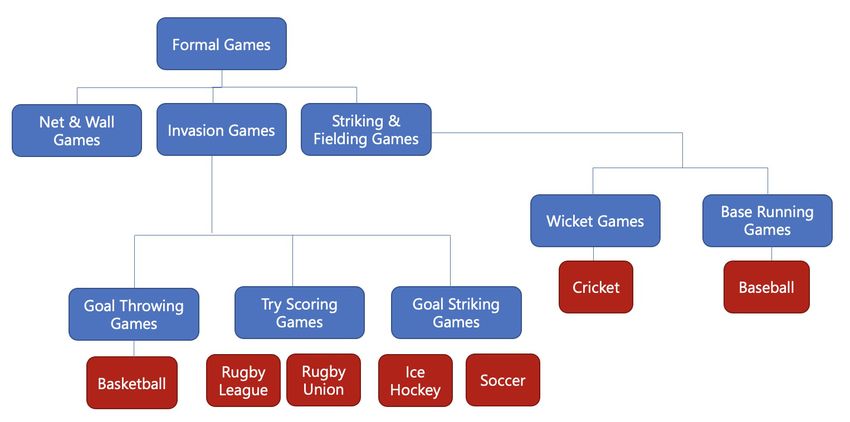
In this section, we review the studies identified by our inclusion criteria, distinguishing
between invasion sports and striking/fielding sports (Figure 4). Subsection 3.1 covers studies
1290Machine Learning for Predicting Match Results in Team Sport
related to invasion sports, including American Football, Rugby Union, Soccer, Basketball
and Ice Hockey, and Subsection 3.2 considers the striking/fielding sports of Baseball and
Cricket. The results of the surveyed studies are also summarized in tables containing the
competition, models applied, the number of matches in the original dataset, as well as the
best performing model and the number of features used in that model.
Figure 4: Classification of formal games in this survey based on the categorizations provided
by Read and Edwards (1992) and Hughes and Bartlett (2002).
3.1 Invasion Sports
Invasion sports are time dependent in that they have matches with fixed periods of time,
commonly divided into halves or quarters. The aim for teams in invasion sports is to move
into the opposition team’s territory by maintaining possession, creating space, and attacking
a goal or target in order to convert scoring opportunities into points while, at the same time,
defending their own space and goal to prevent the opposition from scoring (Mitchell, 1996).
3.1.1 American Football
Purucker (1996) used an ANN and unsupervised learning techniques to predict the results of
National Football League (NFL) football matches, using data from 90 matches from weeks
11 to 16 of the 1994 NFL competition. Six features were included: victories, yardage differ-
ential, rushing yardage differential, turnover margin, time in possession, and betting odds
(the inclusion of betting line odds improved upon initial results). An ANN trained with BP
was used, with BP providing the best performance among the different network training
methods. The unsupervised learning methods that were applied were: the Hamming error
(Hamming, 1950), Adaptive Resonance Theory (ART) (Carpenter & Grossberg, 2003), and
Self-Organizing Maps (SOM). The SOM provided the best performance among the unsu-
pervised methods, however, it could not match the performance of the ANN. Matches from
weeks 12 to 15 were used to predict week 16 matches, with the ANN correctly predicting 11
out of the 14 matches (78.6%) in week 16. Weeks 12 to 14 were also used to predict week
1291Bunker & Susnjak
15, with the ANN correctly predicting 10 of the 14 matches (71.4%) in week 15. The author
recognized that the dataset consisted of a small number of matches and features, and men-
tioned that improvements could be gained by fine-tuning the encoding, ANN architecture,
and training methods.
Kahn (2003) predicted NFL matches using data from 208 matches in the 2003 season.
A BP-trained ANN was used, and the features included were: total yardage differential,
rushing yardage differential, time in possession differential, turnover differential, a home or
away indicator, home team outcome, and away team outcome. The numeric features were
calculated based on the 3-week historical average (the feature’s average value over the past
3 weeks), as well as its average value over the entire season. Using the average over the
entire season achieved higher accuracy. Weeks 1 to 13 of the 2003 competition were used as
training data, and weeks 14 and 15 as the test set. Accuracy of 75% was achieved, which
was slightly better than expert predictions on the same matches. It was suggested that, in
future work, betting odds and team rankings could be included as features, and matches
from previous seasons could be used for model training.
David et al. (2011) used a committees-of-committees approach with ANNs to predict
NFL matches, where many networks were trained on different random partitions of the data.
For training, 500 ANNs were used, and the best 100 were used in each committee, of which
50 were ultimately used. The mean was used to determine the vote of each committee and to
combine their predictions. The features used were differentials between the home and away
teams based on: passing yards, yards per rush play, points, interceptions, and fumbles. The
differentials between the home and away teams were to incorporate the well-known home
advantage phenomenon. The season average of these features were used, apart from the
first five rounds of the season, where the weighted average between the current season’s
and previous season’s features was used. In particular, 100% of the feature value from the
previous season was used for week 1, then 80% of the previous season and 20% of the current
season in week 2, and so on until week 6, at which point only the current season value was
used. A total of 11 inputs were used in the ANN for each game, and the Levenber-Marquadt
(LM) routine was used to train the network. Principal Components (PCA) and derivative
based analyses were applied to determine which features were most influential. It was found
that 99.7% of the variance in their data was due to the passing and rushing differentials.
The results were compared to bookmakers and predictions from thepredictiontracker.com,
and were found to be comparable to the predictions of bookmakers, and better than most of
the online predictions. The avenues for future work were to use different types of ANN, e.g.,
RBF, to include additional statistics (e.g., possession, strength-of-schedule, kicking game
and injuries), to investigate how to best predict games that are early in the season, and to
apply the method to other levels of football (e.g., NCAA) as well as to other sports.
Delen et al. (2012) used an SVM, CART Decision Tree and ANN to predict the results
of NCAA Bowl American Football matches. The Cross-Industry Standard Process for Data
Mining (CRISP-DM) framework (Wirth & Hipp, 2000) was used as the experimental ap-
proach, and the dataset contained 28 features and 244 matches. A classification approach
that predicted home win/away win was compared with a numeric prediction approach that
predicted points margin (home team points minus away team points). CART provided
the best performance, with 86% accuracy (using 10-fold cross validation), which was sta-
tistically significantly better than the other models. The classification approach produced
1292Machine Learning for Predicting Match Results in Team Sport
Paper Models used No. of features No. of Accuracy
Matches of best
model
Purucker (1996) ANN trained with BP*, 6 90 75% (week
Unsupervised: Hamming, 14 and 15
ART, SOM combined)
Kahn (2003) ANN trained with BP 10 208 75%
David et al. (2011) Committees of ANNs 11 unknown unknown
trained with LM
Delen et al. (2012) SVM, CART*, ANN 28 244 86%
Table 2: American Football Studies (* denotes the best performing model).
better results than numeric prediction. When the models were trained on the 2002/2003 to
2009/2010 seasons and then tested on the 2010-2011 season, CART again had the best per-
formance, achieving 82.9% accuracy. The suggested directions for future research were to
include more variables or represent them in different forms, to make use of other classifica-
tion and regression methods (e.g., rough sets, genetic algorithm based classifiers, ensemble
models), to experiment with seasonal game predictions by combining static and time series
variables, and to apply the approach to other sports.
3.1.2 Rugby Union
O’Donoghue and Williams (2004) compared the predictive ability of human experts with
computer-based methods for 2003 Rugby World Cup matches. Multiple Linear Regression,
Logistic Regression, an ANN, and a Simulation Model were the computer-based models
used. Data from the previous four world cups were used to develop predictive models of
match results based on three variables: team strength, determined by synthesising world
rankings (actual world rankings had not yet been introduced at the time of the 2003 Rugby
World Cup), distance travelled to the tournament as a measure of home advantage, and the
number of recovery days between matches. The computer-based models correctly predicted
between 39 and 44.5 of the 48 matches, while the 42 experts correctly predicted an average of
40.7 matches. However, there was far greater variation in the accuracies of the experts, with
the most successful person correctly predicting 46 of the 48 matches. The most accurate
computer-based model was the Simulation Model.
O’Donoghue et al. (2016) compared the accuracy of 12 Linear Regression models in
predicting match results at the 2015 Rugby World Cup. The models differed in terms of:
(i) whether or not the assumptions of the predictive modeling technique were satisfied or
violated, (ii) whether all (1987-2011) or only recent Rugby World Cup tournaments’ (2003-
2011) data were used, (iii) whether the models combined pool and knockout stage match
data, and (iv) whether the models included a variable that tried to capture a relative home
advantage. The common independent variable in all models was the relative quality, which
was the difference from the higher ranked team’s world ranking points. The dependent
variable was the points margin. All models were executed 10,000 times within a simulation
package that introduced random variability. The best model achieved accuracy of 74% and,
notably, match outcomes in international Rugby appeared to be more difficult to predict
1293Bunker & Susnjak
Paper Competition Models used No. of No. of Accuracy
features Matches of best
model
O’Donoghue and Williams (2004) 2003 Rugby Multiple linear regression, Logistic Regression, ANN, 3 48 93%
World Cup Simulation model*
Reed and O’Donoghue (2005) English Pre- Multiple linear regression, ANN*, discriminant func- 7 498 46.1%
miership tion analysis
Rugby
McCabe and Trevathan (2008) Super Rugby ANN trained with BP* and CGD 19 unknown 74.3%
O’Donoghue et al. (2016) 2015 Rugby Linear regression*, Simulation 1 280 74.4%
World Cup
Table 3: Rugby Union Studies (*denotes the best performing model).
than in previous years. The best model used data from all previous Rugby World Cups
in a way that violated the assumptions of Linear Regression, using only one independent
variable and ignoring the relative home advantage, while generating separate models for the
pool and knockout stage matches.
3.1.3 Soccer
Joseph et al. (2006) found that incorporating expert knowledge into a BN model can result
in strong performance, especially when the sample size is small. A decision tree (MC4) and
kNN model were also used to predict the results of Soccer matches played by the English
Premier League (EPL) team, Tottenham. Their dataset consisted of 76 matches. Four
variables were included in the expert model, while 30 variables were used in their original,
general model. The expert BN was found to provide the best performance, achieving 59.2%
accuracy when predicting a home win, away win or draw (a 3-class problem). In the future,
the authors proposed to develop a more symmetrical BN model using similar data but for
all the teams in the EPL, to incorporate player-quality features (e.g., players that have
performed at international level), and to add additional nodes such as attack quality and
defence quality.
Buursma (2010) used data from 15 years of Dutch Soccer to predict match results, and
was interested in: which variables were important for predicting match results, how the
probabilities for the match results can be predicted from these variables, and what bets
should be placed to maximize profit. The author applied the following models in WEKA:
Classification via Regression, Multi-class Classifier, Rotation Forest, Logit Boost, BN, Naı̈ve
Bayes, and ZeroR. There were three match outcomes to be predicted: home win, draw, and
away win. The feature set consisted of 11 features, and all features were either aggregated
or averaged across a team’s previous 20 matches (by experimentation, 20 was found to be
the best number of matches to average across). Classification via Regression and the Multi-
class Classifier had the best prediction accuracy, both achieving 55%. For future work, the
author considered including more features, e.g., yellow/red cards, the number of players
each team has, the management, player budgets and home ground capacities, and was also
interested in applying the model to other similar sports such as basketball, baseball and ice
hockey.
Huang and Chang (2010) used a BP-trained ANN to predict the results of the 64 matches
in the 2006 Soccer World Cup tournament. The output of the ANN was the relative ratio
between two teams for each match, which could then be converted into an odds ratio. Eight
features were selected based on the domain knowledge of the authors: goals for, shots,
1294Machine Learning for Predicting Match Results in Team Sport
shots on goal, corner kicks, direct free kicks on goal, indirect free kicks on goal, possession,
and fouls conceded. Accuracy of 76.9% was achieved based on 2-class prediction, i.e., not
including draws. The ANN was found to have difficulty predicting a draw, which was a
frequent outcome in the group stages.
In contrast to Joseph et al. (2006), Hucaljuk and Rakipović (2011) found that incorpo-
rating expert opinion did not produce any improvement for soccer match result prediction.
Their dataset consisted of 96 matches (6 rounds) in the regular part of the European Cham-
pions League competition, and was split into three different training and test datasets: a
3 round-3 round training-test split, a 4 round-2 round split, and a 5 round-1 round split.
Feature selection resulted in 20 features in their basic feature set. An additional feature
set consisted of the 20 basic features plus variables selected by experts. Naı̈ve Bayes, BNs,
Logit Boost, kNN, a Random Forest, and a BP-trained ANN were compared, with the ANN
performing the best, achieving accuracy of 68%. Perhaps surprisingly, the expert-selected
features were not found to yield any improvement. It was mentioned that further improve-
ments could be gained by refining the feature selection, modeling player form, and obtaining
a larger dataset.
Odachowski and Grekow (2012) analysed fluctuations in betting odds and used ML
techniques to investigate the value in using such data for predicting soccer matches. The
odds for home win, away win and draw for the preceding 10 hours, measured at 10-minute
intervals, were tracked over time (the data was obtained from the Betfair and Pinnacle
Sports websites). A total of 32 features were computed from this time-series, e.g., maximum
and minimum changes in betting odds, overall changes in odds, and standard deviations.
The 10-hour period was divided into thirds and the features were also calculated based on
these sampling periods. The authors balanced their dataset such that there were an equal
number of home wins, away wins, and draws (372 matches in each class). Six classification
algorithms from WEKA were compared: BN, SMO, LWL, Ensemble Selection, Simple
CART, and a Decision Table, and feature selection methods in WEKA were applied. It
was found that draws were especially difficult to correctly predict, with only around 46%
accuracy obtained when attempting 3-class classification. However, accuracy of around 70%
was obtained when ignoring draws. Discretization and feature selection methods were found
to improve results. The authors suggested that additional features describing changes in
betting odds could be included in future work.
Tax and Joustra (2015) aimed to identify easily retrievable features that have utility for
predicting soccer match results. In particular, they sought to explore whether there were
different levels of utility between features broadly classified as public match data sources
and those derived from bookmaker odds. Their experiments covered data from the 2000 to
2013 seasons of the Dutch Eredivisie competition. The researchers conducted numerous ex-
periments comparing the Naı̈ve Bayes, LogitBoost, ANN, Random Forest, CHIRP, FURIA,
DTNB, J48 and Hyper Pipes algorithms from the WEKA toolkit. The experiments were
performed in conjunction with feature selection methods such as PCA, Sequential Forward
Selection and ReliefF. The best results on the public match data sources were achieved by
the Naı̈ve Bayes and ANN classifiers in combination with PCA, achieving accuracy of 54.7%.
FURIA achieved the highest accuracy using bookmaker odds features with 55.3%; however,
this was ultimately not found to be statistically significant. A marginal improvement in
accuracy was realized with LogitBoost and ReliefF when both bookmaker odds and public
1295Bunker & Susnjak
match-data features were used, producing an accuracy of 56.1%. While this was also not at
a statistically significant level, it nonetheless pointed to the potential utility in combining
a broader variety of features for further investigation.
Prasetio (2016) used Logistic Regression to predict EPL soccer results in the 2015/2016
season. Their data set consisted of six seasons, from the 2010/2011 to the 2015/2016
seasons (2,280 matches). Home offense, away offense, home defence, and away defence
were used as the input features, and it was found that home defence and away defence
were significant (the authors did not mention how these offense and defence ratings were
constructed). Despite this, the model that included all four variables was found to yield
higher accuracy. Four different training-test splits were trialed, producing four different
sets of model coefficients. The best performing model achieved 69.5% accuracy based on a
2-class problem (excluding draws). In the future, they remarked that the results could be
used to assist management with game strategy, or the trained models could be turned into
a recommendation system for evaluating player purchase decisions.
Danisik et al. (2018) applied a Long Short-Term Memory (LSTM) neural network
(Hochreiter & Schmidhuber, 1997) to predict match results in a number of soccer leagues.
Classification, numeric prediction and dense approaches were compared, and were con-
trasted with an average random guess, bookmakers’ predictions, and the most common
class outcome (home win). Player-level data were included, which was obtained from FIFA
video games. Incorporating player-level and match history data, a total of 139 features
were included (134 in the dense model). Four EPL seasons, 2011/2012 to 2015/2016, were
considered, comprising a total of 1,520 matches. The average accuracy obtained for a 3-
class classification problem was 52.5%, achieved with the LSTM Regression model, using
the 2011/2012, 2012/2013 and 2015/2016 seasons as the training dataset and the 2013/2014
season as the validation dataset. The accuracy obtained for a two-class problem (excluding
draws) was 70.2%. It was stated that betting odds and additional match-specific player and
team features could be included, and the use of convolution to transform input attributes
during training and a deeper exploration of the ability of LSTMs to leverage features like
specific tactics could be investigated.
The Open International Soccer Database: Prediction Challenge. In 2017, a
significant development took place for ML researchers interested in Soccer. A comprehen-
sive, open-source database called the Open International Soccer Database (Dubitzky et al.,
2019) was compiled and made public. The database contains over 216,000 matches from 52
leagues and 35 countries. The motivation behind this project was to encourage ML research
in Soccer by building an up-to-date knowledge base that can be used on an ongoing basis for
the prediction of real-world soccer match outcomes, as well as to act as a benchmark dataset
that makes comparisons between experiments more robust. In order to maximize the utility
of this database, a deliberate design choice was made to collect and integrate only data that
are readily available for most soccer leagues worldwide, including lower leagues. The conse-
quence of this is that the database lacks fields that are highly-specialized and sophisticated.
Subsequent to its creation, the 2017 Soccer Prediction Challenge was conducted, and a
competition was held based on this dataset, the results of which were published in a special
issue of the Machine Learning (Springer) Journal. The challenge involved building a single
model to predict 206 future match results from 26 different Soccer leagues, which were to be
played between March 31 and April 9, 2017. Unlike most prior studies, which used accuracy
1296Machine Learning for Predicting Match Results in Team Sport
as a performance metric, this competition used the average ranked probability score (RPS),
which measures how good forecasts are compared to observed outcomes when the forecasts
are expressed as probability distributions. In the remainder of this section, we summarize
three of the ML-related papers from this competition.
Hubáček et al. (2019b) experimented with both relational- and feature-based methods
to learn predictive models from the database. Pi-ratings (Constantinou et al., 2012), which
capture both the current form and historical strengths of teams, and a rating based on
PageRank (Page et al., 1999) were computed for each team. XGBoost (regression and
classification) algorithms were employed as the feature-based method, and RDN-Boost was
used as the relational method. The feature-based classification method with XGBoost
performed best on both the validation set and the unseen challenge test set, achieving
52.4% accuracy on the test set. Avenues for future work were to augment the feature set, to
weight aggregated data by recency, to include expert guidance in forming relational concepts
(e.g., using active learning), and to identify features that are conditionally important given
occurrences of certain features at higher levels of the tree.
Constantinou (2019) created a model combining dynamic ratings with a Hybrid BN.
The rating system was partly based on the pi-rating system of Constantinou and Fenton
(2013), computing a rating that captures the strength of a team relative to other teams in a
competition. Pi-ratings update based on how the actual goal differences in a match compare
to the expected result (based on existing ratings). The rating calculation involves placing
more emphasis on the result rather than the margin, so the effect of large goal differences
are dampened. Unlike the original pi-ratings, this version also incorporated a team form
factor, searching for continued over- or under-performance. Four ratings features (two for
the home and away teams) were used as the BN inputs. The model provided empirical
evidence that a model can make good predictions for a match between two specific teams,
even when the prediction was based on historical match data that involved neither of those
two teams. The model achieved accuracy of 51.5% on the challenge test data set. The
author recognized the limited nature of this data set, and mentioned that incorporating
other key factors or expert knowledge, e.g., player transfers, key player availability, interna-
tional competition participation, management, injuries, attack/defence ratings, and team
motivation/psychology may be beneficial.
Berrar et al. (2019) developed two methods, with two feature sets for result prediction:
recency and rating features. Recency feature extraction involved calculating the averages of
features over the previous nine matches, based on four feature groups: attacking strength,
defensive strength, home advantage and opposition strength. Rating features were based
on the performance ratings of each team, and were updated after each match based on
the expected and observed match results and the pre-match ratings of each team. The
XGBoost and kNN algorithms were applied to each of these two feature sets, with both
performing better on the rating feature set. The best performance overall was obtained
with XGBoost on the rating features, although this result was achieved post-competition.
Their best model that was submitted for the competition was a kNN that was applied
to the rating features, which achieved accuracy of 51.9% on the unseen competition test
set. It was mentioned that the generally small number of goals per match and narrow
margins of victory in soccer meant that it is difficult to make predictions based on goals
only. The authors concluded that innovative feature engineering approaches and effective
1297Bunker & Susnjak
incorporation of domain knowledge are critical for sport result prediction modeling, and are
likely to be more important than the choice of ML algorithm. It was again recognized that
the competition dataset was limited, and that data about various game events (e.g., yellow
and red cards, fouls, possession, passing and running rates, etc.), players (e.g., income, age,
physical condition) and teams or team components (e.g., average height, attack running
rate) would likely help to improve results.
Overall, the Open International Soccer Database competition produced a number of
innovative methods and approaches. Notably, researchers commonly combined some form of
ratings-based method with ML techniques. Despite having access to a very large number of
matches available in the competition dataset, all of the studies found that accuracy levelled
off after a certain point, which perhaps indicates that having a broad range of predictive
features is critical for predicting match results in sport. As mentioned, a significant weakness
of the competition dataset is that it does not contain in-play features that occur during
matches.
3.1.4 Basketball
Loeffelholz et al. (2009) predicted National Basketball Association (NBA) match results in
the 2007/2008 season. There were 620 matches that were used for training and testing,
and 30 that were used as the validation set, treated as “un-played” games. The features
included were: field goal percentage, three-point percentage, free-throw percentage, offensive
rebounds, defensive rebounds, assists, steals, blocks, turnovers, personal fouls, and points.
To predict the un-played games, averages of features in the current season were found to
result in better performance than averaging the features across the past five matches. The
authors also investigated ANN fusion using Bayesian Belief Networks and Neural Networks.
Four different types of ANN were applied: a Feed-Forward NN (FFNN), a Radial Basis
Function NN (RBF-NN), a Probabilistic NN (PNN) and a Generalized NN (GRNN). The
best model, a FFNN with four shooting variables, correctly predicted the winning team
74.3% of the time on average, which was better than USA Today, who achieved 68.7%.
An iterative Signal-to-Noise Ratio (SNR) method was used for feature selection, selecting
four out of the 22 original variables. Although fusion did not result in higher accuracy
on this dataset, the authors mentioned that it still warranted further investigation. They
also mentioned that different features could be used in the baseline model, and the models
could be adjusted to determine whether they can beat the betting odds rather than only
predicting the winning team.
Zdravevski and Kulakov (2009) obtained two seasons of NBA data (1,230 matches), the
first of which was used as the training dataset, and the second of which was used as the
test dataset. All of the algorithms in the WEKA machine learning toolkit were applied
with their default parameter settings. A set of 10 features was selected by the authors.
Classification accuracy of 72.8% was achieved with Logistic Regression. It was stated that,
in future work, it would be preferable to compare their predictions to those of experts,
and that it might be possible to cluster training and test data to use different models on
each cluster in order to account for winning and losing streaks. It was also mentioned that
aggregations or ensembles of classifiers (e.g., voting schemes) could be investigated, and that
1298Machine Learning for Predicting Match Results in Team Sport
Paper Competition Models used No. of No. of Accuracy
features Matches of best
model
Reed and O’Donoghue (2005) English Premier Multiple Linear Regression, 7 498 57.9% (3-
League ANN*, Discriminant Function class)
Analysis
Joseph et al. (2006) English Premier Bayesian Network, Expert 4 76 59.2% (3-
League Bayesian Network*, Decision class)
Tree, kNN
McCabe and Trevathan (2008) English Premier ANN trained with BP* and 19 unknown 54.6% (3-
League CGD class)
Buursma (2010) Dutch Eredivisie WEKA: MultiClassClassifier 11 4590 55% (3-
League with ClassificationViaRegres- class)
sion*, RotationForest, Log-
itBoost, Bayesian Network,
Naı̈ve Bayes, ZeroR
Huang and Chang (2010) 2006 Soccer ANN trained with BP 8 64 62.5%
World Cup (3-class),
76.9% (2-
class)
Hucaljuk and Rakipović (2011) European Cham- Naı̈ve Bayes, Bayesian net- 20 96 68% (3-
pions League work, LogitBoost, kNN, ran- class)
dom forest, ANN*
Odachowski and Grekow (2012) Various leagues BayesNet*, SVM, LWL, En- 320 1,116 70.3% (2-
semble Selection, CART, De- class), 46%
cision Table (3-class)
Tax and Joustra (2015) Dutch Eredivisie WEKA: Naı̈veBayes, Logit- 5 4284 56.1% (3-
League Boost*, ANN, RandomForest, class)
CHIRP, FURIA, DTNB, J48,
HyperPipes
Prasetio (2016) English Premier Logistic Regression 4 2280 69.5% (2-
League class)
Danisik et al. (2018) Various leagues LSTM NN classification, 139 1520 52.5%
LSTM NN regression*, Dense (3-class),
Model 70.2% (2-
class)
Hubáček et al. (2019b) 52 leagues XGBoost classification*, XG- 66 216,743 52.4% (3-
Boost regression, RDN-Boost class)
Constantinou (2019) 52 leagues Hybrid Bayesian Network 4 216,743 51.5% (3-
class)
Berrar et al. (2019) 52 leagues XGBoost*, kNN 8 216,743 51.9%** (3-
class)
Table 4: Soccer Studies (*denotes the best performing model). Accuracies for 2-class
(win,loss) and 3-class (win,loss,draw) problems are denoted. **Berrar et al. (2019)’s best
performing model was kNN, but post-competition they mention that they improved on this
with XGBoost. The accuracy of 51.9% is for their in-competition result - the XGBoost
accuracy was not reported in their paper but it would have been slightly higher than this.
1299Bunker & Susnjak
automatic feature selection methods should be used rather than features being manually
selected by the authors.
Ivanković et al. (2010) used a BP-trained ANN to predict the results of the Serbian First
B Basketball League, using five seasons from 2005/2006 to 2009/2010 (890 matches). The
authors used the CRISP-DM framework for their experimental approach, and investigated
how the successful shot percentage in six different regions of the court affected match
results. The input dataset was divided into training and testing data (75%:25%), and
66.4% accuracy was obtained on the test set. The authors then reverted back to the data
preparation phase of the CRISP-DM framework to see whether adding additional variables
(offensive rebounds, defensive rebounds, assists, steals, turnovers, and blocks) could improve
results. This improved accuracy to just under 81%. It was concluded that actions in the
zone directly under the hoop, in particular, rebounds in defence and scoring in this zone,
were crucial to determining the outcome of the game. It was mentioned that, in future
work, a richer data set and new software solutions may help to ensure that all relevant
events are included.
Miljković et al. (2010) predicted basketball match results using data from 778 games in
the regular 2009/2010 NBA season. The features were divided into game (in-play) features,
which directly relate to events within the match (e.g., fouls per game and turnovers per
game), and those that relate to standings (e.g., total wins and winning streaks). Naı̈ve Bayes
achieved 67% accuracy (10-fold cross validation), and was found to be the best performing
model when compared to kNN, a Decision Tree and SVM. Their future research plans
included applying their system to other sports, and to experiment with other models such
as ANNs.
Cao (2012) created an automated data collection system, obtaining six years of NBA
matches from the 2005/2006 season to the 2010/2011 season. The dataset, comprising
around 4,000 matches, was divided into training, test, and validation sets. Four models
were compared: Simple Logistic Regression, Naı̈ve Bayes, SVM, and a BP-trained ANN.
The feature set of 46 variables was selected based on the domain knowledge of the author.
All models were found to produce similar accuracies, with Simple Logistic Regression, which
performs automatic feature selection, achieving the highest accuracy (67.8%). The best
expert predictions on teamrankings.com were slightly better, achieving 69.6% accuracy.
The author suggested that, in the future, clustering could be used to group players by
positional group, or to identify outstanding players, and outlier detection methods could
be used to identify outstanding players or team status. Investigating the impact of player
performance on match results, and comparing different feature sets derived from box-scores
and team statistics were also mentioned as avenues for future work.
Shi et al. (2013) investigated the viability of ML in the context of predicting the results
of individual NCAAB matches which, up to this point, had been dominated by statistical
methods. They used the WEKA toolkit to compare the accuracies of the ANN, C4.5,
RIPPER and Random Forest algorithms. Experiments were conducted using data from
six seasons, together with an expanding window approach so that initially training was
performed on the 2008 season and testing on the 2009 season. Thereafter, the combination of
all previous seasons comprised the training set until the 2013 season. The authors concluded
that, on average, the ANN with default parameter settings provided the best accuracies,
though statistical tests to confirm this were not provided. The top-ranked features in
1300Machine Learning for Predicting Match Results in Team Sport
Paper Competition Models used No. of No. of Accuracy
features Matches of best
model
Loeffelholz et al. (2009) NBA ANN (types: FFNN*, 4 650 74.3%
RBG, PNN, GRNN, fu-
sions of these)
Zdravevski and Kulakov (2009) NBA All models in WEKA 10 1,230 72.8%
(Logistic Regression*)
Ivanković et al. (2010) Serbian First ANN trained with BP 51 890 81%
B
Miljković et al. (2010) NBA kNN, Decision Tree, 32 778 67%
SVM, Naı̈ve Bayes*
Cao (2012) NBA Simple Logistic Re- 46 4,000 67.8%
gression*, Naı̈ve Bayes,
SVM, ANN
Shi et al. (2013) NCAAB ANN*, C4.5 Decision 7 32,236 74%
Tree, RIPPER, Ran-
dom Forest
Thabtah et al. (2019) NBA ANN, Naı̈ve Bayes, 8 430 83%
LMT Decision Tree*
Table 5: Basketball Studies (*denotes the best performing model).
terms of importance were location, the “four factors” (Oliver, 2002) and adjusted offensive
and defensive efficiencies (kenpom.com). The authors remarked that they experienced an
upper limit of 74% accuracy that they could not improve beyond, and noted that feature
engineering and selection hold promise for an improvement in results.
Thabtah et al. (2019) used Naı̈ve Bayes, an ANN, and an LMT Decision Tree model to
predict the results of NBA matches, focusing on trialing various different subsets of features
in order to find the optimal subset. Their dataset, obtained from Kaggle.com, consisted
of 21 features and 430 NBA finals matches from 1980 to 2017 and a binary win/loss class
variable. Defensive rebounds were found to be the most important factor influencing match
results. The feature selection methods used were: Multiple Regression, Correlation Feature
Subset (CFS) selection (Hall, 1998), and RIPPER (Cohen, 1995). Defensive rebounds were
selected as being important by all three feature selection methods. The best performing
model (83% accuracy) was trained on a feature set consisting of eight features, which were
selected with RIPPER and trained using the LMT model. The authors suggested that
the use of a larger dataset, more features (e.g., players, coaches), and other models (e.g.,
function-based techniques and deep learning methods) are potential avenues for further
research.
3.1.5 Ice Hockey
Weissbock et al. (2013) noted that Ice Hockey had not received much attention in ML re-
search with respect to predicting match results. The continuous nature of this sport makes
it difficult to analyze, due to a paucity of quantifiable events such as goals. This character-
istic was cited as a possible reason for the lack of attention Hockey had received historically.
The authors focused on exploring the role of different types of features in predictive accu-
racies across several types of ML algorithms. They considered both traditional statistics
as features, as well as performance metrics used by bloggers and statisticians employed by
1301Bunker & Susnjak
teams. They used WEKA’s implementations of ANN, Naı̈ve Bayes, SVM and C4.5 for
training classifiers on datasets describing National Hockey League (NHL) match results in
the 2012/2013 season. The entire dataset amounted to 517 games. The authors concluded
that traditional statistics outperformed the newer performance metrics in predicting the
results of single games using 10-fold cross validation, while the ANN displayed the best
accuracy (59%). Research into extracting more informative features and predicting the
winners of NHL playoffs was cited as future work, as well as incorporating knowledge from
similar sports such as soccer.
Weissbock and Inkpen (2014) combined statistical features with features derived from
pre-game reports to determine whether the sentiment of these reports was useful for predict-
ing NHL Ice Hockey matches. Data from 708 NHL matches in the 2012/2013 season were
collected, and the pre-game reports were obtained from NHL.com. Both natural language
processing and sentiment analysis based features were used in the experiments. The three
statistical features, identified from their previous research (Weissbock et al., 2013), were:
cumulative goals against and their differential, and the match location (home/away). The
following algorithms from the WEKA toolkit were applied with their default parameters:
ANN, Naı̈ve Bayes, Complement Naı̈ve Bayes, Multinomial Naı̈ve Bayes, LibSVM, SMO,
J48 Decision Tree, JRip, Logistic Regression, and Simple Logistic Regression. Three models
were compared: models that used only the statistical features, models that used only the
pre-game report text, and models trained with the features from sentiment analysis. It was
found that models using only the features from pre-game reports did not perform as well as
models trained with only the statistical features. A meta-classifier with majority voting was
implemented, where the confidence and predicted output from the initial classifiers was fed
into a second layer. This architecture provided the best accuracy (60.25%). This cascading
ensemble approach on the statistical feature set provided superior performance to using
both feature sets, suggesting that the pre-game reports and statistical features provided
somewhat different perspectives. The authors commented that it was difficult to predict
matches with a model trained using data from one or two seasons prior, probably due to
player and coaching changes, etc.
Gu et al. (2019) reported that ensemble methods provided encouraging results in the
prediction of outcomes of NHL Hockey matches over multiple seasons. The data extrac-
tion was automated and scraped from several websites containing NHL matches from the
2007/2008 to 2016/2017 seasons (1,230 matches). Data was merged from several sources
including historical results, opposition information, player-level performance indicators, and
player ranks using PCA. A total of 26 team performance variables were also included in their
model. The kNN, SVM, Naı̈ve Bayes, Discriminant Analysis and Decision Tree algorithms
were applied, along with several ensemble-based methods. The ensemble-based methods
(Boosting, Bagging, AdaBoost, RobustBoost) achieved the highest accuracy on the test set
(91.8%). In terms of future research, the authors mentioned that additional data could
further improve predictions, and different or additional features could be used, e.g., player
ranking metrics, moving-averaged or exponentially-smoothed team and player performance
metrics, psychological factors, the strategic or tactical judgements of coaches/experts, and
players’ physical or mental assessments. They also mentioned that the ML problem could
be re-formulated so that a different outcome is predicted, e.g., whether a team will make
1302You can also read