The 2018 European heatwave led to stem dehydration but not to consistent growth reductions in forests
←
→
Page content transcription
If your browser does not render page correctly, please read the page content below
ARTICLE
                  https://doi.org/10.1038/s41467-021-27579-9                  OPEN

                  The 2018 European heatwave led to stem
                  dehydration but not to consistent growth
                  reductions in forests

                  Heatwaves exert disproportionately strong and sometimes irreversible impacts on forest
                  ecosystems. These impacts remain poorly understood at the tree and species level and
1234567890():,;

                  across large spatial scales. Here, we investigate the effects of the record-breaking 2018
                  European heatwave on tree growth and tree water status using a collection of high-temporal
                  resolution dendrometer data from 21 species across 53 sites. Relative to the two preceding
                  years, annual stem growth was not consistently reduced by the 2018 heatwave but stems
                  experienced twice the temporary shrinkage due to depletion of water reserves. Conifer
                  species were less capable of rehydrating overnight than broadleaves across gradients of soil
                  and atmospheric drought, suggesting less resilience toward transient stress. In particular,
                  Norway spruce and Scots pine experienced extensive stem dehydration. Our high-resolution
                  dendrometer network was suitable to disentangle the effects of a severe heatwave on tree
                  growth and desiccation at large-spatial scales in situ, and provided insights on which species
                  may be more vulnerable to climate extremes.

                  A full list of authors and their affiliations appears at the end of the paper.

                  NATURE COMMUNICATIONS | (2022)13:28 | https://doi.org/10.1038/s41467-021-27579-9 | www.nature.com/naturecommunications   1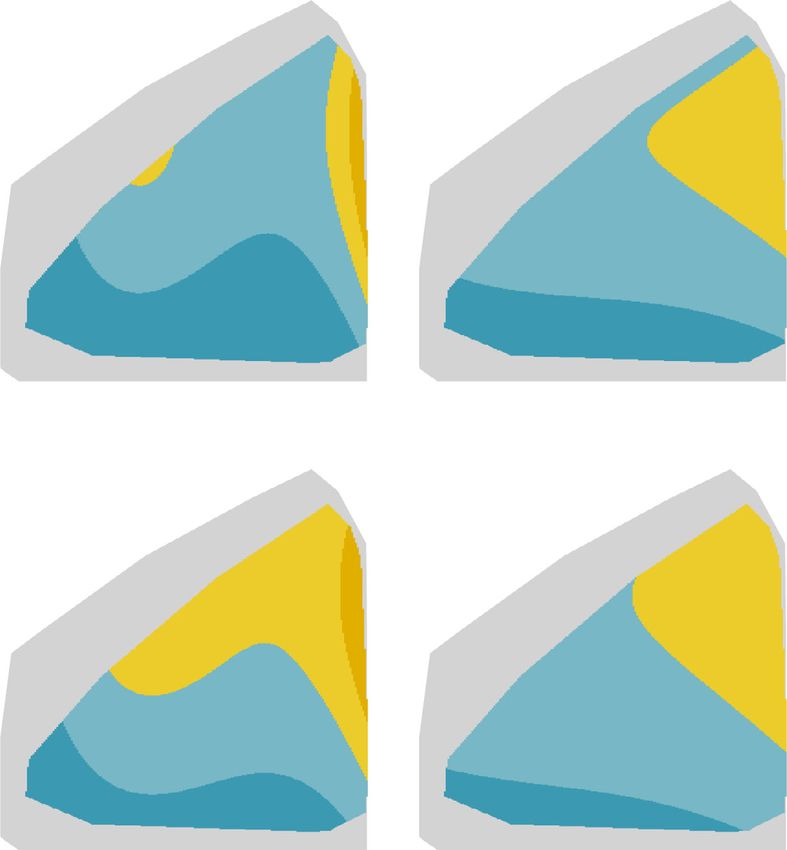
ARTICLE                                                                 NATURE COMMUNICATIONS | https://doi.org/10.1038/s41467-021-27579-9

E
      xtreme climatic events are expected to become more com-                       conservative water-use strategy24 to avoid increases in
      mon in a warming world1. Frequency and intensity of                           xylem tension that could result in hydraulic failure.
      heatwaves, broadly defined as periods of consecutive days                  To test these hypotheses, we compiled high-resolution dend-
with anomalously high temperatures, have increased during the                rometer records from 377 trees that met our initial requirements
last decades and are expected to continue increasing throughout              for data quality and temporal coverage (see Methods). Data were
the 21st century2. Severity of heat extremes has particularly                collected from 53 sites in mostly Central and Atlantic Europe
increased across European regions3. For instance, the length of              (Fig. 1), i.e., in areas where the HW2018 was particularly
summer heatwaves has doubled and the number of days regis-                   intense16,18,25. During the heatwave timeframe (from day of year
tering heat extremes has tripled in western Europe since 18804.              (DOY) 208 until 264; Supplementary Fig. 1), only three sites
Heatwaves rarely occur as pure temperature extremes but are                  located in Romania experienced lower atmospheric and soil
often accompanied by anomalies in other climate parameters                   drought in 2018 compared to 2017 (Supplementary Fig. 2),
(“compound events”)5, such as a lack of precipitation and high               another year of remarkable hot droughts in southern Europe26. A
evaporative demand. Drought stress thereby exacerbates the                   total of 21 broadleaf and conifer species were monitored during
negative effects of extreme temperatures on tree productivity,               three consecutive years (2016–2018), with Fagus sylvatica,
vigour and survival6. The European heatwave in 2003, for                     Quercus spp. (including Q. petraea and Q. robur), Picea abies and
instance, reduced ecosystem gross primary production over the                Pinus sylvestris being best represented (Supplementary Table 1).
continent by 30%7. Under combined drought and heat stress,                      From the individual dendrometer time series, we derived tree-
stomatal closure and the associated inhibition of photosynthesis             specific daily cumulative GRO and daily extremes of TWD
limit ecosystem carbon uptake. As soils dry out and canopy                   (minimum and maximum TWD, see Fig. 1c, d) during the
transpiration exceeds root water uptake, tree water reservoirs               HW2018 timeframe. Minimum TWD, commonly measured at
progressively deplete. Impoverishment of stem water status con-              night-time, was considered a baseline for comparison, as it is
strains growth8,9, further reducing forests´ potential to sequester          buffered against diurnal variability due to day-time transpira-
carbon in woody biomass. In the short term, water release from               tional water loss and thus reflects seasonal drought stress, which
internal stem reserves can temporarily buffer the negative effects           is largely controlled by available soil moisture. Maximum TWD
of drought on the integrity of the tree´s vascular system8,10.               was considered to additionally incorporate sub-daily stem
However, extended drought episodes will eventually cause                     shrinkage related to transpiration and diurnal drought stress
hydraulic failure, together with tissue dehydration and damage,              dynamics, which are more directly linked to short-term fluctua-
which may result in drought-induced tree mortality11,12.                     tions of atmospheric water demand and hence temperature.
   High-resolution dendrometers can capture complex signals                  Absolute values of TWD during HW2018 and annual GRO
integrating tree stem irreversible growth (GRO hereafter) and                varied substantially across and within species (Supplementary
reversible radial fluctuations due to stem water release and refill.           Fig. 3). Such variability, of one order of magnitude, called for the
The latter mostly reflect bark tissue shrinking and swelling, which           use of tree-specific ratios to evaluate the effect of HW2018 on
commonly follows a sub-daily pattern. Prolonged elastic reduc-               TWD and GRO. Tree-specific normalisation of 2018 data relative
tions in stem diameter as drought proceeds are commonly                      to control years (see Methods) accounted for variability related to
referred to as tree water deficit13 (TWD hereafter). Therefore,               individual stem size, bark thickness, local environmental condi-
sub-daily measurements of stem diameter variations from                      tions, and wood traits that might affect depletion and refilling
dendrometers can provide valuable in situ metrics on the long-               rates of stem water reserves. For instance, these include xylem
term physiological response of trees to changing climate in terms            hydraulic conductivity, hydraulic capacitance, wood elasticity,
of growth and water status8,14,15.                                           and xylem resistance to embolism formation. Tree-specific
   The summer of 2018 was exceptionally hot and dry in north-                response ratios therefore allow for comparison of TWD and
western Europe, whereas southern regions experienced relatively              GRO across species and sites, highlighting differential temporal
cooler and wetter conditions16–18. Large-scale assessments of                dynamics due to the HW2018. Unexpectedly, consistent reduc-
forest productivity and sensitivity to environmental stresses                tions in stem growth were not observed across species and sites
during the 2018 heatwave (HW2018) have received great                        during 2018 but tree stems experienced greater shrinkage, with
attention18, with approaches ranging from multi-temporal satel-              different sub-daily patterns found between conifer and broadleaf
lite images16,19–21, ecosystem-level carbon fluxes20,22 and                   species.
process-based model simulations20,23. Each of these approaches
has its advantages and shortcomings, but none provides infor-
mation on tree-level physiological responses to such increasingly            Results
frequent heatwave events. Large-scale analyses of high temporal-             Minimum TWD averaged across the heatwave timeframe in 2018
resolution dendrometer records could yield more mechanistic                  relative to the two preceding control years almost doubled (back-
insight into drought impacts on tree growth and desiccation                  transformed minimum TWD2018:control = 1.8 SE = 1.1, P < 0.001,
along environmental gradients. However, the lack of harmonised               Fig. 2a, Supplementary Table 2), with no differences between
datasets has precluded composite analysis of regional-scale                  broadleaves and conifers (P = 0.4). Likewise, maximum TWD in
dendrometer data to date.                                                    2018 was greater than during the control years (maximum
   Here, we evaluate the effect of HW2018 on GRO and TWD                     TWD2018:control = 1.6 SE = 1.1, P < 0.001), and similar for both
across 21 widespread European tree species using a network of                taxonomic clades (P = 0.5). By contrast, the average annual
high-temporal resolution dendrometer and environmental data.                 growth did not consistently differ between 2018 and the control
Specifically, we hypothesised that:                                           years (GRO2018:control = 0.9 SE = 1.1, P = 0.1, Fig. 2b, Supple-
                                                                             mentary Table 2), nor was GRO2018:control different for broadleaf
(1) Relative to previous years, HW2018 will limit annual GRO                 and conifer species (P = 0.1). When selecting sites that experi-
    and increase TWD, with the magnitude of these changes                    enced on average higher vapour pressure deficit (VPD, as a proxy
    depending on site-specific environmental conditions.                      for atmospheric drought) and lower relative extractable water
(2) TWD as an index of drought stress will be lower in conifers              (REW, as a proxy for soil drought) during 2018 compared to the
    compared to broadleaf species, as conifers commonly                      previous year (Supplementary Fig. 2), a non-significant trend of
    exhibit a relatively strong stomatal control and a                       lower GRO in 2018 than during control years was detected

2                NATURE COMMUNICATIONS | (2022)13:28 | https://doi.org/10.1038/s41467-021-27579-9 | www.nature.com/naturecommunications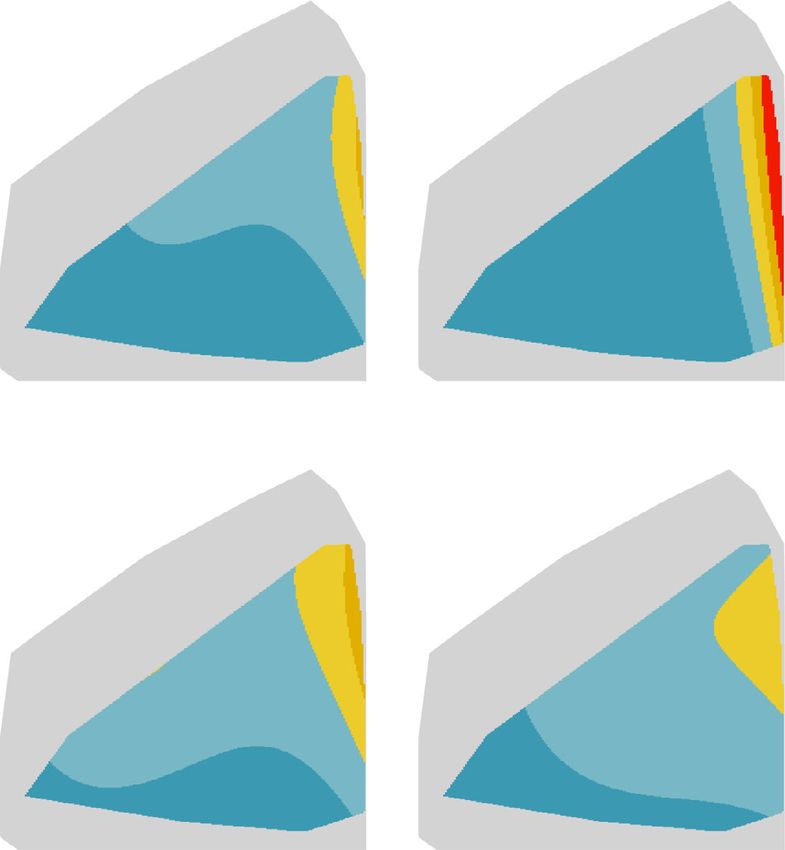
NATURE COMMUNICATIONS | https://doi.org/10.1038/s41467-021-27579-9 ARTICLE
Longitude (°E)
Dendrometer network
−10 0 10 20 30
2016 2017 2018 T a (°C)
a
55
No data
6−8
Latitude (°N)
50 8 − 10
10 − 12
12 − 14
45
14 − 16
16 − 18
40 18 − 20
Sites = 53 20 − 22
Species = 21
35
REW (−)
b
No data
0.9 − 1
0.8 − 0.9
0.7 − 0.8
0.6 − 0.7
0.5 − 0.6
0.4 − 0.5
0.3 − 0.4
0.2 − 0.3
0.1 − 0.2
0 − 0.1
d
c
00:00
00:00
25
Tree stem radius (mm)
Dendrometer
GRO
TWD
23 Heatwave2018
21
Site = Lötschental, N13
Species = Picea abies Max. TWDdaily
19 Country = Switzerland Min. TWDdaily
2016 2017 2018
Time
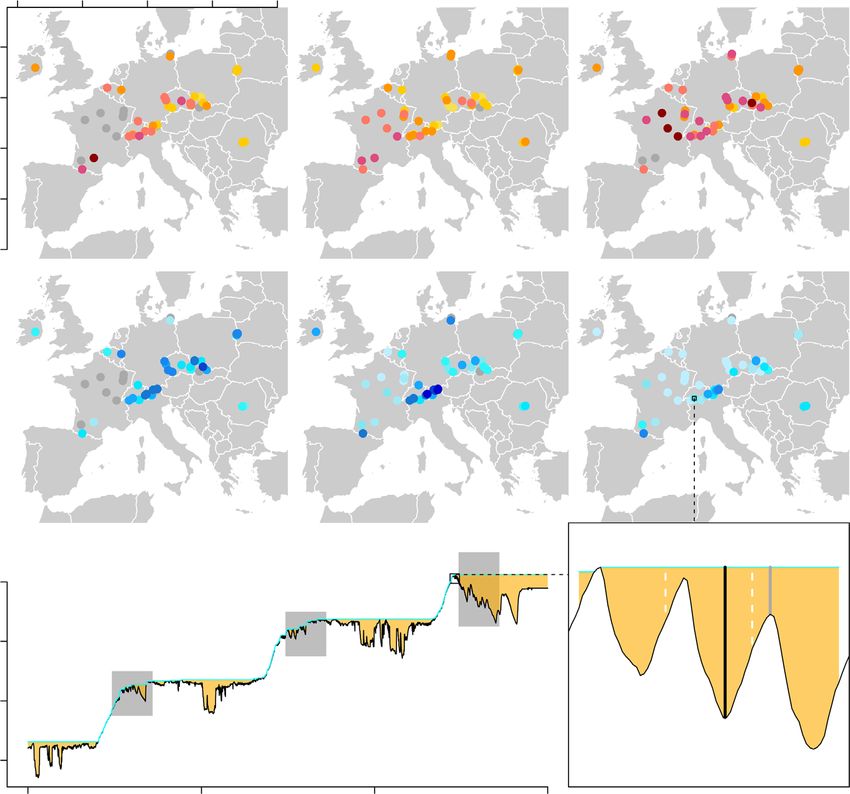
Fig. 1 Climatic conditions during the 2018 heatwave period and dendrometer network. a, b Spatial distribution of dendrometer sites and their respective
mean atmospheric temperature (Ta in °C) and relative extractable water (REW) during the 2018 heatwave timeframe (day of year 208 until 264) for
2016–2018. Sites with incomplete dendrometer time series data are indicated with grey dots. c Tree stem radius monitored at the Swiss Lötschental (site
N13) for a Picea abies (L.) Karst. tree. The period corresponding to the 2018 heatwave is shown in all three years (defined as Heatwave2018), in addition to
tree water deficit (TWD) and extracted growth (GRO). d Inset of three days of tree stem radius monitored for the P. abies tree, where the concept of daily
minimum and maximum TWD is shown (Max. TWDdaily and Min. TWDdaily, respectively).
(P = 0.06). Response metrics minimum TWD2018:control and between broadleaves and conifers (Fig. 3e). Therefore, differences
GRO2018:control were inversely related across species (P = 0.03). between minimum and maximum TWD2018:control (sub-daily
To isolate the tree-specific response from the site-specific TWD amplitude hereafter), which denote sub-daily dynamics of
environmental stress and compare between broadleaf and conifer stem day-time shrinkage and night-time swelling (Fig. 1d), were
species, daily minimum and maximum TWD2018:control were higher in broadleaves compared with conifers across the hydro-
regressed against absolute daily VPD and REW during HW2018, meteorological space. This means that broadleaves had a greater
hereafter referred to as hydrometeorological space. This proce- capacity to refill stem water reservoirs during night-time, when
dure was used to ensure the comparison of daily minimum and the atmospheric evaporative demand was low. Note that the
maximum TWD2018:control under comparable climatic conditions hydrometeorological space was similar for broadleaf and conifer
and is presented in a 3-dimensional space using linear mixed species (Supplementary Figs. 4 and 5). Stem shrinkage patterns
effect models with a polynomial structure (see Methods). Both were further assessed in relation to HW2018 relative intensity.
daily minimum and maximum TWD2018:control showed significant For this, VPD2018:control and REW2018:control were estimated con-
responses to decreasing REW and increasing VPD for broadleaf sidering a longer control period (2000–2017) to better capture
and conifer species (P < 0.05; Supplementary Table 3), with background climate conditions. Consistent shrinkage patterns
greater TWD2018:control ratios during periods of lower soil water were found (Supplementary Fig. 6), although the overlap in the
availability and higher atmospheric evaporative demand common hydrometeorological space was limited, and differences
(Fig. 3a–d). The hydrometeorological space in which daily mini- in sub-daily TWD amplitude between broadleaves and conifers
mum TWD was larger during 2018 compared to the 95th per- were reduced.
centile of the control period (daily minimum TWD2018:control > 1) The response of daily minimum TWD2018:control to absolute
was approximate twice the size for conifers (23%) relative to daily REW and VPD was additionally isolated for the four most
broadleaves (10%; Fig. 3e). Contrastingly, daily maximum abundant (Supplementary Table 1) and commercially relevant
TWD2018:control across the hydrometeorological space was similar European tree species27 in the dendrometer network (Fig. 4). The
NATURE COMMUNICATIONS | (2022)13:28 | https://doi.org/10.1038/s41467-021-27579-9 | www.nature.com/naturecommunications 3ARTICLE NATURE COMMUNICATIONS | https://doi.org/10.1038/s41467-021-27579-9
Broadleaf Conifer All increment are therefore highly dependent on site-specific condi-
tions and, importantly, on the timing of the extreme climatic
log10(Min. TWD2018:control)
1.0 a
event. Early phenological phases of wood formation, namely cell
TWD division, and enlargement, result in stem-girth increment. Later
0.5
GRO during the growing season, the formation, filling, and lignification
of secondary cell walls increase the density of the newly forming
0.0 biomass but do not translate into detectable volumetric growth33.
The HW2018 started in late July at most of the monitored sites
−0.5
(Supplementary Fig. 1), when cell division and enlargement
1.0
phases were probably about to cease. Hence, the vast majority of
b
the annual stem-girth increment was already formed at this time,
log10(GRO2018:control)
0.5 which may explain the absence of a clear heatwave effect on
2018 stem volumetric growth. Most likely, only drought stress
0.0 during spring and early summer can effectively limit current-year
volumetric growth34,35, while drought later in the season might
−0.5
reduce wood density to a greater extent36. Our tree-level obser-
vations agree with ecosystem-level measurements of carbon
−1.0
exchange. Ecosystem carbon uptake across central and northern
Quercus pubescens
Carpinus betulus
Castanea sativa
Acer platanoides
Acer pseudoplatanus
Ulmus spp.
Fagus sylvatica
Quercus petraea
Quercus robur
Fraxinus excelsior
Betula spp.
Pinus sylvestris
Alnus glutinosa
Ailanthus altissima
Tilia cordata
Pinus cembra
Picea sitchensis
Larix decidua
Picea abies
Europe was stimulated during spring 2018, which was char-
acterized by relatively warm and humid conditions17,18,20,23. The
transition into an extreme summer drought (HW2018) rapidly
reduced the strength of ecosystem carbon sink17,18,20,23, likely
due to hydromechanical restrictions to cell wall deposition and
lignification8,36. At the annual scale, spring growth stimulation
Fig. 2 Species-specific ratios of tree water deficit (TWD) during the 2018
and summer reduction compensated each other, thereby resulting
heatwave and 2018 annual growth (GRO) relative to control years
in nearly average ecosystem carbon uptake over the year23.
(2016–2017). a, b Boxplots of broadleaf and conifer minimum tree water
In contrast to GRO, greater stem shrinkage in 2018 relative to
deficit (min. TWD2018:control; a) and annual radial stem growth
the control years was detected in both broadleaf and conifer
(GRO2018:control; b) in response to the 2018 heatwave relative to control
species, indicating increased stem dehydration. Stimulation of
years. Log transformed ratios are shown to linearise and normalise the
canopy leaf area due to favorable spring conditions for foliage
response metric. log10(TWD2018:control) above zero indicates a larger
development, leading to enhanced transpiration, likely exacer-
shrinkage was registered during the 2018 heatwave compared to the
bated drought effects of HW2018 on soil and stem water status17.
control years, whereas log10(GRO2018:control) near zero indicates that stem
Stem dehydration during HW2018 progressively reduced the
growth in 2018 was similar to that in control years. Centerlines, box limits,
trees´ ability to release stored water into the transpiration stream,
and whiskers represent the median, upper and lower quartiles, and
likely leading to substantial losses in hydraulic conductivity8,10.
extremes excluding outliers (those further than the 1.5x interquartile
Accordingly, leaf cellular damage and premature leaf senescence
range). n = 175 tree stems over 37 sites.
as initial symptoms of partial dysfunction of the hydraulic
system6 were detected at larger-spatial scales. Remote-sensing
highest values of minimum TWD2018:control were found for oak observations in central and northern Europe have reported
trees (> 2, Fig. 4b). However, such severe shrinkage was uniquely anomalous reductions in normalised difference vegetation
observed in a small area of largely dried-out soils (REW < 0.1), index16,21,25 and leaf area index19 during summer 2018. Such a
regardless of VPD (Supplementary Table 4). Most of the oak reduction in summer vegetation greenness reflects an early
hydrometeorological space showed the lowest values of minimum leaf fall and even partial or complete canopy dieback21,25.
TWD2018:control (74% with values < 0.5, Fig. 4e), suggesting a Moreover, stem dehydration during HW2018 may have slightly
strong capacity of this species to maintain stem hydration during shortened phases of cell division and enlargement35, as suggested
HW2018 across the monitoring network. On the contrary, both here by the inverse relationship between TWD2018:control and
conifer species (Norway spruce and Scots pine) experienced GRO2018:control. In the medium and long term, legacy effects of
moderate to high minimum TWD2018:control across most of their HW2018 are expected to further dampen stem growth37,38 and
hydrometeorological space (74–77% with values > 0.5, Fig. 4e), potentially trigger tree decline, as recently observed in some areas
with greater relative stem shrinkage with increasing atmospheric of central Europe25.
and soil drought (Fig. 4c–d, Supplementary Table 4). European
beech exhibited an intermediate behaviour between oak and
conifer species (Fig. 4a). Stem dehydration across the hydrometeorological space. Con-
trary to our second hypothesis, a more conservative water-use
Discussion strategy of conifer species24 did not confer a greater capacity to
Overall stem growth and dehydration responses to the heat- maintain stem water reserves during HW2018 (Fig. 3), as simi-
wave. Our results partially supported hypothesis 1, as stems larly found before among pine, spruce, and oak trees39. Conifers
experienced larger shrinkage during HW2018 relative to control showed larger daily minimum TWD2018:control than broadleaf
years. However, no consistent reductions in annual stem growth species under comparable hydrometeorological conditions,
were found (Fig. 2), as a variable response among sites and denoting greater stem dehydration during the heatwave relative to
species canceled each other out. Illustratively, regional studies the control period. More importantly, the sub-daily TWD
have reported negative28,29, neutral30,31, and positive32 responses amplitude was relatively low for conifers across the hydro-
of annual stem growth to HW2018. Similarly, our results were meteorological space, indicating limited refilling of internal stem
dependent on the site selection for analysis, as more restrictive water reserves on a sub-daily basis. These results could be
criteria according to HW2018 intensity tended to increase the explained by the low xylem-specific hydraulic conductivity
plausibility of growth reductions. Limitations to stem-girth observed in conifer woods40, a lower leaf minimum conductance
4 NATURE COMMUNICATIONS | (2022)13:28 | https://doi.org/10.1038/s41467-021-27579-9 | www.nature.com/naturecommunicationsNATURE COMMUNICATIONS | https://doi.org/10.1038/s41467-021-27579-9 ARTICLE
REW2018 (−)
1.0 0.8 0.6 0.4 0.2 0.0 1.0 0.8 0.6 0.4 0.2 0.0
a b
2.0
Database range
Common range
Daily minimum
1.5
TWD2018:control
1.0 > 1.5
1.0 − 1.5
0.5 − 1.0
0.5 < 0.5
VPD2018 (kPa)
0.0
c d e
2.0
Daily min. TWD: Broadleaf
Daily maximum
1.5
Daily max. TWD: Broadleaf
1.0
Daily min. TWD: Conifer
0.5
Daily max. TWD: Conifer
0.0
Broadleaf Conifer
0 20 40 60 80 100
Response area (%)
Fig. 3 Response of tree water deficit (TWD) ratio to vapor pressure deficit (VPD, kPa) and relative extractable water (REW, unitless [-]) of broadleaf
(a, c) and conifer (b, d) species in the hydrometeorological space. a–d Linear-mixed effect model output of the ratio of the daily minimum (a, b) and
maximum (c, d) TWD during the 2018 heatwave compared to the 95th percentile of the control period (TWD2018:control), while VPD2018 and REW2018 refer
to the absolute values during the 2018 heatwave. TWD2018:control above 1 indicates that a larger shrinkage was registered during the 2018 heatwave relative
to the control period. From the hydrometeorological space range of the entire database (indicated in grey), models have been adjusted for the common
climatic range of broadleaf and conifer species only (indicated with dotted lines). e Bars indicate the percentage of the hydrometeorological space covering
different ranges of TWD2018:control values (see legend).
under high VPD41, or a hydraulic disconnection from the thermal stress. This relatively risky hydraulic strategy of decid-
atmosphere and the rizhospere42,43. This strategy comes however uous broadleaves might be related to their ability to shed leaves to
at the expense of limited refilling of stem water reserves through avoid further dehydration under extreme drought stress, as foli-
root water uptake during night-time, as previously observed for age and hydraulic functionality can be restored during the next
Scots pine trees42. Note that compiled data from conifer species is vegetative season. Contrastingly, most conifer species cannot
limited here to the Pinaceae family (Fig. 2), whose hydraulic afford such penalty in terms of carbon loss, as the high invest-
behaviour diverges markedly from that of other families (e.g., ment in needle development compels evergreen trees to maintain
Cupressaceae)44. By contrast, broadleaves tend to close stomata their foliage over several years37. Therefore, night-time replen-
closer to critical thresholds for hydraulic functionality43,45, ishment of internal stem water reserves in broadleaves, reflected
allowing for continued water use and carbon gain under pro- here by a relatively large sub-daily TWD amplitude, denotes
longed periods of atmospheric and soil drought. Thus, broad- partial and transient recovery and relaxation from environmental
leaves disconnect less easily from drying soils and demanding stress. On the other hand, prolonged exposure to tissue dehy-
atmospheres43, which leads to the development of water potential dration and damage during seasonal drought in conifers might
gradients throughout the plant to replenish stem water reserves at contribute to relatively longer and stronger drought legacy effects
night when root water uptake exceeds transpiration loss. Fur- of up to several years observed across forest biomes38,47.
thermore, maintenance of the soil-plant-atmosphere hydraulic Inter-specific comparisons showed that oak stems remained
continuum for transpirational cooling of the leaves under heat relatively hydrated across the hydrometeorological space during
stress46 might be more important for broadleaves, characterized HW2018 (Fig. 4). Similarly, oak trees showed remarkable drought
by thin leaves with a large area per unit of mass exposed to resistance and were able to maintain constant transpiration
NATURE COMMUNICATIONS | (2022)13:28 | https://doi.org/10.1038/s41467-021-27579-9 | www.nature.com/naturecommunications 5ARTICLE NATURE COMMUNICATIONS | https://doi.org/10.1038/s41467-021-27579-9
REW2018 (−)
1.0 0.8 0.6 0.4 0.2 0.0 1.0 0.8 0.6 0.4 0.2 0.0
Fagus sylvatica Quercus spp.
a b
2.0 Database range
Common species range
1.5
Daily min. TWD2018:control
> 2.0
1.0
1.5 − 2.0
1.0 − 1.5
0.5 − 1.0
0.5
< 0.5
VPD2018 (kPa)
0.0
Picea abies Pinus sylvestris
c d e
2.0
Fagus sylvatica
1.5
Picea abies
1.0
Quercus spp.
0.5
Pinus sylvestris
0.0
0 20 40 60 80 100
Response area (%)
Fig. 4 Species-specific response of tree water deficit (TWD) ratio to vapour pressure deficit (VPD) and relative extractable water (REW) in the
hydrometeorological space for most abundant and economically valuable tree species in Europe. a–d, Linear-mixed effect model output of the ratio of
the daily minimum TWD during the 2018 heatwave compared to the 95th percentile of the control period (TWD2018:control), while VPD2018 and REW2018
refer to the absolute values during 2018 heatwave. All trees of Fagus sylvatica, Quercus spp. (Q. robur/petraea), Picea abies and Pinus sylvestris within the
database are considered. From the hydrometeorological space range of the entire database (indicated in grey), models have been adjusted for the common
climatic range of the selected species only (indicated with dotted lines; see Supplementary Fig. 4 for the climate range of each species). e Bars indicate the
percentage of the hydrometeorological space covering different ranges of min. TWD2018:control values (see legend).
throughout the 2003 European heatwave, e.g., in a Swiss mixed (Fig. 4) are consistent with relatively strong drought legacy effects
forest48. Root access to deep soil water might be a crucial factor among Pinaceae species38 and, at larger spatio-temporal scales,
driving the species-specific response to water shortage49, so that with projected shifts in species distribution across Europe27,55.
deep-rooted species (oak) might be able to maintain a better Although there is still substantial uncertainty regarding how
water status than shallow-rooted ones (e.g., Norway spruce)50. inter-specific differences in water economy scale in terms of
Variability in the daily minimum TWD2018:control across the productivity and tree mortality risk, the capacity to maintain
hydrometeorological space might also depend on species-specific minimum levels of tissue hydration for extended dry periods
plasticity of leaf and stomatal physiology to optimise tree water seems to be crucial to determine how different species respond to
use according to site conditions. In addition, the contribution of adverse environments and extreme events in the long term11,12,56.
stem water release to tree transpiration is not necessarily uniform Biophysical responses related to tree water relations likely precede
across species and environmental gradients10,51, and tree any structural adjustment to drought stress, as observed in pine
transpiration could be even decoupled from TWD, as already trees after stopping 11 years lasting irrigation treatment, where
observed among four temperate species49. Other hydraulic traits growth decline lagged behind increases in TWD by several
are likely involved in the complex species-specific response of years37. Similarly, stem shrinkage and near-zero sub-daily TWD
stem water reserves to heatwaves. For instance, we could expect amplitude preceded hydraulic dysfunction and partial or
that tree species with higher stem hydraulic capacitance and less complete canopy dieback in pine and beech trees57,58. We argue
dense wood, and hence a lower Young´s modulus of elasticity, that stem diameter variations might be employed as an early-
would experience larger stem shrinkage and swelling for a given warning signal for long-term reductions in tree productivity
change in xylem tension. Linking our dendrometer findings to evidencing tree decline.
leaf52, root53 and plant-specific hydraulic traits54 would be a
critical next step, yet requires data from more species with
significant trait variability and greater spatial detail. The limited Outlook. Large-scale analyses of dendrometer data are challen-
ability of Norway spruce and Scots pine to maintain minimum ging. Sensor maintenance requires frequent fieldwork, auto-
levels of stem hydration during periods of severe drought stress matised routines for data processing have just recently become
6 NATURE COMMUNICATIONS | (2022)13:28 | https://doi.org/10.1038/s41467-021-27579-9 | www.nature.com/naturecommunicationsNATURE COMMUNICATIONS | https://doi.org/10.1038/s41467-021-27579-9 ARTICLE
available (see Methods), and harmonisation of highly-resolved climatological conditions, including mean annual temperature and mean annual pre-
and long-term records from different dendrometer types further cipitation (Supplementary Table 1), were obtained from CHELSA66 (spatial resolution
1 km). To establish the heatwave timeframe, longer daily time series of the maximum
hinders the compilation of homogeneous global datasets. We daily air temperature were obtained from E-OBS67 (spatial resolution = 0.1°, temporal
believe, however, that dendrometer networks will strengthen as coverage = 1951–2018). Heatwave days were defined as five consecutive days with a
the unparalleled potential of stem diameter variations to capture maximum daily temperature higher than the 90th percentile of the control period
in situ forest productivity and sensitivity to environmental (1951–2000)68,69. The overall heatwave extent was established from DOY 208 until
stresses is broadly recognised. Compilation of large-scale datasets 264, during which period heatwave days overlapped for more than five sites (Sup-
plementary Fig. 1).
of dendrometer data, together with those of tree transpiration59, The dendrometer time series were checked and homogenised using the tree-
open promising research avenues, as tree-level datasets can be netproc R package (version 0.1.4)70. The cleaned dendrometer time series were
spatially coupled with monitoring networks of ecosystem carbon partitioned into growth- and water-related components of stem radius variation
and water fluxes60 and remote-sensing observations. Integration according to the zero-growth concept13. This procedure assumes that growth
(GRO) starts once the previous stem diameter maximum is exceeded and ends as
of tree-, regional-, and global-based data sources will advance soon as the stem starts shrinking. Diameter variations below the preceding max-
knowledge on the mechanisms underlying tree response to cli- imum stem diameter are considered as a period of tree water deficit (TWD), a
mate change and extremes. proxy of stem dehydration and tree drought stress14. In short, TWD is a measure
Our analyses draw attention to the potential of dendrometer for water depletion, mainly in the living bark tissues of the stem, expressed as stem
shrinkage (in µm), which occurs when canopy transpiration exceeds root water
data for use as an early warning system to detect stress thresholds uptake, hence retrieving water from stem water reserves to meet the evaporative
for tree vitality and growth at large spatial scales in situ, and demand. For GRO, daily time series of cumulative annual growth was established.
hence identify areas with a high risk of forest decline and For TWD, daily minimum and maximum time series were established to capture
mortality. We call for a tree-centered approach, with stems as the night-time and day-time water status according to sub-daily fluctuations in the
atmospheric evaporative demand. To isolate the temporal variability in GRO and
main source of information on species- and site-specific TWD in 2018 relative to control years (2016–2017) and facilitate comparison
responses to different stress ellicitors8,60,61. Here, highly- among trees, we estimated tree-specific ratios of GRO and TWD in 2018 divided by
resolved dendrometer time series, mostly covering Central and control years. TWD ratios were estimated extracting daily TWD time series cov-
Atlantic Europe, have shown the overall limited effect of the ering the HW2018 timeframe (DOYs 208-264) for 2018 and control years. Two
HW2018 on current-year volumetric growth, despite the wide- approaches, with different requirements for the minimal extent of the control
period (see below), were applied to analyse the dendrometer time series, con-
spread depletion of stem water reserves during the heatwave sidering annual and daily temporal scales.
period. Carbon investment for canopy development in spring The first approach evaluated the HW2018 impact on GRO and TWD on an
2018 may have yielded a poor photosynthetic return during annual basis (Fig. 2, Supplementary Table 2). Annual cumulative GRO and the
summer, when trees operated close to their dehydration thresh- daily minimum and maximum TWD averaged over the course of the HW2018
timeframe (DOYs 208-264) were estimated per year. Here, solely tree-specific time
olds, resulting in a likely reduction in tree carbon reserves over series with overall appropriate quality and covering 2016–2018 were considered for
the year. Long-term legacy effects due to the depletion of analyses. Only two adjacent years (2016 and 2017) were considered as control years
carbohydrate reserves and damage to the hydraulic system37,38 to minimise time-related changes in tree structure and function, while maximising
during HW2018 will very likely compromise tree growth, available data. Moreover, data before 2016 were excluded to avoid biases due to
different lengths of the time series. Ratios of tree-specific GRO and minimum and
performance, and survival in the coming years62. Furthermore, maximum TWD between 2018 and control years were then calculated and log-
contrasting stem water refilling behaviour between broadleaves transformed (log10[GRO2018:control], log10[min. TWD2018:control] and log10[max.
and conifers links to differences in stomatal regulation24 and TWD2018:control], respectively), which is a standard measure to quantify effect size
hydraulic safety margins43,45 observed between taxonomic clades in meta-analyses71. Before log10 transformation, the unit (1 µm) was added to GRO
to maintain trees with null growth within analyses. To test differences between
and broadens our perspective on tree hydraulic functioning. taxonomic clades (broadleaves and conifers) on log-transformed GRO2018:control
and min. and max. TWD2018:control, linear mixed effect models (lme4 R package,
Methods version 1.1-2172) were fitted considering species and site as crossed random effects.
Tree-specific point and band dendrometer measurements with a temporal reso- Backward stepwise selection was applied, so taxonomic clade was omitted from the
lution of 15–60 min were compiled from 85 monitoring plots across Europe. Plots model if not significant (P > 0.05). Correlation between log-transformed
within a Euclidean distance of 9 km, an elevational difference of less than 300 m, GRO2018:control and min. TWD2018:control was tested likewise. Significance P values
and similar soil water conditions were clustered, resulting in a total of 53 sites were calculated using the R package lmertest (version 3.1-1). Back-transformed
(Supplementary Table 1). For each monitored tree, information on the (i) species, model estimates are reported in the text.
(ii) site location (coordinates in °E and °N), (iii) radius time-series (in µm), (iv) In contrast to the annual values used in the first approach, the second approach
timestamp with recorded time-zone, (v) quality assessment, and (vi) climate was assessed the daily response of minimum and maximum TWD to HW2018
collected. A quality assessment of the radius time series was performed to assist (Figs. 3–4, Tables S3–S4). This analysis was performed to compare the climatic
analyses with specific data-quality requirements (see details below), flagging trees response of broadleaves and conifers along gradients of comparable absolute VPD
with (a) plateauing values during periods longer than seven days (a common issue and REW values experienced during the 2018 heatwave (VPD2018 and REW2018,
of band dendrometer data), and (b) temporal gaps larger than 14 days. respectively). Here, the ratio between the 2018 daily TWD and the 95th percentile
Site-specific meteorological data were compiled to determine the HW2018 of the control years (2016–2017) within the heatwave timeframe was calculated.
timeframe and perform climate-response analyses. For each site, we extracted time The 95th percentile was selected for daily analyses to compare stem shrinkage
series of daily mean atmospheric temperature (Ta in °C) and vapour pressure during HW2018 relative to the nearly maximum experienced during the control
deficit (VPD in kPa), obtained from the nearest climate station (search radius = period. Note that mean values used for annual analyses are more dependent on
80 km) using the Global Surface Summary of the Day (GSOD) Weather Data days with zero TWD and hence more suitable for long-term comparison of both
Client63. Gaps were filled by linear interpolation with in situ measurements (if shrinkage intensity and duration. For the climatic response analysis, linear mixed
available) when the daily time series showed a high correlation (Pearson’s rho > effect models were fitted to predict min. and max. daily TWD2018:control as a
0.7). Site-specific soil moisture data were obtained from the ERA-5 land surface function of daily VPD2018 (using a 2nd order polynomial) and REW2018 (using a
model simulations64 (spatial resolution = 9 km; temporal coverage = 2015–2019; 3rd order polynomial), with tree nested within site, and species as crossed random
Layer 3: 28–100 cm depth). Relative extractable water (REW) was calculated to (intercept) effects. Before the log transformation, 1% of the max. TWD2018:control
account for inter-site differences in soil properties and absolute soil moisture levels was added to maintain zero values within the analyses. Only species present in
and facilitate inter-site comparisons65. REW was calculated by scaling the site- more than one site were considered here. Additionally, similar analyses were
specific daily soil moisture simulations to the field capacity and the site lowest soil separately performed for the four most important forest species of Europe, both in
moisture value according to: terms of spatial distribution and economic importance, within the database: Fagus
sylvatica, Quercus spp. (including Q. robur and Q. petraea), Picea abies, and Pinus
SM j;i SM min;j sylvestris. Moreover, these species were selected due to their appropriate spatial
REW j;i ¼ coverage within the available dataset, both in terms of number of sites and regis-
SM 95th ;j SM min;j
tered gradients of climatic conditions. All species-specific data were considered in
where REWj,i and SMj.i are site (j) and daily (i) values, and SM95th,j and SMmin,j are the species-specific models, even when quality and temporal extent criteria were not
site-specific soil moisture approaching field capacity and minimum values, respectively. entirely satisfied. Less restrictive criteria were adopted here to maximize the size of
The 95th percentile, and not the maximum value, was applied to exclude heavy rain the available datasets, as initial models did not converge due to the low spatial
events that may result in soil water saturation (e.g., Supplementary Fig. 7). Long-term coverage for individual species. The fitted models were back-transformed for
NATURE COMMUNICATIONS | (2022)13:28 | https://doi.org/10.1038/s41467-021-27579-9 | www.nature.com/naturecommunications 7ARTICLE NATURE COMMUNICATIONS | https://doi.org/10.1038/s41467-021-27579-9
calculating the hydrometeorological space covering different levels of min. and 21. Brun, P. et al. Large‐scale early‐wilting response of Central European forests to
max. TWD2018:control. All analyses were performed in the R software (version 3.673). the 2018 extreme drought. Glob. Chang. Biol. 26, 7021–7035 (2020).
22. Ramonet, M. et al. The fingerprint of the summer 2018 drought in Europe on
Reporting summary. Further information on research design is available in the Nature ground-based atmospheric CO2 measurements. Philos. Trans. R. Soc. B Biol.
Research Reporting Summary linked to this article. Sci. 375, 20190513 (2020).
23. Bastos, A. et al. Impacts of extreme summers on European ecosystems: A
comparative analysis of 2003, 2010 and 2018. Philos. Trans. R. Soc. B Biol. Sci.
Data availability 375, 20190507 (2020).
The dendrometer data and the site metadata used in this study are available in the 24. Lin, Y.-S. et al. Optimal stomatal behaviour around the world. Nat. Clim.
Zenodo repository, under accession code https://doi.org/10.5281/zenodo.5711706. Chang. 5, 459–464 (2015).
Site-specific meteorological data were compiled using the Global Surface Summary of 25. Schuldt, B. et al. A first assessment of the impact of the extreme 2018 summer
the Day (GSOD) Weather Data Client (https://joss.theoj.org/papers/10.21105/ drought on Central European forests. Basic Appl. Ecol. 45, 86–103 (2020).
joss.00177). 26. Rita, A. et al. The impact of drought spells on forests depends on site
Site-specific soil moisture data were obtained from the ERA-5 land surface model conditions: The case of 2017 summer heat wave in southern Europe. Glob.
simulations (https://www.ecmwf.int/en/era5-land). Chang. Biol. 26, 851–863 (2020).
Long-term climatological conditions were obtained from CHELSA at a 1 km spatial 27. Hanewinkel, M., Cullmann, D. A., Schelhaas, M.-J., Nabuurs, G.-J. &
resolution 1 km (https://chelsa-climate.org/). Zimmermann, N. E. Climate change may cause severe loss in the economic
value of European forest land. Nat. Clim. Chang. 3, 203–207 (2013).
28. Larysch, E., Stangler, D. F., Nazari, M., Seifert, T. & Kahle, H.-P. Xylem phenology
Code availability and growth response of European beech, silver fir and scots pine along an
The codes generated for data analyses for the current study (R scripts) are available from
elevational gradient during the extreme drought year 2018. Forests 12, 75 (2021).
the corresponding author on reasonable request.
29. Rohner, B., Kumar, S., Liechti, K., Gessler, A. & Ferretti, M. Tree vitality
indicators revealed a rapid response of beech forests to the 2018 drought. Ecol.
Received: 4 June 2021; Accepted: 26 November 2021; Indic. 120, 106903 (2021).
30. Scharnweber, T., Smiljanic, M., Cruz-García, R., Manthey, M. & Wilmking, M.
Tree growth at the end of the 21st century - the extreme years 2018/19 as
template for future growth conditions. Environ. Res. Lett. 15, 074022 (2020).
31. Kowalska, N. et al. Analysis of floodplain forest sensitivity to drought. Philos.
References Trans. R. Soc. B Biol. Sci. 375, 20190518 (2020).
1. Rahmstorf, S. & Coumou, D. Increase of extreme events in a warming world. 32. Zweifel, R. et al. Baumwasserdefizite erreichten im Sommer 2018
Proc. Natl Acad. Sci. 108, 17905–17909 (2011). Höchstwerte–war das aus dem All erkennbar. Schweiz Z. Forstwes. 171,
2. Barriopedro, D., Fischer, E. M., Luterbacher, J., Trigo, R. M. & Garcia-Herrera, 302–305 (2020).
R. The Hot Summer of 2010: Redrawing the temperature record map of 33. Cuny, H. E. et al. Woody biomass production lags stem-girth increase by over
Europe. Science 332, 220–224 (2011). one month in coniferous forests. Nat. Plants 1, 15160 (2015).
3. Fischer, E. M. & Knutti, R. Detection of spatially aggregated changes in 34. D’Orangeville, L. et al. Drought timing and local climate determine the
temperature and precipitation extremes. Geophys. Res. Lett. 41, 547–554 (2014). sensitivity of eastern temperate forests to drought. Glob. Chang. Biol. 24,
4. Della-Marta, P. M., Haylock, M. R., Luterbacher, J. & Wanner, H. Doubled 2339–2351 (2018).
length of western European summer heat waves since 1880. J. Geophys. Res. 35. Delpierre, N., Berveiller, D., Granda, E. & Dufrêne, E. Wood phenology, not
112, D15103 (2007). carbon input, controls the interannual variability of wood growth in a
5. Zscheischler, J. et al. Future climate risk from compound events. Nat. Clim. temperate oak forest. N. Phytol. 210, 459–470 (2016).
Chang. 8, 469–477 (2018). 36. Babst, F. et al. Above-ground woody carbon sequestration measured from tree
6. Teskey, R. et al. Responses of tree species to heat waves and extreme heat rings is coherent with net ecosystem productivity at five eddy-covariance sites.
events. Plant, Cell Environ. 38, 1699–1712 (2015). N. Phytol. 201, 1289–1303 (2014).
7. Ciais, P. et al. Europe-wide reduction in primary productivity caused by the 37. Zweifel, R. et al. Determinants of legacy effects in pine trees – implications
heat and drought in 2003. Nature 437, 529–533 (2005). from an irrigation‐stop experiment. N. Phytol. 227, 1081–1096 (2020).
8. Steppe, K., Sterck, F. & Deslauriers, A. Diel growth dynamics in tree stems: 38. Anderegg, W. R. L. et al. Pervasive drought legacies in forest ecosystems and
linking anatomy and ecophysiology. Trends Plant Sci. 20, 335–343 (2015). their implications for carbon cycle models. Science 349, 528–532 (2015).
9. Peters, R. L. et al. Turgor—a limiting factor for radial growth in mature 39. Zweifel, R., Zimmermann, L. & Newbery, D. M. Modeling tree water deficit
conifers along an elevational gradient. N. Phytol. 229, 213–229 (2021). from microclimate: An approach to quantifying drought stress. Tree Physiol.
10. Meinzer, F. C., Johnson, D. M., Lachenbruch, B., McCulloh, K. A. & 25, 147–156 (2005).
Woodruff, D. R. Xylem hydraulic safety margins in woody plants: 40. Gleason, S. M. et al. Weak tradeoff between xylem safety and xylem-specific
Coordination of stomatal control of xylem tension with hydraulic capacitance. hydraulic efficiency across the world’s woody plant species. N. Phytol. 209,
Funct. Ecol. 23, 922–930 (2009). 123–136 (2016).
11. Anderegg, W. R. L., Berry, J. A. & Field, C. B. Linking definitions, 41. Duursma, R. A. et al. On the minimum leaf conductance: its role in models of
mechanisms, and modeling of drought-induced tree death. Trends Plant Sci. plant water use, and ecological and environmental controls. N. Phytol. 221,
17, 693–700 (2012). 693–705 (2019).
12. Martínez‐Vilalta, J., Anderegg, W. R. L., Sapes, G. & Sala, A. Greater focus on 42. Poyatos, R., Aguadé, D. & Martínez-Vilalta, J. Below-ground hydraulic constraints
water pools may improve our ability to understand and anticipate drought‐ during drought-induced decline in Scots pine. Ann. Sci. 75, 100 (2018).
induced mortality in plants. N. Phytol. 223, 22–32 (2019). 43. Johnson, D. M., McCulloh, K. A., Woodruff, D. R. & Meinzer, F. C. Hydraulic
13. Zweifel, R., Haeni, M., Buchmann, N. & Eugster, W. Are trees able to grow in safety margins and embolism reversal in stems and leaves: Why are conifers
periods of stem shrinkage? N. Phytol. 211, 839–849 (2016). and angiosperms so different? Plant Sci. 195, 48–53 (2012).
14. Dietrich, L., Zweifel, R. & Kahmen, A. Daily stem diameter variations can 44. Brodribb, T. J., McAdam, S. A. M., Jordan, G. J. & Martins, S. C. V. Conifer
predict the canopy water status of mature temperate trees. Tree Physiol. 38, species adapt to low-rainfall climates by following one of two divergent
941–952 (2018). pathways. Proc. Natl Acad. Sci. U.S.A 111, 14489–14493 (2014).
15. Zweifel, R. et al. Why trees grow at night. N. Phytol. 231, 2174–2185 (2021). 45. Choat, B. et al. Global convergence in the vulnerability of forests to drought.
16. Buras, A., Rammig, A. & Zang, C. S. Quantifying impacts of the 2018 drought Nature 491, 752–755 (2012).
on European ecosystems in comparison to 2003. Biogeosciences 17, 1655–1672 46. Drake, J. E. et al. Trees tolerate an extreme heatwave via sustained
(2020). transpirational cooling and increased leaf thermal tolerance. Glob. Chang. Biol.
17. Bastos, A. et al. Direct and seasonal legacy effects of the 2018 heat wave and 24, 2390–2402 (2018).
drought on European ecosystem productivity. Sci. Adv. 6, eaba2724 (2020). 47. Anderegg, W. R. L., Trugman, A. T., Badgley, G., Konings, A. G. & Shaw, J.
18. Peters, W., Bastos, A., Ciais, P. & Vermeulen, A. A historical, geographical, Divergent forest sensitivity to repeated extreme droughts. Nat. Clim. Chang.
and ecological perspective on the 2018 European summer drought. Philos. 10, 1091–1095 (2020).
Trans. R. Soc. B Biol. Sci. 375, 20190505 (2020). 48. Leuzinger, S., Zotz, G., Asshoff, R. & Korner, C. Responses of deciduous forest
19. Albergel, C. et al. Monitoring and Forecasting the Impact of the 2018 Summer trees to severe drought in Central Europe. Tree Physiol. 25, 641–650 (2005).
Heatwave on Vegetation. Remote Sens. 11, 520 (2019). 49. Brinkmann, N., Eugster, W., Zweifel, R., Buchmann, N. & Kahmen, A.
20. Smith, N. E. et al. Spring enhancement and summer reduction in carbon Temperate tree species show identical response in tree water deficit but
uptake during the 2018 drought in northwestern. Eur. Philos. Trans. R. Soc. B different sensitivities in sap flow to summer soil drying. Tree Physiol. 36,
Biol. Sci. 375, 20190509 (2020). 1508–1519 (2016).
8 NATURE COMMUNICATIONS | (2022)13:28 | https://doi.org/10.1038/s41467-021-27579-9 | www.nature.com/naturecommunicationsNATURE COMMUNICATIONS | https://doi.org/10.1038/s41467-021-27579-9 ARTICLE
50. Rosengren, U. et al. Functional biodiversity aspects on the nutrient RTI2018-095297-J-I00 (Spain) and by a Humboldt Research Fellowship for Experienced
sustainability in forests-Importance of root distribution. J. Sustain. 21, 77–100 Researchers (Germany). F.B acknowledges funding from the HOMING project “Inside
(2006). out” (#POIR.04.04.00-00-5F85/18-00) by the Foundation for Polish Science under the
51. Salomón, R. L., Limousin, J.-M., Ourcival, J.-M., Rodríguez-Calcerrada, J. & European Regional Development Fund. G.J.N. acknowledges funding from the forest-
Steppe, K. Stem hydraulic capacitance decreases with drought stress: climate pilots of the Netherlands funded by Ministry of Agriculture, Nature Management
implications for modelling tree hydraulics in the Mediterranean oak Quercus and Food Quality, the H2020 project VERIFY (776810). M.L. and A.I.S. acknowledge
ilex. Plant. Cell Environ. 40, 1379–1391 (2017). funding from the German Federal Ministry of Food and Agriculture (BMEL; project
52. Mencuccini, M. et al. Leaf economics and plant hydraulics drive leaf: wood SURE; Forst-2017-2). E.C. acknowledges funding from SustES, Adaptation strategies for
area ratios. N. Phytol. 224, 1544–1556 (2019). sustainable ecosystem services and food security under adverse environmental conditions
53. Guerrero-Ramírez, N. R. et al. Global root traits (GRooT). Database Glob. (CZ.02.1.01/0.0/0.0/16_019/0000797). S.M. acknowledges funding from the “Austrian
Ecol. Biogeogr. 30, 25–37 (2021). Science Fund” (FWF, project P29896-B22). N.D. acknowledges funding from the
54. Kattge, J. et al. TRY plant trait database—enhanced coverage and open access. SACROBOQUE project (GIP-ECOFOR, grant #2016.013) and the FOREPRO project
Glob. Chang. Biol. 26, 119–188 (2020). (ANR-19-CE32-0008). J.K. acknowledges funding from the Ministry of Education, Youth
55. van der Maaten, E. et al. Species distribution models predict temporal but not and Sports of CR (CzeCOS program, grant number LM2018123). W.O. acknowledges
spatial variation in forest growth. Ecol. Evol. 7, 2585–2594 (2017). funding from the Austrian Science Fund (FWF, projects P22280-B16, P25643-B16).
56. Körner, C. No need for pipes when the well is dry—a comment on hydraulic C.B.K.R acknowledges funding from the French National Research Agency (ANR) as
failure in trees. Tree Physiol. 39, 695–700 (2019). part of the “Investissements d’Avenir” program (ANR-11-LABX-0002-01, Lab of
57. Walthert, L. et al. From the comfort zone to crown dieback: Sequence of Excellence ARBRE). B.T., B.O and M.S acknowledge funding from ‘HEA, PRTLI (Cycle
physiological stress thresholds in mature European beech trees across 5) infrastructure award’. J.U. acknowledges funding from Czech Science Foundation,
progressive drought. Sci. Total Environ. 753, 141792 (2021). project 21–11487 S. M.V. acknowledges funding by the Ministry of agriculture of the
58. Preisler, Y., Tatarinov, F., Grünzweig, J. M. & Yakir, D. Seeking the “point of Czech Republic, institutional support MZE-RO0118. L.K and K.S. acknowledge funding
no return” in the sequence of events leading to mortality of mature trees. from the Project LIFE + ForBioSensing PL (LIFE13 ENV/PL/000048) and Poland’s
Plant. Cell Environ. 44, 1315–1328 (2021). National Fund for Environmental Protection and Water Management (contract 485/
59. Poyatos, R. et al. Global transpiration data from sap flow measurements: The 2014/WN10/OP-NM-LF/D). N.O. acknowledges funding from the LTSER platform
SAPFLUXNET database. Earth Syst. Sci. Data 13, 2607–2649 (2021). LTER_EU_IT_097—Val Mazia/Matschertal (Province of Bozen/Bolzano—South Tyrol).
60. Steppe, K., von der Crone, J. S. & De Pauw, D. J. W. TreeWatch.net: A water J.B. acknowledges funding from the LOEWE priority program Nature 4.0 (UM2; Hessian
and carbon monitoring and modeling network to assess instant tree hydraulics State Ministry for Higher Education, Research and the Arts, Germany). M.S. acknowl-
and carbon status. Front. Plant Sci. 7, 993 (2016). edges funding from the Ministry of Education, Youth and Sports of CR within the
61. Sass-Klaassen, U. et al. A tree-centered approach to assess impacts of extreme CzeCOS program (grant number LM2018123). K.S. and R.L.S acknowledge the con-
climatic events on forests. Front. Plant Sci. 7, 1–6 (2016). tribution of Jonas von der Crone. N.D. acknowledges maintenance of micro-
62. Cailleret, M. et al. A synthesis of radial growth patterns preceding tree dendrometers by Jean-Marc Louvet, Sophie Lorentz, and French National Forestry Office
mortality. Glob. Chang. Biol. 23, 1675–1690 (2017). (ONF) technicians.
63. Sparks, A. H., Hengl, T. & Nelson, A. GSODR: Global summary daily weather
data in R. J. Open Source Softw. 2, 177 (2017).
64. Muñoz-Sabater, J. et al. ERA5-Land: An improved version of the ERA5 Author contributions
The initial concept of DenDrought2018 was conceived by USK, PF, KS, and ML. AIS and
reanalysis land component. in Joint ISWG and LSA-SAF Workshop IPMA.
MS built the database, with the contribution of GvA, RP, FB, RLP, and RZ. RLS and RLP
26–28 (2018).
performed the analyses and drafted the first and final version of the paper, in close
65. Granier, A. et al. Evidence for soil water control on carbon and water
collaboration with RZ, USK, and KS AIS, MS, RP, FB, EC, PF, BL, ML, JMV, MM, GJN,
dynamics in European forests during the extremely dry year: 2003. Agric.
EvM, and GvA contributed to the analyses and the preparation of the paper. The rest of
Meteorol. 143, 123–145 (2007).
the coauthors contributed data to the dataset and read and commented on the paper.
66. Karger, D. N. et al. Climatologies at high resolution for the earth’s land surface
areas. Sci. Data 4, 170122 (2017).
67. Cornes, R. C., van der Schrier, G., van den Besselaar, E. J. M. & Jones, P. D. An Competing interests
ensemble version of the E-OBS temperature and precipitation data sets. J. The authors declare no competing interests.
Geophys. Res. Atmos. 123, 9391–9409 (2018).
68. Frich, P. et al. Observed coherent changes in climatic extremes during the
second half of the twentieth century. Clim. Res. 19, 193–212 (2002). Additional information
69. Alexander, L. V. et al. Global observed changes in daily climate extremes of Supplementary information The online version contains supplementary material
temperature and precipitation. J. Geophys. Res. Atmos. 111, 1–22 (2006). available at https://doi.org/10.1038/s41467-021-27579-9.
70. Knüsel, S., Peters, R. L., Haeni, M., Wilhelm, M. & Zweifel, R. Processing and
extraction of seasonal tree physiological parameters from stem radius time Correspondence and requests for materials should be addressed to Ute G. W. Sass-
series. Forests 12, 765 (2021). Klaassen or Kathy Steppe.
71. Hedges, L. V., Gurevitch, J. & Curtis, P. S. The meta-analysis of response ratios
in experimental ecology. Ecology 80, 1150–1156 (1999). Peer review information Nature Communications thanks the anonymous reviewer(s) for
72. Bates, D., Mächler, M., Bolker, B. & Walker, S. Fitting linear mixed-effects their contribution to the peer review of this work. Peer reviewer reports are available.
models using lme4. J. Stat. Softw. 67, 1–48 (2015).
73. R. Core Team. R: A language and environment for statistical computing. R Reprints and permission information is available at http://www.nature.com/reprints
Foundation for Statistical Computing. (2019).
Publisher’s note Springer Nature remains neutral with regard to jurisdictional claims in
published maps and institutional affiliations.
Acknowledgements
This work utilised the network of dendrometer observations established by the COST
Action network STReESS (grant FP1106). We acknowledge the involved networks Open Access This article is licensed under a Creative Commons
TreeNet, Swiss Long-term Forest Ecosystem Research Programme LWF, French National Attribution 4.0 International License, which permits use, sharing,
Network for Long-term FOrest ECOsystem Monitoring RENECOFOR, the German adaptation, distribution and reproduction in any medium or format, as long as you give
Long Term Ecosystem Research Network LTER-D, the Italian Long Term Ecosystem appropriate credit to the original author(s) and the source, provide a link to the Creative
Research Network ILTER, the Integrated Carbon Observation System ICOS and Tree- Commons license, and indicate if changes were made. The images or other third party
Watch.net. R.L.S. acknowledges funding from the Special Research Fund (BOF) of Ghent material in this article are included in the article’s Creative Commons license, unless
University for Postdoctoral Fellowships and the Spanish Ministry of Science, Innovation, indicated otherwise in a credit line to the material. If material is not included in the
and Universities (Juan de la Cierva Programme, grant IJC2018-036123-I). R.L.P., R.Z., article’s Creative Commons license and your intended use is not permitted by statutory
P.F., and G.v.A. acknowledge funding from the Federal Office for the Environment regulation or exceeds the permitted use, you will need to obtain permission directly from
FOEN (00.0365.PZ I 0427-0562, 09.0064.PJ/R301-0223; project treenet.info) and the the copyright holder. To view a copy of this license, visit http://creativecommons.org/
Swiss National Science Foundation SNF (20FI21_148992, 20FI_173691, P2BSP3_184475; licenses/by/4.0/.
project LOTFOR 150205 and Grant 20FI20_173691; project ICOS-CH). J.M.V. and
M.M. acknowledge funding from the Spanish MINECO via competitive grants CGL2013-
46808-R and CGL2017-89149-C2-1-R. R.P. acknowledges funding from the grant © The Author(s) 2022
NATURE COMMUNICATIONS | (2022)13:28 | https://doi.org/10.1038/s41467-021-27579-9 | www.nature.com/naturecommunications 9You can also read