Tenneco Acquisition of Federal-Mogul - Unlocking Shareholder Value Through Realignment and Separation - Investors

Page created by Christopher Klein
 
CONTINUE READING
Tenneco Acquisition of Federal-Mogul - Unlocking Shareholder Value Through Realignment and Separation - Investors
Tenneco Acquisition of Federal-Mogul
Unlocking Shareholder Value Through Realignment and Separation

April 2018                                          NYSE: TEN
Tenneco Acquisition of Federal-Mogul - Unlocking Shareholder Value Through Realignment and Separation - Investors
Safe Harbor
Forward-Looking Statements
This communication contains forward-looking statements. These forward-looking statements include, but are not limited to, (i) all statements, other than
statements of historical fact, included in this communication that address activities, events or developments that we expect or anticipate will or may occur in the
future or that depend on future events and (ii) statements about our future business plans and strategy and other statements that describe the Company’s
outlook, objectives, plans, intentions or goals, and any discussion of future operating or financial performance. These forward-looking statements are included in
various sections of this communication and the words “may,” “will,” “believe,” “should,” “could,” “plan,” “expect,” “anticipate,” “estimate,” and similar
expressions (and variations thereof) are intended to identify forward-looking statements. Forward-looking statements included in this communication concern,
among other things, the proposed acquisition of Federal-Mogul LLC, including the expected timing of completion of the proposed acquisition and related
transactions; the benefits of the proposed acquisition; the combined company’s plans, objectives and expectations; future financial and operating results; and
other statements that are not historical facts. Forward-looking statements are subject to a number of risks and uncertainties that could cause actual results to
materially differ from those described in the forward-looking statements, including the risk that the transaction may not be completed in a timely manner or at all
due to a failure to satisfy certain closing conditions, including any stockholder or regulatory approvals or the failure to satisfy other conditions to completion of
the transaction; the occurrence of any event, change or other circumstance that could give rise to the termination of the Merger Agreement; the outcome of any
legal proceeding that may be instituted against the Company and others following the announcement of the transaction; the combined company may not
complete a spin off of the Aftermarket and Ride Performance business from the Powertrain Technology business (or achieve some or all of the anticipated
benefits of such a spin-off); the proposed transaction may have an adverse impact on existing arrangements with the Company, including those related to
transition, manufacturing and supply services and tax matters; the amount of the costs, fees, expenses and charges related to the transaction may be greater
than expected; the ability to retain and hire key personnel and maintain relationships with customers, suppliers or other business partners; the risk that the
benefits of the transaction, including synergies, may not be fully realized or may take longer to realize than expected; the risk that the transaction may not
advance the combined company’s business strategy; the risk that the combined company may experience difficulty integrating all employees or operations; the
potential diversion of the Company’s management’s attention resulting from the proposed transaction; as well as the risk factors and cautionary statements
included in the Company’s periodic and current reports (Forms 10-K, 10-Q and 8-K) filed from time to time with the SEC. Given these risks and uncertainties,
investors should not place undue reliance on forward-looking statements as a prediction of actual results. Unless otherwise indicated in this report, the forward-
looking statements in this communication are made as of the date of this communication, and, except as required by law, the Company does not undertake any
obligation, and disclaims any obligation, to publicly disclose revisions or updates to any forward-looking statements.
                                                                                                                                                                        2
Tenneco Acquisition of Federal-Mogul - Unlocking Shareholder Value Through Realignment and Separation - Investors
Safe Harbor

Additional Information and Where to Find It
In connection with the proposed transaction between Tenneco Inc. (the “Company”) and Federal-Mogul LLC, the Company intends to file relevant materials with the U.S.
Securities and Exchange Commission (the “SEC”), including a preliminary proxy statement on Schedule 14A. Following the filing of the definitive proxy statement with the
SEC, the Company will mail the definitive proxy statement and a proxy card to each stockholder entitled to vote at the special meeting relating to the proposed transaction.
This communication is not a substitute for the proxy statement or other document(s) that the Company may file with the SEC in connection with the proposed transaction.
INVESTORS AND SECURITY HOLDERS OF THE COMPANY ARE URGED TO READ CAREFULLY THE PROXY STATEMENT (INCLUDING ANY AMENDMENTS OR SUPPLEMENTS
THERETO) AND OTHER DOCUMENTS FILED WITH THE SEC WHEN THEY BECOME AVAILABLE BECAUSE THEY WILL CONTAIN IMPORTANT INFORMATION ABOUT THE
COMPANY, FEDERAL-MOGUL AND THE PROPOSED TRANSACTION. Investors and security holders may obtain free copies of the proxy statement and other relevant materials
(when they become available), and any and all documents filed by the Company with the SEC may be obtained for free at the SEC’s website at www.sec.gov. In addition,
stockholders may obtain free copies of the documents filed with the SEC by the Company via the Company’s Investor Relations section of its website at
investors.tenneco.com or by contacting Investor Relations by directing a request to the Company, Attention: Investor Relations, 500 North Field Drive in Lake Forest, Illinois
60045 or by calling (847) 482-5162.

Certain Information Regarding Participants
The Company and its respective directors and executive officers may be deemed participants in the solicitation of proxies in connection with the proposed transaction.
Information about the persons who may, under the rules of the SEC, be considered to be participants in the solicitation of the Company’s stockholders in connection with
the proposed transaction, and any interest they have in the proposed transaction, will be set forth in the definitive proxy statement when it is filed with the SEC. Additional
information regarding these individuals is set forth in the Company’s proxy statement for its 2018 Annual Meeting of Stockholders, which was filed with the SEC on April 4,
2018, and its Annual Report on Form 10-K for the fiscal year ended December 31, 2017, which was filed with the SEC on February 28, 2018. You may obtain these
documents (when they become available) free of charge at the SEC’s web site at www.sec.gov and from Investor Relations at the Company.

No Offers or Solicitations
This document shall not constitute an offer to sell or the solicitation of an offer to buy any securities, nor shall there be any sale of securities in any jurisdiction in which such
offer, solicitation or sale would be unlawful prior to registration or qualification under the securities laws of any such jurisdiction. No offering of securities shall be made
except by means of a prospectus meeting the requirements of Section 10 of the U.S. Securities Act of 1933, as amended.

                                                                                                                                                                                         3
Tenneco Acquisition of Federal-Mogul - Unlocking Shareholder Value Through Realignment and Separation - Investors
Transaction Unlocks Significant Value

                                         announces acquisition of

     Acquisition expected to close in second half of 2018; separation expected to be complete in second half of 2019

                                                       This acquisition builds on Tenneco’s long-term strategy:
                                                        • Positions us to realign and then separate Tenneco’s and
                                                          Federal-Mogul’s lines of business, allowing them to be
                                                          managed according to their unique value propositions
                                                        • Enhances our ability to serve customers in both lines
                                                        • Opens up new opportunities to drive growth with products that
                                                          are complementary to Tenneco’s current product offering
                                                        • Building upon the strength, depth and industry experience of
                                                          the combined teams
                                                        • Significant synergies will drive shareholder value

  Focused strategic objectives – moving faster and further to unlock value
                                                                                                                          4
Tenneco Acquisition of Federal-Mogul - Unlocking Shareholder Value Through Realignment and Separation - Investors
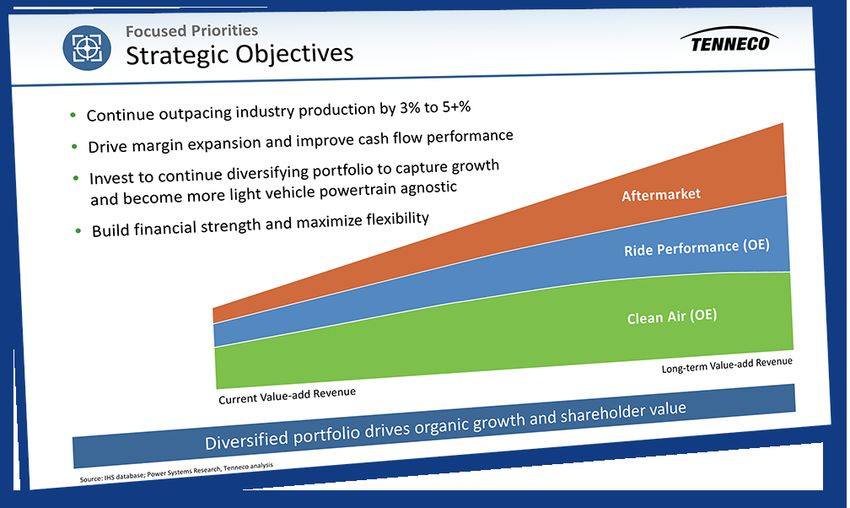
Federal-Mogul Overview

             Federal-Mogul                                      Revenue by Segment

                                                                                                  Motorparts
                                                          Motorparts
                  2017                                      42%
                                                                                                  • Over 20 strong market-leading brands in the
              Revenue: $7.8B                                                                        global vehicle aftermarket
              EBITDA: $753M                                                                       • Sells and distributes a broad portfolio of
                                                                                 Powertrain         aftermarket products globally
                                                                                   58%
                                                                                                  • Strong market position in OE braking
                                                                                                  • Operates 33 manufacturing sites in 15 countries
                                                                                                    and 33 distribution centers in 12 countries
     Revenue by Geography*                                   Revenue by End Market
            APAC
            15%
                                                                Industrial 10%                    Powertrain
                                                           CTOH 11%                               • One of the world’s leading powertrain
                                                                                                    component and assembly providers
                                               North                                              • Market leading positions across product
                                              America
                                                44%                               Light Vehicle     categories
                                                        Aftermarket                   49%
     EMEA                                                   30%                                   • Operates 87 manufacturing sites in 19 countries
      41%

                         Federal-Mogul is a leading global supplier to OEMs and the aftermarket
* APAC includes Federal-Mogul South America
                                                                                                                                                      5
Tenneco Acquisition of Federal-Mogul - Unlocking Shareholder Value Through Realignment and Separation - Investors
Creating Two Focused Companies
                          Transformational acquisition of Federal-Mogul and planned separation into
                                  two focused, industry-leading, publicly traded companies
           • Definitive agreement to acquire Federal-Mogul’s Motorparts and Powertrain businesses for $5.4B (EV/2017 EBITDA 7.2x / 5.4x with synergies)
           • Intention to create two independent, publicly traded companies
           • Value accretive with total annual run-rate earnings synergies of at least $200M and one time working capital synergies of at least $250M
             expected within 24 months after closing
                                                                                                                             2017 PRO FORMA REVENUE
                                                    Current State                                            Post Acquisition                            Post Separation

                                    $ Billions                                                               $17.1 (VA $14.9)
                                                                                                                                                      Separation expected
                                                                                                                    RP                                in second half 2019

                                                                                                                Motorparts
                                                                                                                                                                   $10.7 (VA $8.5)
                                     $9.3 (VA $7.1)
Tenneco 2017 Revenues                                               $7.8                                        Powertrain                                            Powertrain
  Clean Air (CA): $6.2B 1                   RP                                                                                                    $6.4
  Ride Performance (RP): $3.1B 1
                                                                Motorparts
Federal-Mogul 2017 Revenues                                                                                                                        RP
  Powertrain: $4.5B
                                            CA                                                                      CA                                                     CA
  Motorparts: $3.3B                                              Powertrain
                                                                                                                                               Motorparts

                                          Tenneco
                                           Tiger                Federal-Mogul
                                                                   Falcon                                    Tenneco CombinedCo
                                                                                                                CombinedCo                AM &AM
                                                                                                                                               Ride/ Performance
                                                                                                                                                     Chassis       Powertrain
                                                                                                                                                                    PowertrainTechnology
                                                                                                                                                                                Tech

                                        Realignment and separation to unlock significant shareholder value
        1. The Clean Air Aftermarket business is intended to be allocated to the Ride Performance business
                                                                                                                                                                                           6
Tenneco Acquisition of Federal-Mogul - Unlocking Shareholder Value Through Realignment and Separation - Investors
Unique Strategic Combination

    Aftermarket & Ride Performance Company                            Powertrain Technology Company

     RIDE PERFORMANCE                                                CLEAN AIR

         One of the world’s leading multi-line                         One of the largest global pure play
            aftermarket and OE suppliers                                       powertrain suppliers
• Premier aftermarket brands, broad product coverage         • Portfolio of engine-to-tailpipe products and system
  and strong distribution                                      solutions
• Strong portfolio of OE braking and advanced                • Excellent position to capture content growth from:
  suspension technologies and capabilities                      1. Demand for improved engine performance
                                                                2. Tightening fuel economy and criteria pollutant
• Outstanding strategic position to                                regulations
   1. Improve go-to-market capabilities in Americas & EMEA      3. Light vehicle hybridization trends
   2. Capture Asia Pacific aftermarket growth with a broad      4. Commercial truck and off-highway expansion
      range of products                                            opportunities
   3. Capitalize on new OE trends in mobility and            • Well positioned to further build out the product
      electrification / autonomous driving                     portfolio in an evolving powertrain market

Creates two strong businesses with scale and strategic and financial flexibility to drive long-term value creation
                                                                                                                     7
Transformational Step –
   Compelling Strategic Rationale
                                                                   AM & RP   PT

Strategically positions each company                                        
Increases scale and broadens portfolio for respective markets               
Enhances capabilities to capture growth with focused investments            
Significant synergy potential in both new companies                         
Provides investors with distinct investment opportunities                   
      Extends existing strategy and accelerates long-term value creation
                                                                                  8
Aftermarket & Ride Performance Company

        One of the largest global multi-line aftermarket suppliers, with an
  outstanding strategic position to capture Asia Pacific aftermarket growth with
   a broad range of products. Strong systems capabilities will capitalize on OE
         market trends in mobility, electrification/autonomous driving.

                       Revenue by Geography*                                                    Revenue by Product                                  Revenue by Customer
 PRO FORMA                                                                                                                                                   Volkswagen 7%
                       APAC 12%                                                        Motorparts (OE)
2017 REVENUE                                                                                                                                                         AAP / Carquest 6%
                                                                                            15%
    $6.4B                                                                                                                                                                 NAPA / Alliance 6%
                                                                                                                          Motorparts (AM)
                                                           North                                                               37%                                          Ford 5%
                                                          America
                                                            51%                                                                             Other                           O’Reilly 5%
                   EMEA                                                                                                                     56%
                    37%                                                   Ride Performance (OE)                                                                            General Motors 5%
                                                                                   28%
                                                                                                                                                                         Pep Boys / Auto Plus 3%
                                                                                                                                                                      The Group 3%
                                                                                                                                                                   Daimler 2%
                                                                                                Clean Air (AM)   Ride Performance (AM)                        FCA 2%
                                                                                                     5%                   15%
                  Leading positions in established
                    markets – Americas & EMEA                                                        57% aftermarket                        Very diversified customer base
               * EMEA includes Tenneco South America and APAC includes Federal-Mogul South America                                                                                                 9
Aftermarket & Ride Performance – Scale

                                                                      Top Global AM Supplier                                                                                                         Benefits of Scale
                                                                 Aftermarket 2017 Revenues, Global ($B)

   6
        ~6                                                                                                                                                                             • Broad product portfolio enables differentiated
                                              5.6
                                                                                                                                                                                         customer and channel support
                                                                                                                                                                                       • Cross-category sales incentives with retailers and
                                                                3.7
   4
                                                                                                                                                                                         warehouse distributors
       Includes services, diagnostics, etc.

                                                                       3.6

                                                                                             2.3                                                                                       • Scale to support investments in digital and China,
   2                                                                                                         1.8
                                                                                                                         1.5
                                                                                                                                                                                         and focused AM branding/marketing capabilities
                                                                                                                                  1.3
                                              Batteries only

                                                                                                                                             1.2   1.1   1.0   1.0            0.9      • Rationalization of distribution networks for
                                                                                                                                                                                         improved service at lower cost
   0

                                                                                                                                                                                       • Best practice sharing in go-to-market,
                                                                                                                                     Tiger

                                                                                                                                                   SMP
                                                                                             Federal-Mogul
       Bosch (est.)

                                                                                                                                                         SKF

                                                                                                                                                                              Dorman
                                                                ZF

                                                                                                             Valvoline
                                              JCI

                                                                                                                         Mahler

                                                                                                                                             KYB
                                                                       AM/Ride Performance

                                                                                                                                                               Delphi Tech.
                                                                                                                                  Tenneco

                                                                                                                                                                                         manufacturing and distribution

                                                               Leading global multi-line aftermarket supplier with a broad product portfolio
Source: Company estimates
                                                                                                                                                                                                                                              10
Stronger Together – Expanded Aftermarket
               and Ride Performance Product Offering
    Tenneco Ride Performance                                                                          Federal-Mogul Motorparts
                                                                         1   3
                                                                                      3               1                               2
                                                                         1   2            4
1                                                                                5
                                                                                      6
                                                                                                              Chassis                        Brake pads
                                                                             2                1   3                                           & Rotors
     Suspension Systems                                              2                                3
                                                1   3                                         1   2                                   4

                          3                     1   2
                                                                                                          Engine (Pistons,                    Sealing &
2                                           2                                                             Bearings, Valves)                    Gaskets
                              Elastomers
                                                                                                      5                               6
                                                                 1   3
     Exhaust Systems                                             1   2                                        Ignition                       Underhood
                                                                                                                         Not shown: wipers    Service

              Key Brands                                Legend                                                      Key Brands
                                                           Tenneco Ride Performance
                                                           Federal-Mogul Motorparts

                          Extensive portfolio of leading global and regional aftermarket brands
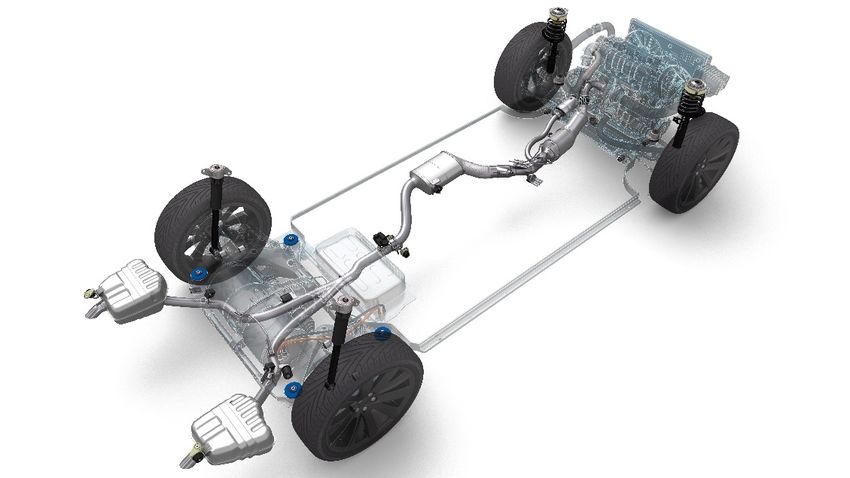
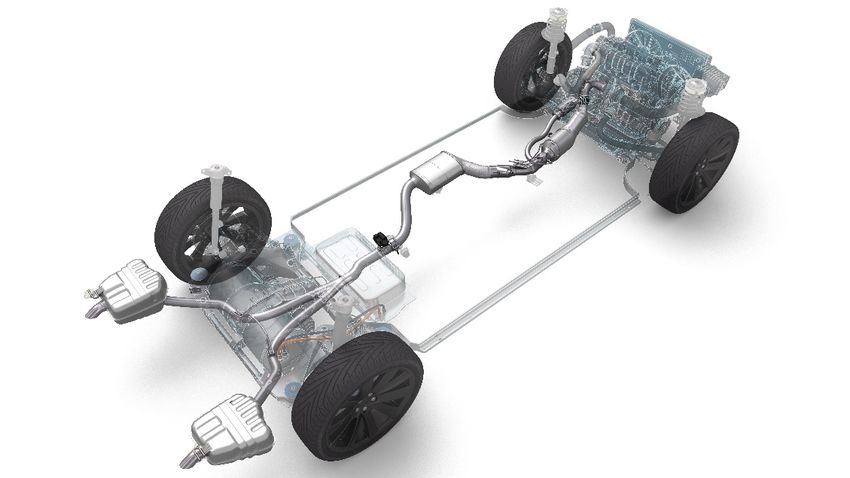
                                                                                                                                                          11
Aftermarket & Ride Performance
                 Complete “Around the Wheel” Offering…

                                                      Comprehensive ride performance product portfolio

                                                                                                                          Upper control arm
                                                                    Strut top mount

                                                                                                                                           Ball joint

      Leader in shocks,                                              Strut assembly
                                                                                                                                                                                Leader in steering,
         struts and                                                                                                                                                              suspension and
      NVH/elastomers                                                                                                                   Hub assembly                                  braking
                                                                       Inner and outer tie rods

   Focused on OE/AM,                                                                                                                                                              Focused on
       including the                                                                                                                                                            AM (Chassis) and
        OE-focused                                                                                                                                                              OE/AM (Braking)
  intelligent suspension                                 Dampers
                                                         (not shown)
          portfolio                                                                                                                                                Brake pads

                                                            Bushings

                                                                                               Linkages               Lower control arm             Brake rotors

                        Strengthens market position in both Aftermarket and Original Equipment
Note: AM brands represented here; however, OE offerings are typically branded "Tenneco" or “Federal-Mogul" for respective components
Source: Company websites                                                                                                                                                                              12
Aftermarket & Ride Performance
    ...Providing a Platform to Capture Growth in AV Trends and Ride Differentiation

                      The future of mobility is being re‐engineered

                                                                          Physical
                                                    Vehicle Systems       Infrastructure
                                                    Chassis               Roads and Highways
                                        T
                                                    Interior              Vehicle to
                                        O           Control Systems       Infrastructure
T
                                        M                                 Energy
O
                                        O
D
                                        R
A
                                        R
Y                                                   Vision and
                                        O           Sensing               Connected
                                        W           Road Detection        5G
                                                    Sensor Fusion         Vehicle to Vehicle
                                                    ADAS System           Cybersecurity
                                                    AR/VR                 Over the air

               Intelligent Suspension: Reinventing the Ride of the Future
                                                                                               13
Aftermarket & Ride Performance
               Well Positioned to Win in All Markets

                  Well-positioned to win in China                                                     Accelerating move into digital

• Combined strong “house of brands” will capture                                          • Online channel is reshaping how AM parts are sold
  growth in China
                                                                                          • New standards emerging for quality and customer
       ‒ Shared investments in salesforce & distribution                                    experience in digital B2B & B2C
       ‒ Combined brand power & OE pedigree
                                                                                          • Scales investments and channel coverage to influence
       ‒ Product line & coverage                                                            consumer’s purchase process starting from online
       ‒ Wear and tear products (e.g. brake pads, ignition)                                 research
         can provide earlier entry into market
                                                                                          • Enhances opportunity to optimize order to delivery
                          Global Vehicles in Operation                                      cycle time and working capital requirements
                                     (Billions of vehicles)
             Unprecedented growth
             over next 15 years
             led by China

    1950     1960      1970       1980    1990     2000       2010   2020   2025   2030
                                                                                                  Differentiated B2B & B2C channel support
       China forecast to be largest AM market by 2025                                                 enabled by strong brand portfolio
 Source: OCIA, Frost & Sullivan
                                                                                                                                                   14
Powertrain Technology Company

                                                                                                                                               Full Exhaust
                                                                                                                                                 Systems
                                                                                                                                                                                       Pistons              Bearings

                                                                                                               Catalytic Converters
                                                                                                                                                                                       Ignition               Valves
       One of the largest pure play powertrain suppliers globally positioned
                                                                                                                                                 Electronic Valve
      to capture content growth due to tightening fuel economy and criteria
            pollutant regulations, light vehicle hybridization trends and
                                                                                                                              Gasoline                                               System                 Sealing /
            commercial truck and off-highway expansion opportunities                                                     Particulate Filters                                        Protection             Heat Shields

                          Revenue by Geography*                                                Revenue by End Market                                          Revenue by Customer
PRO FORMA 2017                                                                                          CTOH
                            APAC                                                                         15%                                                                               General Motors 15%
 REVENUE $10.7B             20%
VA REVENUE $8.5B                                             North                         Industrial
                                                            America                           9%                                                          Other                                      VW 10%
                                                                                                                                                          39%
                                                              41%

                                                                                                                              Light Vehicle
                                                                                                                                  76%                                                                Ford 10%
                         EMEA
                          39%                                                                                                                             Cummins 2%
                                                                                                                                                              Jaguar 2%                           FCA 8%
                                                                                                                                                                   BMW 2%                 Daimler 6%
                                                                                                                                                                Renault Nissan Caterpillar
                                                                                                                                                                      3%          3%

                   Leading positions in all geographies                                           ~25% non-light vehicle                                      Well represented across
                                                                                                                                                                  all global OEMs
                 * EMEA includes Tenneco South America and APAC includes Federal-Mogul South America                                                                                                                      15
Powertrain Technology –
                    Significant Ongoing Opportunity
Global light vehicle sales volume (M)

120                                                                                                 115   116    118                    • ICEs are a significant portion
                                                                                    112     114
                                                     105
                                                             109     110    111
                                                                                             8%     9%    11%    13%    BEV               of vehicles moving forward
                                                                     4%      6%      7%
                                           102
                                      99
100                      94
                              97         1%                         14%     15%
                                                                                                                                        • Powertrain technology
       90      91                        5%                                         18%     19%
                    1%
                    3%
                                                                                                    21%   23%
                                                                                                                 26%    HEV
                                                                                                                                          components support
 80                                                                                                                                       hybridization; increased
                                                                                                                                          complexity and content vs.
 60                                                                                                                            87%        ICE

                                     93%     92%     89%     85%
                                                                                                                               HEV or   • Increasing CO2 and criteria
                      95%     94%                                   83%
 40
      97%     96%                                                           79%     76%     73%     70%   66%    61%    ICE1
                                                                                                                               ICE in     pollutant emissions
                                                                                                                               2030       regulations provide organic
 20
                                                                                                                                          growth opportunities
                                                                                                                                        • Content per vehicle increases
  0                                                                                                                                       in both cylinder and
      2016   2017    2018     2019   2020    2021   2022    2023    2024    2025    2026    2027   2028   2029   2030
                                                                                                                                          aftertreatment systems
1. Includes mild hybrid electric vehicle
Note: ICE = internal combustion engine, HEV = hybrid electric vehicle, BEV = battery electric vehicle
Source: BCG estimates

                                               ICE and hybrids to be 85%+ of vehicle sales through 2030
                                                                                                                                                                           16
Stronger Together –
                Expanded Powertrain Product Offering
        Tenneco Clean Air                                                                    Federal-Mogul Powertrain
                                                                                     1
  1                         2                                                       4 2 3
                                                                                       5
                                                                                         6    1              2              3
 Catalytic Converters      Full Exhaust Systems                                 1
                                                                             3    5
                                                                                6
  3                         4                                                 7               Bearings           Ignition       Valves
      Gasoline
                                                                4
  Particulate Filters        Electronic Valve                                                 4              5              6
        Diesel Particulate Filters

                   6                              2                                                                          Sealing /
                                                                                                  Pistons      System
                                                          6                                                   Protection    Heat Shields
           7                    5
 Selective Catalytic    Diesel Oxidation
     Reduction              Catalyst
                                                                                                            Key Trends
               Key Trends                             Legend                                 • CO2 / Fuel economy regulations
                                                         Tenneco Clean Air                   • Engine performance – downsized,
• Tightening emissions regulations
                                                         Federal-Mogul Powertrain              higher output engines
• Electrification / Hybridization
                                                                                             • Strong OEM investments in ICE
• Strong OEM investments in                                                                    powertrain
  ICE powertrain

                        One of the largest pure powertrain suppliers with engine to tailpipe solutions,
                              addressing both greenhouse gas and criteria pollutant emissions
                                                                                                                                           17
Stronger Together – Enhanced Commercial Truck
                and Off Highway Product Offering
         Tenneco Clean Air                                                                   Federal-Mogul Powertrain
 1                      2
                                                                                              1             2                    3
 Catalytic Converters        Hydrocarbon
                            Manifold Dosing
 3                                                                                             Bearings         Valves                Steel
                        4                                                                                                            pistons
      Gasoline          Diesel Particulate
  Particulate Filters                                                        2   1       2           4                   5
                             Filters
                                                                                 3   4   5
 5                      6                                   3   4            1                        Systems             Sealing /
  Selective Catalytic           Mixers                                   6                           Protection          Heat Shields
                                                                     5
   Reduction (SCR)
       Systems
                                                                                                          Key Trends
               Key Trends                                                                    • Tightening emissions regulations,
• Tightening emissions regulations,                                                            especially diesel NOx emissions
                                              Legend
  especially in India and China                                                              • Technology: alternative fuels,
                                                 Tenneco Clean Air
• More newly regulated powertrains                                                             dual fuel, friction reduction
  through 2025 than regulated today              Federal-Mogul Powertrain                    • CTOH industry consolidation
• CTOH industry consolidation                                                                • Global engine programs
• Global engine programs

      Enhanced capabilities to provide products and systems solutions for the CTOH markets
                                                                                                                                               18
Powertrain Technology
           Complementary Portfolio Brings Unique Competitive Position

 Delivering an optimized trade-off between fuel economy and emission control from the cylinder to the tailpipe

MA N AGES:                                                                  NOx              MA N AGES:
• Friction / performance                                                                     • Conversion efficiency
• Combustion temperature                                               CO         PM         • Thermal management
• Ignition timing                                                                            • Precious metal loading
                             Greenhouse Gases /                       Criteria Pollutants
                                Fuel Economy        FULL SYSTEM
                                                     EMISSION
                                                     CONTROL

                                                  Regulation Driven

 F-M Engine Components                                                                       Tenneco Hot End Components

     System capabilities enable better powertrain efficiency at the lowest total system cost
                                                                                                                          19
Controlled Power Technologies (CPT) Increases
                      Electrification and Hybridization Systems Capability

                                  Sample Products                                Description                                  Application
Provides inroads into
the hybrid market and           CPT SpeedStart         Substitute for standard alternator or starter motor in some          Light vehicle
                                                        applications
powertrain efficiency                                  Relevant for hybrid and start/stop vehicles
technology that will enable                            Recuperates kinetic energy lost during deceleration
new growth opportunities                               Additional CPT variant – Speedtorq – offers torque profiling
for PT Tech in the future
                                COBRA               •   Stands for Controlled Boosting for Rapid Response application     •   Industrial
                                                    •   Type of water cooled electric supercharger
Recently secured a $100M                            •   Capable of increasing air supply to internal combustion engines
OE contract launching in                            •   Additional Cobra variant – FC – designed for fuel cell vehicles
2021 for development and
series production of            TIGERS              • Stands for Turbo-generator gas energy recovery system               •   Commercial
advanced starter                                    • Converts exhaust gas energy into electrical energy                  •   Light Vehicle
generator systems                                   • Key component in Clean Air’s Rankine systems and heat               •   Heavy duty
                                                      exchangers designed for CTOH markets

 Source: Federal Mogul.
                                                                                                                                              20
Powertrain Technology – Benefit from Combined
         Portfolio and Further Growth Opportunities
 Combined product portfolio to better serve              Opportunity to access further growth in
             OE customers                                     evolving powertrain market

• Powertrain products drive lower fuel                • Expected to generate strong cash flow
  consumption / greenhouse gas emissions              • Strategic opportunities for Powertrain
    ‒   Lighter weight products                         Technology:
    ‒   Products designed to withstand higher heat
        and pressure required for higher output           ‒ Continue to round out the CTOH
        engines                                             portfolio
• Clean Air portfolio addresses criteria pollutants       ‒ Opportunities in other engine
• Combined offering allows for potential to                 applications
  optimize engine performance and emissions
                                                          ‒ Participate in new market trends
  across the broader system
    ‒   Both greenhouse gas and criteria pollutant        ‒ Other strategic opportunities as
        emissions                                           powertrain business continues to evolve

         Engine to tailpipe capabilities              Purpose built, pure play powertrain company
                                                                                                      21
Key Terms of the Acquisition
                    •   Purchase price of $5.4 billion; represents Enterprise Value / 2017 Adjusted EBITDA of 7.2x (5.4x
Transaction Terms       including earnings and working capital synergies)
                    •   Consideration to be funded with a combination of cash and Tenneco equity
                    •   Fully committed debt financing in place to fund the cash portion of the transaction
                    •   Expected pro forma Net Debt / Adjusted EBITDA of approximately 3x at closing
    Financing
                    •   Targeting net leverage profile of ~2.5x by the end of 2019 through profitable growth and debt
                        reduction funded by cash flow
                       Icahn Enterprises, LP (“Seller”) to receive:
                           ‒    5.65M Class A Voting Shares, representing 9.9% of Class A shares outstanding
                           ‒    23.79M Class B Non-Voting Shares, together representing 36.4% of total shares outstanding
   Ownership           Tenneco has right to increase cash consideration by up to $400M and reduce shares delivered to
                        Seller by up to 7.32M shares with proceeds of equity offer
                           ‒    Net proceeds of equity offering above $54.68/share would be value accretive for existing
                                Tenneco shareholders. If Tenneco exercises its right the Seller would own 27.4% of total
                                shares outstanding
                    •   Seller will have one board member from close to separation and on Powertrain Technology after
                        the separation
     Other                ‒ Seller's Board representation would not transfer to the Aftermarket Ride Performance
                               business on separation
                    •   As part of the transaction, the Seller will enter into a customary lock-up and standstill agreement
                    •   Expected to close by second half 2018, subject to regulatory and shareholder approvals, as well as
    Timeline            other customary closing conditions
                                                                                                                              22
Tenneco Pro Forma Financial Overview

                                                                                    Tenneco Pro Forma Financial Overview

                                                                                   Total                   Value-add       Adjusted        Earnings                  EBITDA
                                                                                                                                                      (2)(3)
Pro Forma FY 2017                                                               Revenue ($B)              Revenue ($B)   EBITDA ($M)   Synergies ($M)          (w/ synergies) ($M)

                                             (1)
Ride Performance (Plus CA AM)                                                          $3.1                  $3.1           $335                 -                      -
F-M Motorparts                                                                         3.3                    3.3           260                  -                      -
Aftermarket & Ride Performance Company                                                $6.4                   $6.4           $595              $115                   $710

Clean Air (Less CA AM)(1)                                                              $6.2                  $4.0           $533                 -                      -
F-M Powertrain                                                                         4.5                    4.5           493                  -                      -
Powertrain Technology Company                                                         $10.7                  $8.5          $1,025              $85                  $1,110

Pro Forma Tenneco                                                                     $17.1                  $14.9         $1,620             $200                  $1,820

  1.   The Clean Air Aftermarket business is intended to be allocated to the Ride Performance business.
  2.   Represents annual run rate synergies expected to be achieved within 24 months.
  3.   Additional one time working capital synergies of at least $250M expected.

                                                                                                                                                                                     23
Significant Synergy Potential
                       At least $200M1 earnings synergies expected within 24 months
                    Aftermarket & Ride Performance Breakdown                                 Powertrain Technology Breakdown
($ in mm)                                                                        ($ in mm)
$125                                                                              $125
                         $115

$100                      $30                      Sales and Go-To-Market        $100
                                                                                             $85

 $75                                                                              $75

                                                                                             $45             Sales, G&A and Engineering
                          $50                      G&A and Engineering
 $50                                                                              $50

 $25                                                                              $25
                          $35
                                                                                             $40             Supply Chain
                                                   Supply Chain

      $0                                                                           $0
                             Estimated costs to achieve of ~$80mm                            Estimated costs to achieve of ~$70mm

                                                In addition, one time working capital synergies of at least $250M
 1.    Net of estimated public company costs.                                                                                             24
Strong Balance Sheet
                                   Pro Forma Capitalization                                                                      •   Committed debt financing in place
                                                                                                                                 •   Robust liquidity over $2 billion
                                                      Tenneco                  Transaction                 Pro Forma
($ in millions)                                      12/31/2017                Adjustments                12/31/2017             •   Cash flow generation enables rapid deleveraging
Cash & Equivalents                                              $318                      $460                       $778
                                                                                                                                 •   Appropriate capital structure for each company will be
Undrawn Revolver                                               1,356                       144                      1,500            determined prior to separation
Liquidity                                                     $1,674                      $604                     $2,278
Revolving Credit Facility                                        244                      (244)                         -                                    Maturity Schedule
Term Loan A                                                      390                       610                      1,000
Term Loan B                                                        -                     2,400                      2,400        $mm
Tenneco Notes                                                    725                         -                        725       2,400                                                            $2,244
Federal-Mogul Notes                                                -                     1,278                      1,278
Other Debt                                                        95                       160                        255       2,000
Less: Unamortized Debt Issuance Costs                            (13)                      (98)                      (111)
Total Debt                                                    $1,441                    $4,106                     $5,547       1,600
Net Debt                                                      $1,123                    $3,646                     $4,769
                                                                                                                                1,200                                                   $1,029
Adj. EBITDA (before synergies)                                  $868                      $753                     $1,620
                                                                                                                                 800                                     $622   $699
Net Leverage                                                      1.3x                         -                         2.9x                                                                              $500
Net Leverage (after run rate synergies)                              -                         -                         2.6x
                                                                                                                                 400
                                                                                                                                          $37      $74      $87   $112
Pro Forma Shares Outstanding
                                                                                                                                     0
Class A Shares Outstanding                                       51.4                       5.7                          57.1            2H 2018 2019      2020   2021   2022   2023     2024     2025     2026
Class B Shares Outstanding                                         -                       23.8                          23.8             TLA                                   TLB
Total Shares Outstanding(1)                                      51.4                      29.4                          80.9             Notes due 2022 (FM)                   Floating Notes due 2024 (FM)
                                                                                                                                          Notes due 2024 (FM)                   Notes due 2024 (TEN)
1.   Represents undiluted shares outstanding; pro forma ownership not adjusted for Tenneco’s Funding Adjustment Right.                    Notes due 2026 (TEN)

                                                                                                                                                                                                                  25
Substantial Value Creation Opportunity

    (EV / 2018E
                                                                                       Aftermarket & Ride Performance                                                          Powertrain Technology
     EBITDA)*
                                                                                                Comparables                                                                        Comparables
         16.0x

         12.0x
                                                                                                                  9.9x

           8.0x                                                                                                                                                                           7.0x

                                     4.4x
           4.0x

           0.0x
                                    Tiger                                                               Auto Aftermarket                                                            Powertrain Systems
                                                                                                            Suppliers                                                                   Suppliers

*FactSet and Company Filings as of April 6, 2018.

                                                                     Unlocking value for Tenneco shareholders
Note: Multiples shown represent medians of respective comp sets. Auto Aftermarket Suppliers includes MPAA, DORM and SMP. Powertrain Systems Suppliers includes BWA, CMI and DLPH.
                                                                                                                                                                                                         26
Transformational Step –
   Compelling Strategic Rationale
                                                                   AM & RP   PT

Strategically positions each company                                        
Increases scale and broadens portfolio for respective markets               
Enhances capabilities to capture growth with focused investments            
Significant synergy potential in both new companies                         
Provides investors with distinct investment opportunities                   
      Extends existing strategy and accelerates long-term value creation
                                                                                  27
Adjusted EBITDA – Reconciliation of Non-GAAP
                       Results
                                    $ Millions                                                                                                          Year Ended December 31, 2017
                                                                                                                                   Tenneco                      Federal Mogul                               Pro Forma

                                    Net Income                                                                                                   $274                                  $361                                $635
                                     Interest Expense                                                                                              73                                   148                                 221
                                     Income Tax Expense / (Benefit)                                                                                70                                  (190)                               (120)
                                     Depreciation and Amorization                                                                                 224                                   398                                 622
                                    EBITDA                                                                                                       $641                                  $717                              $1,357

                                                                   (1)
                                    Adjustments (reflect non-GAAP measures)
                                       Restructuring and related expenses                                                                           69                                    37                                  106
                                       Pension and post retirement charges                                                                          13                                         -                               13
                                       Goodwill and intangible asset impairment                                                                     11                                    11                                   22
                                       Antitrust settlement accrual                                                                                132                                         -                              132
                                       Warranty settlement                                                                                           7                                         -                                7
                                       Gain on sale of unconsolidated JV                                                                            (5)                                        -                               (5)
                                       Loss on debt extinguishment                                                                                     -                                    4                                   4
                                       Gain on sale of assets                                                                                          -                                   (7)                                 (7)
                                       Gain from termination of customer contract                                                                      -                                   (6)                                 (6)
                                       Warranty release                                                                                                -                                   (4)                                 (4)
                                       Release of deferred purchase price payment                                                                      -                                   (3)                                 (3)
                                       EBITDA contribution of pending asset sales                                                                      -                                   (2)                                 (2)
                                       Other                                                                                                           -                                    6                                   6
                                    Adjusted EBITDA (non-GAAP Financial Measure)(2)                                                              $868                                  $753                              $1,620

1.   Generally Accepted Accounting Principles.
2.   Tenneco presents the above reconciliation of GAAP to non-GAAP earnings measures primarily to reflect the results in a manner that allows a better understanding of the results of operational activities separate from the financial impact of decisions made for
     the long-term benefit of the company and other items impacting comparability between the periods. Adjustments similar to the ones reflected above have been recorded in earlier periods, and similar types of adjustments can reasonably be expected to be
     recorded in future periods. Using only the non-GAAP earnings measures to analyze earnings would have material limitations because its calculation is based on the subjective determinations of management regarding the nature and classification of events
     and circumstances that investors may find material. Management compensates for these limitations by utilizing both GAAP and non-GAAP earnings measures reflected above to understand and analyze the results of the business. The company believes
     investors find the non-GAAP information helpful in understanding the ongoing performance of operations separate from items that may have a disproportionate positive or negative impact on the company’s financial results in any particular period.
                                                                                                                                                                                                                                                                         29
Reallocation of Clean Air Aftermarket –
                       Reconciliation of Non-GAAP Results

      $ Millions                                                                                                                                                              Year Ended December 31, 2017
                                                                                                                                                 Clean Air                Ride Performance         Other                                          Total

      Total Revenue                                                                                                                                       $6,517                         $2,757                                   -                    $9,274
       Less: Clean Air Substrates                                                                                                                         (2,187)                                  -                              -                    (2,187)
      Reported Value Add Revenue                                                                                                                          $4,330                         $2,757                                   -                    $7,087
       Less: Reallocation of Clean Air AM                                                                                                                   (302)                           302                                   -                           -
      Value Add Revenue (post Reallocation of Clean Air AM)                                                                                               $4,028                         $3,059                                   -                    $7,087

      Adjusted EBIT                                                                                                                                         $478                            $255                           ($86)                          $647
       Plus: D&A                                                                                                                                             147                              77                               -                           224
       Less: Restructuring adjustments included in Other segment                                                                                                   -                               -                         (3)                            (3)
      Adjusted EBITDA                                                                                                                                       $625                            $332                           ($89)                          $868
       Less: Allocation of Other segment                                                                                                                     (54)                            (35)                              -                           (89)
       Less: Reallocation of Clean Air AM                                                                                                                    (38)                             38                               -                               -
                                                                                       (1)
      Adjusted EBITDA (post Reallocation of Clean Air AM) (non-GAAP Financial Measure)                                                                      $533                            $335                               -                          $868

1.   Tenneco presents the above reconciliation of GAAP to non-GAAP earnings measures primarily to reflect the results in a manner that allows a better understanding of the results of operational activities separate from the financial impact of decisions made for
     the long-term benefit of the company and other items impacting comparability between the periods. Adjustments similar to the ones reflected above have been recorded in earlier periods, and similar types of adjustments can reasonably be expected to be
     recorded in future periods. Using only the non-GAAP earnings measures to analyze earnings would have material limitations because its calculation is based on the subjective determinations of management regarding the nature and classification of events
     and circumstances that investors may find material. Management compensates for these limitations by utilizing both GAAP and non-GAAP earnings measures reflected above to understand and analyze the results of the business. The company believes
     investors find the non-GAAP information helpful in understanding the ongoing performance of operations separate from items that may have a disproportionate positive or negative impact on the company’s financial results in any particular period.
                                                                                                                                                                                                                                                                         30
You can also read