Temporal variation and potential origins of atmospheric speciated mercury at a remote island in South China Sea based on two year field ...
←
→
Page content transcription
If your browser does not render page correctly, please read the page content below
www.nature.com/scientificreports
OPEN Temporal variation and potential
origins of atmospheric speciated
mercury at a remote island in South
China Sea based on two‑year field
measurement data
Ming‑Jie Yeh1, Chung‑Shin Yuan1*, Kuo‑Ning Hung1, Iau‑Ren Ie1, Cheng‑En Lee1,
Kuan‑Chen Chiang1 & Ker‑Yea Soong2
This study explored the temporal variation, gas-particle partition, and potential origins of
atmospheric speciated mercury at a remote island in the South China Sea. Two-year data of three
mercury species was measured at the Taiping Island. Air masses were clustered into five transport
routes (A-E) to resolve the potential origins of atmospheric mercury. Field measurement showed
that the concentration of gaseous elemental mercury (GEM) (1.33 ± 0.52 ng/m3) was close to the
GEM background level of Northern Hemisphere, while those of GOM and PHg were 13.39 ± 3.58 and
94.33 ± 30.25 pg/m3, respectively. Both regular and intensive samplings concluded a consistent trend
of higher mercury level in winter and spring than that in summer and fall. GEM dominated atmospheric
mercury in all seasons (86.2–98.5%), while the highest partition of particle-bound mercury (PHg) was
observed in winter (13.8%). The highest GEM concentrations were observed for Route A originating
from central China and western Taiwan Island, and followed by Routes D and E from the Philippines,
Malaysia, and Indonesia, while the lowest concentrations of GEM were observed for Routes B and C
originating from North China, Korea, and Japan. Most importantly, high correlation of GEM versus
levoglucosan and K+ in PM2.5 (r = 0.764 and 0.758, p < 0.01) confirmed that GEM was mainly emitted
from biomass burning sources at the surrounding countries.
In the natural environments, mercury maintains dynamic balance in various media including air, soil, and w ater1.
Ocean plays an important role as mercury source or sink in the mercury cycle2. Atmospheric mercury not only
influences local ambient air quality but could also move to the leeward lands and waters via long-range transport,
causing a global environmental impact on bioaccumulation of mercury in marine organisms2–4.
In addition to natural sources such as volcano irruption and forest fires, anthropogenic sources and industrial
activities are major sources of atmospheric mercury. Mercury-containing substances that originally existed in
the earth’s minerals were massively released to the atmosphere mainly through high-temperature combustion,
non-ferrous metal smelting, and cement production p rocesses5. Mercury and its derivatives have been treated as
a worldwide hazardous pollutant due to its persistent, bioaccumulation, and toxic properties, which have been
proven as a threat to human health6. Moreover, it can be spread worldwide through long-range transport in the
atmosphere and causes global environmental i ssue7, which has been claimed as the second world environmen-
tal issue following global warming and has drawn much attention from governments and non-governmental
organization (NGO) in the w orld6.
In the atmosphere, mercury exists in three main forms, namely gaseous elemental mercury (GEM), gaseous
oxidized mercury (GOM), and particle-bound mercury (PHg)8–10. The former two forms are collectively referred
as total gaseous mercury (TGM), and all three are referred as total atmospheric mercury (TAM)11. Among them,
GEM is the dominant species in the atmosphere both locally and g lobally12. Due to its low reactivity and poor
water solubility, GEM is not easily removed by wet and dry depositions, and thus most likely to perform global
atmospheric circulation in the atmosphere for over 0.5–2 years1,13–15. GOM is a highly chemically reactive species
that can be dissolved in water or attached on the surface of suspended micro-tissues, and has a residence time
1
Institute of Environmental Engineering, National Sun Yat-Sen University, Kaohsiung City, Taiwan, ROC. 2Institute
of Marine Biology, National Sun-Yat Sen University, Kaohsiung City, Taiwan, ROC. *email: ycsngi@nsysu.edu.tw
Scientific Reports | (2021) 11:5678 | https://doi.org/10.1038/s41598-021-84434-z 1
Vol.:(0123456789)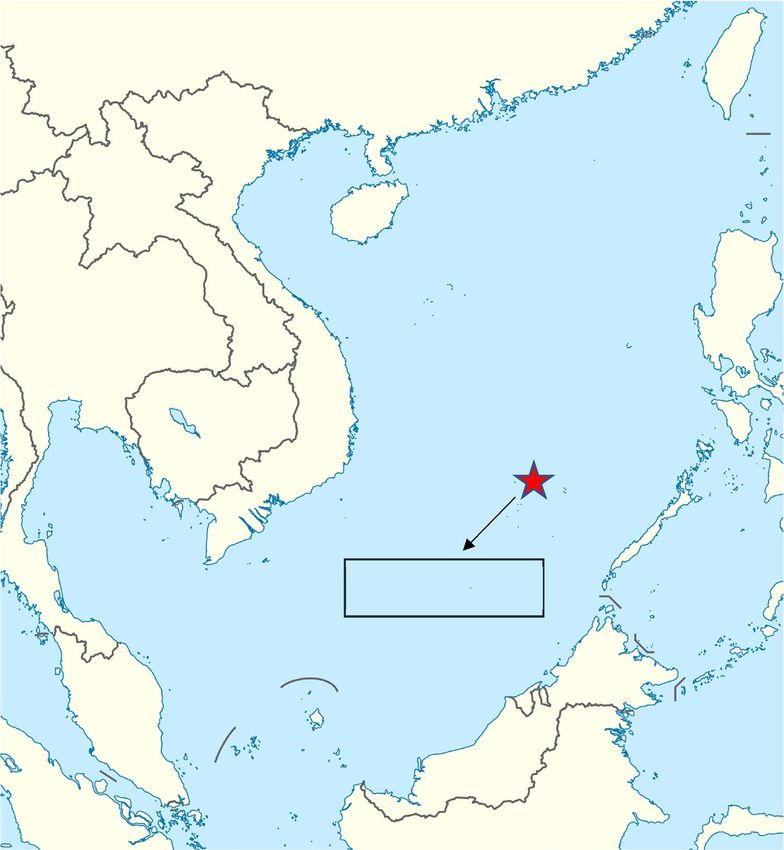
www.nature.com/scientificreports/
CHINA
TAIWAN
LAOS
PHILIPPINES
TAILAND
South China Sea
KAMBODSCHA
VIETNAM
Taiping Island
MALAYSIA BRUNET
MALAYSIA
INDONESIA
INDONESIA
Figure 1. Location of atmospheric speciated mercury sampling site at the Taiping Island in the South China
Sea.
of only a few hours to weeks in the a tmosphere1,3,16. Unlike GEM, GOM can be easily scavenged by wet and dry
depositions due to its high water solubility, thus its transport distance in the atmosphere is only about several
hundred kilometers14,17. PHg is characterized as particle bound mercury and has the atmospheric residence
time of only a few days, which can be commonly removed by both dry and wet depositions and eventually falls
to the lands and the w aters18–20.
The spatial distribution of GEM is in the global scale, while GOM is more likely locally distributed. In terms
of regional and global impacts, GEM tends to transport long distance in the atmosphere, while GOM commonly
falls in a relatively short distance by dry and wet s cavenging2,21. Settling down to the lands or the waters, GOM
might cause even more serious local environmental problems than GEM. In terms of deposition characteristics,
GEM can be settled down via dry deposition or chemically reacts with non-carbon substances to form inorganic
mercury and its deposition flux is very slow. Oppositely, GOM can be settled down to the earth surface much
rapidly via both wet and dry s cavenging3.
Under the influences of prevailing Asian monsoons, mercury originated from the highly urbanized and
industrialized areas in the Northeast Asia and from the biomass burning frequently occurring in the Southeast
Asia can be commonly transported by a continental outflow toward the leeward marine r egions22. One of the
major leeward marine regions is the SCS where is the largest marginal sea in Asia. Among hundreds of islands,
Taiping Island is located in the center of the SCS (see Fig. 1) and is suitable as a remote marine background site
for the measurement of atmospheric speciated mercury in the East Asia.
Previous studies reported that atmospheric speciated mercury along with other air pollutants (i.e. PM2.5) could
be transported easterly from the East Asian continent to the leeward areas of Korea Peninsula, Japan Islands,
Hawaii Islands, and even the West Coast of the United S tates23–25. Additionally, atmospheric speciated mercury
could be transported southerly from the Northeastern Asia to the Taiwan Strait and even the northern S CS22,26.
The emissions of mercury-containing pollutants from East Asian as a continental outflow to the leeward marine
Scientific Reports | (2021) 11:5678 | https://doi.org/10.1038/s41598-021-84434-z 2
Vol:.(1234567890)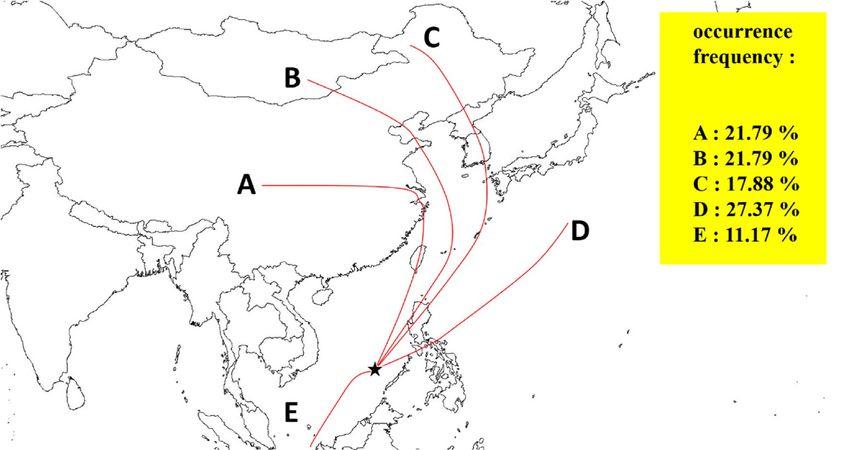
www.nature.com/scientificreports/
regions have been increasing in the past decades. Although previous relevant studies have focused on the effects
of oversea and sea-land transport for atmospheric speciated mercury27–29, the investigation on the temporal
variation and potential sources of atmospheric speciated mercury in the northern SCS is still limited22,27,30.
In particular, the quantitative description on the cross-boundary transport of atmospheric speciated mercury
toward the Taiping Island located at the central part of SCS has not yet been thoroughly investigated in the past.
Accordingly, this study attempts to conduct a mercury sampling campaign at the Taiping Island for two con-
secutive years in order to investigate the temporal variation and gas-particle partition of atmospheric speciated
mercury at the Taiping Island in the central SCS. Further investigation on the resolution of potential origins of
atmospheric mercury in the upwind regions was also undertaken by backward trajectory simulation and statisti-
cal correlation with the fingerprints of biomass burning.
Methodologies
Sampling protocol. In this study, field sampling of atmospheric speciated mercury was conducted at a
remote island, the Taiping Island, in the central SCS from September 2017 to August 2019. The Taiping Island
is the largest natural island with fresh water in the Nansha Islands, which is approximately 1600 km from the
southern tip of the Taiwan Island and about 300 km away from the Palawan Island, the Philippines. The area of
the Taiping Island is approximately 0.51 k m2 and has no permanent residents except for the national coast guard
of Taiwan. As illustrated in Fig. 1, the Taiping Island is located at the center of the SCS with the longitude and the
Latitude of 10° 22′ 38″ N and 114° 2′ 59″ E, respectively.
Three species of atmospheric mercury (TGM, GOM, and PHg) were simultaneously sampled at a platform
of a tower about 7 m above the ground for two consecutive years. The sampling of speciated mercury in the
atmosphere was divided into two phases in the present study. The first phase was conducted to collect 12-h mer-
cury samples for consecutive seven days (i.e. intensive sampling). Daytime sampling was conducted from 8:00
am to 8:00 pm, while nighttime sampling was conducted from 8:00 pm to 8:00 am on the next day. The second
phase was undertaken to collect 24-h mercury sample in an interval of twelve days (i.e. regular sampling). Both
intensive and regular samplings of atmospheric speciated mercury were employed in order to investigate the
temporal variation of atmospheric speciated mercury at the Taiping Island in the SCS. However, during the entire
sampling periods, the field sampling of atmospheric speciated mercury at the Taiping Island was not conducted
in the fall of 2017 for regular sampling as well as in the summer of 2018 for both intensive and regular samplings
solely due to military restriction reasons.
In addition to the field measurement of atmospheric speciated mercury at the Taiping Island, the present study
simultaneously sampled marine fine particles ( PM2.5) at the same sampling site31. The sampling of P M2.5 was
conducted by using quartz fibrous filters with a PQ-200 sampler for further measuring the mass concentration
and chemical composition of PM2.5. PM2.5 filters were initially subjected to ultrasonic vibration for at least 4 h and
filtration, and then analyzed with a high performance ion chromatography (HPIC) for the specific measurement
of levoglucosan and potassium ion ( K+).
Sampling methods of TGM, GOM, and PHg. A standard method for “sampling and analysis of total
gaseous mercury (TGM) and particle-bound mercury (PHg) in ambient air” promulgated by National Insti-
tute of Environmental Analysis (NIEA A304.10C), mainly adopted from U.S. Environmental Protection Agency
(EPA Method IO-5), was applied for the field measurement of atmospheric speciated mercury in this study. The
sampling of atmospheric mercury in the gaseous and particulate phases involves the use of gold-coated bead
traps and quartz fibrous filters, respectively. The amalgamation of gaseous mercury requires a low air flowrate of
0.3 L/min to allow the effective adsorption of TGM onto the gold surface. However, low levels of PHg require a
much higher air flowrate (10 L/min) to ensure a sufficient amount of particles to be collected by quartz fibrous
filter for the following PHg measurement. Moreover, an annular denuder with inner wall coating with potas-
sium chloride (KCl) was applied to adsorb GOM via molecular diffusion m echanism32,33. Similar to PHg, it also
required a much higher air flowrate (10 L/min) to ensure a sufficient amount of GOM to be collected by the
annular denuder for the following GOM measurement.
Therefore, a separate atmospheric speciated mercury sampling system was self-designed for this particular
study, as illustrated in Fig. 2, applying to collect atmospheric mercury in both gaseous and particulate phases.
Most importantly, accurate air flowrate is crucial for sampling atmospheric speciated mercury, thus we conducted
the calibration procedure for correcting the air flowrate of the sampling system periodically in order to accurately
determine the concentrations of atmospheric speciated mercury.
Analytical methods of TGM, GOM, and PHg. After sampling, the concentration of mercury in ambi-
ent air was further analyzed with a cold-vapor atomic fluorescence spectrometry (CVAFS). In addition to the
direct sampling of TGM with a gold-coated sampling trap, GOM and PHg were initially expelled from annular
denuder and quartz fibrous filer, respectively, and then adsorbed by the gold-coated sampling traps. The gold-
coated sampling traps were heated at 450 °C for 2 h to release the adsorbed speciated mercury from the gold-
coated beads. The desorbed mercury was then carried by an inert gas (Ar) to the CVAFS, known as the analytical
trap. Mercury collected on the analytical trap was further thermally desorbed and entered into the CVAFS by Ar
for further mercury analysis.
The analysis of mercury with the CVAFS was undertaken by the following three steps: (1) The Hg sampling
(TGM) or adsorption (GOM/PHg) tube was thermally desorbed to release the adsorbed Hg from the gold sur-
face with inert carrier gas (Ar); (2) The desorbed Hg molecules then entered into the CVAFS for detection; (3)
The Hg molecules absorbed the incident ultraviolet (UV) light and emitted fluorescence that was converted to
Scientific Reports | (2021) 11:5678 | https://doi.org/10.1038/s41598-021-84434-z 3
Vol.:(0123456789)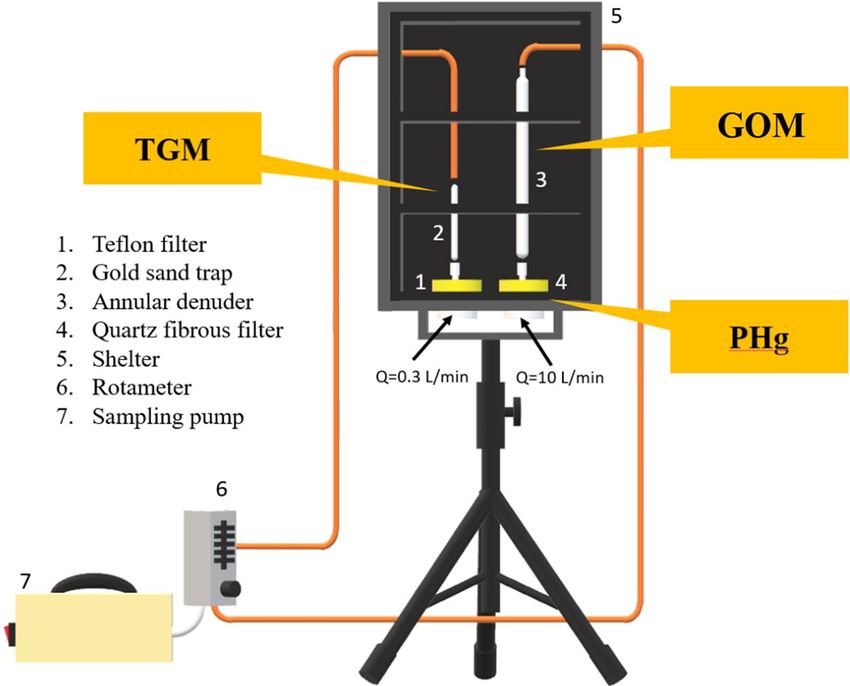
www.nature.com/scientificreports/
Figure 2. Schematic diagram of atmospheric speciated mercury sampling system for field measurement at the
Taiping Island in the South China Sea.
a voltage signal proportional to the amount of Hg by a photomultiplier detector and integrated the voltage peak
area by an integrator.
Prior to conducting the chemical analysis of mercury species, calibration curves were initially prepared for the
subsequent analysis of mercury concentration. In this study, two calibration curves for high- (ng) and low-level
(pg) concentrations of mercury were prepared for GEM and GOM/PHg measurements, respectively (see Fig. S1).
The determination coefficient ( r2) of the calibration curves for the analysis of atmospheric mercury must be 0.99
or higher (r2 ≥ 0.99). Each of the points on the high- and low-level calibration curves predicted by its slope should
be within 5 and 10% differentia of their true values, respectively. In this study, the r 2 of the calibration curves for
the analysis of GEM and GOM/PHg in the levels of ng and pg were 0.999 and 0.997, respectively, which met the
quality assurance and quality control (QA/QC) requirement of r 2 ≥ 0.99.
Clustered transport routes and origin resolution. This study further applied the Hybrid Single Par-
ticle Lagrangian Integrated Trajectory (HYSPLIT) model developed by Air Resources Laboratory of National
Oceanic Atmospheric Administration (NOAA), USA. It is a complete system for computing single air trajecto-
ries as well as complex transport and dispersion. One of the most common applications is the backward trajec-
tory analysis which has been widely applied to identify the potential origins of polluted air m asses34,35. When a
high concentration level of a target air pollutant is measured in a specific time slot at the sampling site, it shows
that a polluted air mass passes through the sampling site during that time slot. For this particular study, a Hybrid
Single Particle Lagrangian Integrated Trajectory (HYSPLIT) model was applied to simulate the backward trajec-
tories of air parcels starting from the Taiping Island at three selected heights (i.e. 100, 300, and 500 m) above the
ground for 72-h transport of the air parcels, which were then plotted for the sampling days during the regular
and intensive sampling periods. Backward trajectories and regional fire maps were further combined to identify
the potential origins of atmospheric mercury with the 3-D wind field data.
Additionally, the measurement data collected by the NASA MODIS satellite was used to plot the fire map
in the target region of East and South Asia. The fire spots on the earth surface were detected by using a multi-
spectral sensor mounted on the MODIS satellite to analyze the middle-infrared and thermal infrared spectrum
irradiated from the high-temperature burning sources, which can then be applied to locate the higher tempera-
ture areas over the ground surface and further determine the reasonable coordinates36.
Results and discussion
Temporal variation of GEM, GOM, and PHg concentrations. This study conducted both regular
and intensive samplings of GEM, GOM, and PHg at the Taiping Island in the SCS and further measured their
concentrations. Table 1 summarizes the seasonal average and standard deviation of GEM, GOM, and PHg con-
centrations at the Taiping Island for two consecutive years. The seasonal variation of three species of atmospheric
Scientific Reports | (2021) 11:5678 | https://doi.org/10.1038/s41598-021-84434-z 4
Vol:.(1234567890)www.nature.com/scientificreports/
Years Seasons Sampling modes n GEM (ng/m3) GOM (pg/m3) PHg (pg/m3)
Intensive 21 1.32 ± 0.11 10.87 ± 1.47 20.57 ± 10.23
2017 Fall
Regular* 0 – – –
Intensive 21 1.31 ± 0.24 12.58 ± 2.93 149.52 ± 50.11
Winter
Regular 24 1.56 ± 0.13 14.12 ± 1.51 71.44 ± 20.08
Intensive 21 1.59 ± 0.10 17.01 ± 1.68 130.22 ± 19.98
Spring
Regular 9 1.46 ± 0.09 13.84 ± 1.16 59.79 ± 10.33
2018
Intensive* 0 – – –
Summer
Regular* 0 – – –
Intensive 7 1.32 ± 0.10 10.05 ± 1.26 19.63 ± 9.51
Fall
Regular 7 1.29 ± 0.08 9.67 ± 0.77 30.28 ± 10.05
Intensive 7 1.23 ± 0.20 12.95 ± 2.39 128.94 ± 27.54
Winter
Regular 8 1.28 ± 0.07 12.45 ± 1.14 140.48 ± 45.61
Intensive 7 1.59 ± 0.10 16.67 ± 1.59 131.21 ± 10.86
2019 Spring
Regular 6 1.31 ± 0.19 15.42 ± 0.45 110.87 ± 10.24
Intensive 7 1.31 ± 0.20 13.05 ± 1.55 50.39 ± 9.68
Summer
Regular 7 1.43 ± 0.09 14.06 ± 2.02 68.49 ± 28.57
Intensive 91 1.33 ± 0.52 13.39 ± 3.58 94.33 ± 30.25
All Seasons
Regular 61 1.43 ± 0.43 13.47 ± 5.74 68.18 ± 19.88
Table 1. Comparison between intensive and regular samplings of atmospheric speciated mercury at the
Taiping Island in South China Sea. GEM gaseous elemental mercury, GOM gaseous oxidized mercury, PHg
particle-bound mercury, Spring March–May, Summer June–August, Fall September–November, Winter
December–February, n number of samples. *The sampling of atmospheric speciated mercury was not
undertaken in the fall of 2017 and the summer of 2018 due to military restriction.
mercury at the Taiping Island showed slight different. According to the average concentrations of atmospheric
speciated mercury for both regular and intensive samplings in each season for two consecutive years, the sea-
sonal average concentrations of GEM were ordered as: spring > winter > summer > fall, and those of GOM were
ordered as: spring > summer > winter > fall, while those of PHg were ordered as: winter > spring > summer > fall
(see Table 1). In summary, the average concentrations of GEM and PHg in the cold seasons (i.e. winter and
spring) were always higher than those in the hot seasons (i.e. summer and fall). High concentrations of GEM
and PHg observed in winter and spring were mainly attributed to the transport of upwind polluted air masses
containing mercury towards the Nansha Island in the SCS via long-range transport. Unlike GEM and PHg, a
different trend of seasonal average GOM concentration was observed at the Taiping Island. High concentrations
of GOM in spring and summer (see Table 1) was mainly attributed to the oxidation of GEM to GOM in the
atmosphere due to relatively high solar radiation and ambient air temperature in the marine boundary layer9,37.
Other possible reason for such seasonal trend was the burning of agricultural debris (i.e. biomass burning) in
the areas surrounding the Taiping Island in the seasons of winter and spring. A huge amount of GEM and PHg
could be emitted by biomass burning from the neighboring continents, causing a high concentration of GEM
and PHg at the downwind Taiping Island. However, mercury originated from the northern upwind polluted
regions might be too far to transport to the central SCS during the northeastern monsoon periods. During the
long-range transport processes, they could be dispersed in the atmosphere and tended to deposit to the earth
surface, both the lands and the seas, on their way to the downwind regions, resulting in relatively low concentra-
tion of mercury at the Taiping Island. As a result, the GEM and PHg sources in the neighboring countries could
be much crucial for the contribution of GEM and PHg at the Taiping Island.
One interesting finding of this study was that the ambient air temperature and solar radiation in summer
at the Taiping Island were always the highest; however, the concentration of GOM commonly oxidized from
GEM was hardly noticeable in summer. It was attributed to the situation that the emissions of GEM from the
neighboring areas might be insufficient amount which thus limited the effective chemical conversion of GEM to
GOM in the atmosphere. As a result, the concentrations of GOM at the Taiping Island maintained at a relatively
low level in summer compared to those in spring. Another possibility was that GOM formed in summer could
be further reduced more back to GEM.
This study further plotted the time series of atmospheric speciated mercury concentrations measured at the
Taiping Island for regular sampling as depicted in Fig. 3. It illustrates that the GEM and GOM concentrations
for the two-year regular sampling period did not show significant variation. Both regular and intensive sampling
results demonstrated that the highest GOM and PHg concentrations were observed in winter and spring, while
their lowest concentrations were found in summer and fall. However, the seasonal variation of PHg concentration
appeared to be more obviously than that of GEM and GOM since PHg tended to fall down significantly during
the long-range transport process, which might cause PHg unable to arrive at the Taiping Island. Additionally,
high rainfall in summer and fall could scavenge particle-bound mercury down to the lands and waters during
the long-range transport processes, resulting in low concentration of PHg observed at the Taiping Island in the
SCS (Fig. 4).
Scientific Reports | (2021) 11:5678 | https://doi.org/10.1038/s41598-021-84434-z 5
Vol.:(0123456789)www.nature.com/scientificreports/
GEM
2
GEM Conc. (ng/m3)
1.8
1.6
1.4
1.2
1
0.8
0.6
0.4
0.2
0
2018/3/10
2018/3/22
2019/1/15
2018/1/9
2018/2/2
2018/4/3
2019/2/8
2019/4/5
2019/6/4
2019/8/3
2019/10/11
2019/10/23
2017/12/4
2019/1/3
2019/2/20
2019/3/3
2019/9/5
2019/11/16
2017/12/16
2017/12/28
2018/1/21
2018/2/14
2018/2/26
2018/11/28
2018/12/10
2018/12/22
2019/1/27
2019/2/28
2019/3/12
2019/3/24
2019/4/17
2019/4/29
2019/5/11
2019/5/23
2019/6/16
2019/6/28
2019/7/10
2019/7/22
2019/8/15
2019/8/27
2019/9/17
2019/9/29
2019/11/4
winter spring winter spring summer fall
GOM
20
GOM Conc. (pg/m3)
18
16
14
12
10
8
6
4
2
0
2019/11/4
2018/1/9
2018/2/2
2018/4/3
2019/1/3
2019/2/8
2019/10/11
2019/10/23
2019/11/16
2019/1/15
2019/1/27
2019/6/4
2019/8/3
2019/9/5
2017/12/4
2018/1/21
2018/2/14
2018/2/26
2018/3/10
2018/3/22
2019/3/3
2019/4/5
2019/9/29
2017/12/16
2017/12/28
2018/11/28
2018/12/10
2018/12/22
2019/2/20
2019/2/28
2019/3/12
2019/3/24
2019/4/17
2019/4/29
2019/5/11
2019/5/23
2019/6/16
2019/6/28
2019/7/10
2019/7/22
2019/8/15
2019/8/27
2019/9/17
winter spring winter spring summer fall
PHg
PHg Conc. (pg/m3)
180
160
140
120
100
80
60
40
20
0
2019/11/4
2018/4/3
2019/1/3
2019/2/8
2018/1/9
2018/2/2
2019/1/15
2019/1/27
2019/3/3
2019/4/5
2019/6/4
2019/8/3
2019/9/5
2019/10/11
2019/10/23
2019/11/16
2017/12/4
2018/1/21
2018/2/14
2018/2/26
2018/3/10
2018/3/22
2018/11/28
2018/12/10
2018/12/22
2019/2/20
2019/2/28
2019/3/12
2019/3/24
2019/4/17
2019/4/29
2019/5/11
2019/5/23
2019/6/16
2019/6/28
2019/7/10
2019/7/22
2019/8/15
2019/8/27
2019/9/17
2019/9/29
2017/12/16
2017/12/28
winter spring winter spring summer fall
Figure 3. Temporal variation of atmospheric speciated mercury concentration for regular sampling conducted
at the Taiping Island in the South China Sea.
Gas‑particle partition of atmospheric mercury. The gas-particle partition of atmospheric mercury
sampled at the Taiping Island was further investigated in this study. Fig. 5 illustrates the partition of gase-
ous and particulate phases of atmospheric mercury for two-year sampling periods. Similar to previous pub-
lished literature22,38–40, the dominant phase of atmospheric mercury at the Taiping Island was gaseous mercury
(TGM = GEM + GOM) (Table 1, Fig. 5). Moreover, a seasonal variation of gas-particle partition of atmospheric
mercury was observed at the Taiping Island. The proportion of TGM in TAM (TGM/TAM) was 98.76% (fall),
90.17% (winter), 93.25% (spring), and 96.91% (summer), respectively, showing that the two-year average and
standard deviation of TGM/TAM was 94.77 ± 3.83%. Additionally, the proportion of PHg in TAM (PHg/TAM)
was 1.24% (fall), 9.83% (winter), 6.75% (spring), and 3.09% (summer) respectively, showing that the two-year
average and standard deviation of PHg/TAM was 5.23 ± 3.83% (Table 1). It revealed that, in four seasons, the
highest proportion of PHg in TAM was observed in winter and followed by spring, summer, and fall (Fig. 5).
The highest portion of PHg/TAM in winter and spring implied that the mercury sources of Taiping Island came
mainly from the upwind neighboring regions. The lowest portion of PHg/TAM in summer and fall was mainly
due to the scavenging of particle-bound mercury by rainout and washout.
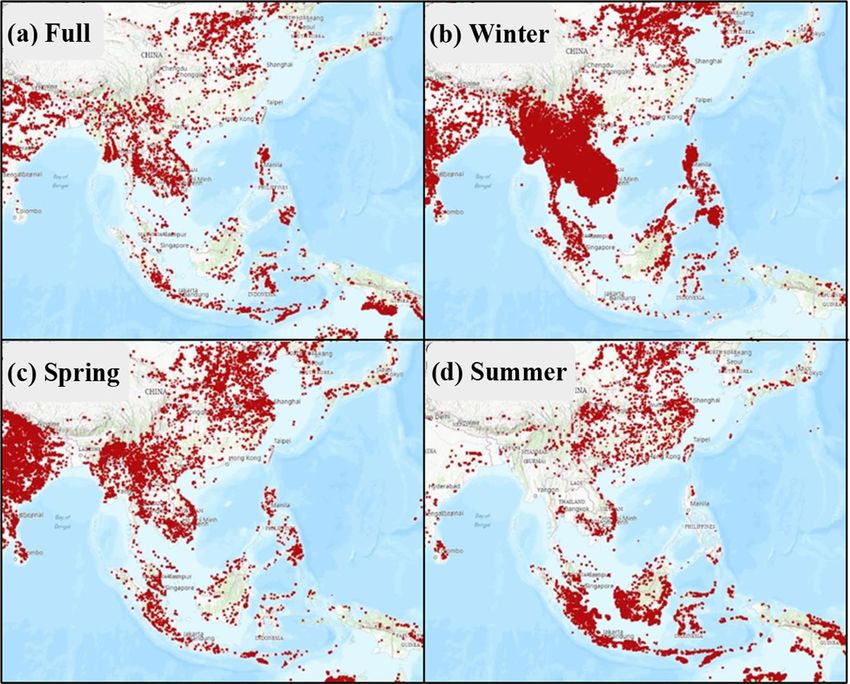
According to the regional fires occurred in the East and South Asia in winter and spring (see Fig. 6b,c), a
plenty of fire spots on the earth surface were observed in the Southeast Asia and mainland China, where a huge
amount of mercury in three forms were emitted to the atmosphere, which can be further transported to the
Taiping Island in the SCS. Although PHg tended to deposit gradually due to gravity forces during the long-range
transport processes, the distance between the PHg emission sources and the Taiping Island might not be too far
Scientific Reports | (2021) 11:5678 | https://doi.org/10.1038/s41598-021-84434-z 6
Vol:.(1234567890)www.nature.com/scientificreports/
0
(a)Fall 5
0 (b)Winter 5
330 30 330 30
4 4
3 3
300 60 300 60
2 2
1 1
270 0 90 270 0 90
5 4 3 2 1 0 1 2 3 4 5 5 4 3 2 1 0 1 2 3 4 5
1 1
2 2
240 120 240 120
3 3
4 4
210 150 210 150
5 5
180 180
(c)Spring 0 (d)Summer
5 0
5
330 30
330 30
4
4
3
3
300 60
300 60
2 2
1 1
270 0 90 270 0 90
5 4 3 2 1 0 1 2 3 4 5 5 4 3 2 1 0 1 2 3 4 5
1 1
2 2
240 120 240 120
3 3
4 4
210 150 210 150
5 5
180 180
Figure 4. Pollution rose of GEM concentration at the Nansha Island.
for particle-bound mercury transporting toward the Taiping Island, resulting in high PHg concentrations and
mass ratios of PHg/TAM in winter.
As a matter of fact, there are no large-scale mercury sources in the vicinity of the Taiping Island. Only very
few anthropogenic activities (e.g. vehicles, cargo ships, and fishing boats) were observed during the sampling
periods. In addition, high TAM concentrations at the Taiping Island might be mainly attributed from the burn-
ing of plant and grass debris regionally. Moreover, the Taiping Island is located at the leeward region of the
Philippines Islands while the prevailing northeastern monsoons were blown to the SCS in winter and spring.
Another possibility was that both gaseous and particulate phases of mercury-containing pollutants emitted from
slash-and-burn farming that frequently occurred in Southeast Asia could be highly probably transported to the
Taiping Island in spring and summer.
Potential origins of atmospheric mercury resolved from clustered transport routes. This sec-
tion attempts to plot a series of regional fire maps in the East and South Asia to compare their spatial distribution
Scientific Reports | (2021) 11:5678 | https://doi.org/10.1038/s41598-021-84434-z 7
Vol.:(0123456789)www.nature.com/scientificreports/
Figure 5. Gas-particle partition of atmospheric mercury at the Taiping Island for two-year measurement data.
Figure 6. Fire maps in the East and South Asia measured by the NASA MODIS satellite.
in four seasons during the two-year sampling periods, which can be further applied to identify the potential
origins of atmospheric mercury sampled at the Taiping Island for the following relevant discussion. The global
fire maps have been widely used by numerous studies to locate the burning sources over the ground surface in
a large geological scale26.
According to the fire maps in fall season, the fire spots (i.e. the sources of open burning) in the East and South
Asia was evenly distributed in India, Indonesia, the Indochina Peninsula, North China, and the Philippines
Islands. Although the fire spots in fall were not as dense as those in winter and spring, they were relatively stable
and evenly distributed in the regions. In winter and spring, the distribution of fire spots highly concentrated
in the Indochina Peninsula, India, Malaysia, the Philippines Islands, South China, Central China, and North
China. As far as the winter season was concerned, there were many densely distributed fire spots covering the
Scientific Reports | (2021) 11:5678 | https://doi.org/10.1038/s41598-021-84434-z 8
Vol:.(1234567890)www.nature.com/scientificreports/
Occurrence
Frequency:
A : 21.79 %
B : 21.79 %
C : 17.88 %
D : 27.37 %
E : 11.17 %
Figure 7. Clustered transport routes of air masses moving toward the Taiping Island in the South China Sea
(★: Taiping Island).
Transport routes* A B C D E
Source regions Central China North China Korea/Japan West Pacific Ocean South China Sea
Frequency (%) 23.81 23.81 19.05 19.05 14.28
Fall
GEM (ng/m3) 1.31 ± 0.06 1.21 ± 0.08 1.18 ± 0.07 1.38 ± 0.03 1.41 ± 0.05
Frequency (%) 23.33 26.67 26.67 13.33 10.00
Winter
GEM (ng/m3) 1.58 ± 0.13 1.30 ± 0.09 1.25 ± 0.09 1.28 ± 0.31 1.38 ± 0.27
Frequency (%) 30.43 26.09 26.09 13.04 4.35
Spring
GEM (ng/m3) 1.66 ± 0.08 1.34 ± 0.09 1.33 ± 0.05 1.35 ± 0.10 1.36 ± 0.00
Frequency (%) – – – 28.57 71.43
Summer
GEM (ng/m3) – – – 1.37 ± 0.06 1.47 ± 0.12
Frequency (%) 21.59 21.59 20.45 17.05 19.32
All seasons
GEM (ng/m3) 1.54 ± 0.17 1.29 ± 0.12 1.26 ± 0.13 1.36 ± 0.18 1.45 ± 0.19
Table 2. Occurrence frequency and route-based average GEM concentration for different clustered transport
routes moving toward the Taiping Island. *The transport routes are clustered in Fig. 6.
entire Indochina Peninsula, where a large number of biomass burning sources were commonly observed in
winter. Moreover, the fire spots in the Philippines Islands were more densely distributed in winter than those
in summer. Particularly, there was a violent trend for the distribution of open fires in the entire India in spring.
The density of fire spots in the Indochina Peninsula, South China, and North China in spring were less than
those in winter, and only sporadic open fires occurred in Central China. Spring is the most vigorous season for
agricultural activities since many food and economic crops were cultivated in this season. Thus, spring was also
the season for the burning of agricultural debris which frequently occurred in the Southeast Asia. In addition
to the influences of biomass burning from mainland China and the Indochina Peninsula, the burning of agri-
cultural debris was commonly observed in almost the entire Southeast Asia, particularly in Indonesia, resulting
in the highest concentrations of atmospheric speciated mercury and levoglucosan in spring (see Tables 1 and
S1). In summer, the open fires were evenly distributed in the mainland China, which was lower than those in
winter and spring. On the contrary, more dense distribution of fire spots were observed in Indonesia and East
Malaysia in the Southeast Asia (see Fig. 6), resulting in higher atmospheric mercury at the Taiping Island during
the southwestern monsoon periods..
Furthermore, this study applied a HYSPLIT model to simulate and plot the backward trajectories originating
from the Taiping Island during the sampling periods. The backward trajectories of air masses were then clustered
into five representative transport routes (Routes A-E) moving towards the Taiping Island as illustrated in Fig. 7.
Route A was originated from Central China passing through the Yangtze River Delta (YRD) and moving along
the West Taiwan Island. Route B originating from North China and Mongolia Plateau passed through metro
Beijing and Tianjin of North China, and transported across the East China Sea (ECS) along the eastern waters of
the Taiwan Island passing through North Luzon Island toward the Taiping Island. Route C was originated from
Scientific Reports | (2021) 11:5678 | https://doi.org/10.1038/s41598-021-84434-z 9
Vol.:(0123456789)www.nature.com/scientificreports/
Northeast China passing through Korea Peninsula and South Japan Islands, and transported across the ECS and
North Luzon Island toward the Taiping Island. Route D transported southwesterly from the West Pacific Ocean
through the metro Malena in the Central Philippines Islands toward the Taiping Island. Route E originating from
East Malaysia and Indonesia in the Southeast Asia was transported northeasterly through the southern waters of
the SCS toward the Taiping Island. The occurrence frequencies of Routes A through E were 21.59, 21.59, 20.45,
17.05, and 19.32%, respectively (see Table 2).
As far as the three typical species of atmospheric mercury are concerned, the chemical activity and water
solubility of GEM are much lower than other two species, which makes GEM to be much more difficultly scav-
enged from the atmosphere than GOM and PHg by dry and wet depositions. Consequently, GEM becomes the
predominant species of atmospheric mercury in most of the atmospheric environments and can be distributed
globally via long-range transport. The concentrations of GEM at the Taiping Island for different transport routes
are shown in Table 2.
The highest GEM concentrations were observed in Route A and followed by Routes D and E, while the lowest
GEM concentrations occurred in Routes B and C. Among the five distinct transport routes, Route A originating
from Central China showed a curved pathway passing through the YRD and West Taiwan Island (see Fig. 7),
both are highly industrialized and urbanized regions, with the highest occurrence frequency in the seasons of
spring and fall (Table 2). This specific transport route brought a huge amount of mercury toward the SCS, and
thus resulted in the highest yearly averaged GEM concentrations of 1.54 ± 0.17 ng/m3 with the seasonal range of
1.31–1.66 ng/m3 at the Taiping Island (Table 2). Other two northern transport routes (Routes B and C) originating
from either Northeast China or Mongolia plateau passed through North China, Korean Peninsula, South Japan
Islands, the East China Sea, and North Luzon Island, with high occurrence frequencies in winter and spring.
These two transport routes showed the lowest seasonal averaged concentrations of GEM ranged from 1.18 to
1.34 ng/m3 (Table 2). It was most likely attributed to the dilution effect of mercury in the atmosphere owing to the
effective dispersion for the longest distance transported from its origins to the Taiping Island. Route D originating
from the West Pacific Ocean passed through the Central Philippines Islands, particularly the highly urbanized
metro Manila, the capital city of the Philippines, and then transported toward the Taiping Island (see Fig. 7). This
transport route (Route D) ranked the third highest yearly averaged GEM concentrations ranging from 1.28 to
1.38 ng/m3 (Table 2) were mainly attributed from both industrial emissions and agricultural activities including
fuel and biomass burning in the Philippines Islands, which resulted in the increase of GEM concentration at
the Taiping Island. Another possible reason was the much shorter distance from its origins in the Philippines
Islands to the Taiping Island, which dramatically dissipated the dilution effect over the dispersion of GEM during
the transport process. Ranking as the second highest yearly averaged GEM concentration of 1.45 ± 0.19 ranging
from 1.36 to 1.47 ng/m3 at the Taiping Island (Table 2), Route E was speculated to be caused by the biomass
burning in the Sumatra and Kalimantan Islands, with the highest occurrence frequency in summer (see Table 2).
Regional fire maps confirmed that the fire spots were concentrated on the Sumatra and Kalimantan Islands in
the south during the summer sampling period (see Fig. 6). Similar to Route D, Route E also had relatively short
distance from its sources in the Sumatra and Kalimantan Islands to the Taiping Island while compared to other
two northern transport routes (Routes B and C).
This study further summarized the occurrence frequencies of transport routes and their route-based aver-
age GEM concentrations at the Taiping Island by combining the backward trajectories and the corresponding
GEM concentration in all seasons (see Table 2). It showed that the two year-round frequencies of different
transport routes were ordered as: Route A (Central China, 21.59%) ≈ Route B (Mongolia Plateau/North China,
21.59%) > Route C (Korea/Japan, 20.45%) > Route E (South China Sea, 19.32%) > Route D (West Pacific, 17.05%),
while their two-year averaged GEM concentrations at the Taiping Island were 1.54, 1.29, 1.26, 1.45, and 1.36 ng/
m3, respectively (Table 2). Among the five transport routes, Routes A, B, and C most frequently occurred in
winter and spring, while Routes D and E were mainly observed in summer and fall.
As illustrated in the fire maps of East and South Asia (see Fig. 6), the frequencies of open fires occurred in
Central China, North China, South Korea and Japan were relatively higher in winter and spring than those in
summer and fall. As the prevailing wind blew from the north toward the Taiping Island, the concentration of
GEM increased accordingly. It was worth noting that the highest GEM concentration was observed for Route A
in spring when Central China had the highest density of fire spots. Route E had the second highest GEM concen-
tration that mostly occurred in summer. Backward trajectories showed that air masses were blown southwesterly
from the southern SCS to the Taiping Island, which was most likely originated from the Kalimantan and Sumatra
Islands where open fires burned vigorously (see Fig. 6), thus resulting in the second highest GEM concentration
at the Taiping Island. The third highest GEM concentration was observed for Route D which passed through
the Central Philippine Islands, where demonstrated relatively higher frequency of open fires in winter and fol-
lowed by those in spring. Oppositely, the relatively low GEM concentrations at the Taiping Island were mostly
observed for Routes B and C that occurred frequently in winter and spring. Although Routes B and C could
apparently blow GEM from anthropogenic sources located at the Northeast Asia to the leeward northern South
China Sea22,26, the concentrations of GEM measured at the Taiping Island were much lower than those at the
Dongsha Island, and close to the GEM background level of Northern Hemisphere in all seasons. Therefore, we
concluded that Asian Northern Monsoons derived from Mongolian high pressure systems seemed not strong
enough to transport the polluted air masses down to the Taiping Island in the central SCS. On the contrary, the
emissions of huge amounts of mercury from the neighboring regions such as the Taiwan Island, the Philippines
Islands, the Kalimantan Island, and the Sumatra Islands (Malaysia and Indonesia) had dominant influences on
the concentration of GEM at the Taiping Island.
Scientific Reports | (2021) 11:5678 | https://doi.org/10.1038/s41598-021-84434-z 10
Vol:.(1234567890)www.nature.com/scientificreports/
16.0
14.0
12.0
Levoglucosan (ng/m3)
10.0
8.0
6.0
4.0
2.0
0.0
R D N R D N R D N R D N
Fall Winter Spring Summer
Figure 8. Seasonal variation of levoglucosan concentration in PM2.5 sampled at the Taiping Island in the South
China Sea (R: regular sampling; D: daytime; N: nighttime).
GEM GOM PHg PM 2.5 Levoglucosan K
GEM 1.00 7.92Ez–07 2.83E–03 6.64E–02 2.24E–06 2.97E–06
GOM 0.78 1.00 1.81E–03 7.58E–01 9.75E–04 2.62E–04
PHg 0.54 0.56 1.00 1.36E–01 2.20E–04 1.33E–03
PM 2.5 0.35 0.06 0.29 1.00 7.06E–05 2.07E–03
Levoglucosan 0.76 0.59 0.64 0.68 1.00 5.84E–14
K 0.76 0.64 0.58 0.56 0.94 1.00
Table 3. Correlation coefficients and p values of atmospheric speciated mercury, P +.
M2.5, Levoglucosan, and K
GEM gaseous elemental mercury, GOM gaseous oxidized mercury, PHg particle-bound mercury, RH relative
humidity, WS wind speed; Color Index of Correlation Coefficient (r): strong (purple, 0.70–1.00), moderate
(brown, 0.40–0.69), and low (green, 0–0.39); Italic Numbers: p values.
Correlation of atmospheric speciated mercury with biomass burning. Previous literature reported
that levoglucosan is produced by the pyrolysis of plant cellulose through high-temperature combustion of plant
debris and w oods41,42. During the burning processes, levoglucosan was formed as an intermediate product which
can be used as an indicator of biomass burning since cellulose was the main component of plant xylem. Moreo-
ver, K+ has also been characterized as another valuable indicator of biomass burning since K+ is highly abundant
in the plant tissues43.
The seasonal variation of levoglucosan concentration in P M2.5 sampled at the Taiping Island is shown in
Table S1 and Fig. 8. Field measurement results indicated that high concentrations of levoglucosan in PM2.5 were
commonly observed in spring and winter at the Taiping Island, implying that polluted air masses containing both
levoglucosan emitted from biomass burning, which could be transported from Asian continent to the SCS. As
illustrated in Fig. 6, the density of fire spots in China, India, the Indochina Peninsula, and the Philippines Islands
surrounding the SCS increased significantly in winter and spring. On the contrary, the fire maps showed that
the Taiping Island was mainly affected by biomass burning commonly occurred in East Malaysia and Indonesia
(e.g. Sumatra and Kalimantan Islands), and the Indochina Peninsula in summer season (see Fig. 6) although the
concentrations of levoglucosan in P M2.5 were relatively low at the Taiping Island (see Fig. 8). Both levoglucosan
Scientific Reports | (2021) 11:5678 | https://doi.org/10.1038/s41598-021-84434-z 11
Vol.:(0123456789)www.nature.com/scientificreports/
Figure 9. Scatter diagrams of levoglucosan versus K
+ as well as TGM versus levoglucosan and K
+ in PM2.5 at
the Taiping Island in the South China Sea.
and gaseous mercury concentrations had similar trend at the Taiping Island, showing that gaseous mercury was
also emitted from the upwind biomass burning sources.
Furthermore, this study correlated atmospheric speciated mercury with PM2.5 and its chemical content of
Levoglucosan and K +. The correlation coefficients and p values of atmospheric speciated mercury, P M2.5, Levo-
glucosan, and K+ are summarized in Table 3. The scatter diagrams of levoglucosan versus K + in PM2.5 as well as
TGM versus levoglucosan and K+ are illustrated in Fig. 9. It showed undoubtedly that levoglucosan had very
strong correlation with K + (r = 0.943, p < 0.01), indicating that both levoglucosan and K
+ were emitted from
Scientific Reports | (2021) 11:5678 | https://doi.org/10.1038/s41598-021-84434-z 12
Vol:.(1234567890)www.nature.com/scientificreports/
Sampling sites GEM (ng/m3) GOM (pg/m3) PHg (pg/m3) References
Taiwan (ROC)
49
Matsu Islands, Taiwan Island 4.56 ± 0.30 – 170 ± 20
50
Penghu Islands, Taiwan Island 4.60 ± 1.38 54 ± 37 210 ± 124
25
Penghu Islands, Taiwan Island 3.28 ± 0.65 23.68 ± 10.22 260 ± 70
51
Penghu Islands, Taiwan Island 2.82 ± 0.57 31.71 ± 1.85 250 ± 63
22
Dongsha Islands, Taiwan Island 2.17 ± 0.09 – –
51
Dongsha Islands, Taiwan Island 2.10 ± 0.46 21.33 ± 8.11 110 ± 78
51
Nansha Islands, Taiwan Island 1.34 ± 0.24 13.49 ± 3.17 100 ± 70
Taiping Island, Taiwan Island 1.37 ± 0.48 13.42 ± 4.56 84 ± 27 This study
51
Taiwan Strait and South China Sea Island 2.09 ± 0.42 35.27 ± 4.38 150 ± 70
27
Checheng, Taiwan Coast 2.26 ± 0.68 19.57 ± 7.83 120 ± 35
29
Kaohsiung, Taiwan Island 6.70 ± 1.40 142.63 ± 153.17 290 ± 210
25
Pingtung, Taiwan Island 2.56 ± 0.92 24.05 ± 8.24 130 ± 40
China
52
Yellow Sea and Bohai Sea, China (Spring) Island 2.03 ± 0.72 2.5 ± 1.7 11.3 ± 18.5
52
Yellow Sea and Bohai Sea China (Fall) Island 2.09 ± 1.58 4.3 ± 2.5 9.0 ± 9.0
30
South China Sea, China Island 2.32 ± 2.62 – –
53
Xiamen, China Coast 3.50 174.41 61.05
Japan
54
Tokaimura, Japan Coast 3.78 ± 1.62 – –
37
Okinawa Islands, Japan Island 2.04 ± 0.38 4.5 ± 5.4 3.0 ± 2.5
55
Kyushu Islands, Japan Island 2.33 ± 0.49 5.7 ± 9.4 10 ± 11
Korea
56
Anmyun Island, Korea Island 4.61 ± 2.21 – –
57
Jeju Island, Korea Island 3.85 ± 1.68 – –
58
Chuncheon, Korea Coast 2.12 ± 1.47 2.7 ± 2.7 3.7 ± 5.7
The Philippines
27
Laoag, the Philippines Coast 3.00 ± 0.69 26.69 ± 9.23 220 ± 46
Table 4. Comparison of atmospheric speciated mercury concentrations at remote islands and coastal sites in
the East Asia.
much similar biomass burning sources. In terms of atmospheric speciated mercury, TGM strongly correlated
with levoglucosan (r = 0.764, p < 0.01) and K+ (r = 0.758, p < 0.01), but weakly correlated with P M2.5 (r = 0.352,
p < 0.01). The results confirmed that gaseous mercury (i.e. TGM) in the atmosphere of the Taiping Island was
mainly emitted from the biomass burning sources, but was not from the industrial sources. Similarly, GOM and
PHg also had moderate correlation with levoglucosan and K+ (r = 0.576–0.644, p < 0.01) (see Table 3).
Results obtained from this study were in accordance with previous reports44–46, indicating that gaseous mer-
cury can be emitted from biomass burning of forests (47,48) and agricultural d ebris46. Clear evidences for long-
range transport of atmospheric speciated mercury emitted from the biomass burning sources in the surrounding
regions of the SCS towards the Taiping Island were obtained and confirmed in the present study, which also
concurred with previous literature (Sigler et al. 47).
Comparison with remote islands and coastal sites in East Asia. The concentrations of atmospheric
speciated mercury measured in the present study were further compared with previous literature. Table 4 sum-
marizes the concentrations of GEM, GOM, and PHg measured at the Taiping Island as well as other remote
islands and coastal areas in the East Asia. It showed that the two-year averaged GEM concentrations at the
Taiping Island were 1.37 ± 0.48 ng/m3, respectively (see Table 1), which were as high as the background GEM
concentration (1.3–1.5 ng/m3) of the Northern Hemisphere. As far as other remote islands and coastal areas in
the East Asia was concerned, the concentration of GEM at the Taiping Island was generally lower than those at
other East Asian islands, but similar to that at the Nansha I slands26, indicating that mercury emissions from the
surrounding countries of the SCS were much lower than other Asian remote islands and coastal areas.
Previous literature reported that remote islands and continental sites commonly have sparse population and
limited emission sources, thus their mercury concentrations were close to the background level. Comparing
with the remote continental sites such as Mt. L ulin59, Checheng27, and Dongsha I slands26,59 in Taiwan, and Mt.
60 30
Changbai and W aliguan in China, we found that the concentration of GEM at the Taiping Island was relatively
low. We further compared the measured atmospheric speciated mercury at the Taiping Island with Taiwan’s main
islands including the Matsu I slands49, the Penghu I slands25,26, and the Dongsha I slands22,26,50. Very similarly,
the concentrations of GEM at the Taiping Island were lower than those at those offshore islands since mercury
emissions from Taiwan and China to these three offshore islands were much higher than those at the Taiping
Scientific Reports | (2021) 11:5678 | https://doi.org/10.1038/s41598-021-84434-z 13
Vol.:(0123456789)www.nature.com/scientificreports/
Island50. Although the concentrations of GEM at the Dongsha Islands were lower than those at the Penghu and
Matsu Islands49,50, the Taiping Island had much lower GEM concentrations than the Dongsha Islands.
Conclusions
The temporal variation, gas-particle partition, and potential origins of atmospheric speciated mercury at the
Taiping Island in the central SCS were firstly investigated for both regular and intensive sampling. Two-year
measurement data showed that the concentrations of atmospheric speciated mercury in cold seasons (winter
and spring) were commonly higher than those in hot seasons (summer and fall). In terms of mercury species,
total gaseous mercury, particularly GEM, dominated TAM and accounted for 86.2–98.5% of TAM at the Taiping
Island. Particle-bounded mercury (PHg) accounted only for 1.5–13.8% of TAM with the highest percentage of
13.8% observed in winter.
The concentrations of atmospheric speciated mercury at the Taiping Island varied with season and were highly
influenced by the transport of mercury emitted from biomass burning sources in the surrounding countries.
Clustered transport routes showed that polluted air masses came mainly from the north routes (i.e. Routes A, B,
and C) in winter and spring, while those in summer and fall came mostly from the east and the south routes (i.e.
Routes D and E). The highest concentrations of GEM came from Route A and followed by Routes D and E, while
the lowest GEM concentrations came from Routes B and C. This study revealed that the concentration of GEM
highly correlated with those of levoglucosan and K+ in PM2.5, implying that atmospheric mercury was mainly
emitted from biomass burning sources at the Philippines Islands in winter and spring as well as at the Kalimantan
and Sumatra Islands in summer. It highly concurred with the seasonal variation of regional fire maps in the East
and South Asia. Compared with other remote islands and coastal areas in the East Asia, the concentration of
GEM observed at the Taiping Island was much lower and close to the background level of Northern Hemisphere.
Received: 23 November 2020; Accepted: 10 February 2021
References
1. Lindqvist, O. & Rodhe, H. Atmospheric mercury—A review. Tellus B 37(3), 136–159 (1985).
2. Mason, R. P. & Sheu, G. R. Role of the ocean in the global mercury cycle. Glob. Biogeochem. Cycle 16(4), 40–41 (2002).
3. Holmes, C. D., Jacob, D. J., Mason, R. P. & Jaffe, D. A. Sources and deposition of reactive gaseous mercury in the marine atmosphere.
Atmos. Environ. 43(14), 2278–2285 (2009).
4. Kock, H. H., Bieber, E., Ebinghaus, R., Spain, T. G. & Thees, B. Comparison of long-term trends and seasonal variations of atmos-
pheric mercury concentrations at the two European coastal monitoring stations Mace Head, Ireland, and Zingst Germany. Atmos.
Environ. 39, 7549–7556 (2005).
5. Jen, Y. H., Yuan, C. S., Hung, C. H., Ie, I. R. & Tsai, C. M. Tempospatial variation and partition of atmospheric mercury during
wet and dry seasons at sensitivity sites within a heavily polluted industrial city. Aerosol Air Qual. Res. 13, 13–23 (2013).
6. UNEP, Global Mercury Assessment (2013).
7. Budnik, L. T. & Casteleyn, L. Mercury pollution in modern times and its socio-medical consequences. Sci. Total Environ. 654,
720–734 (2019).
8. Lindberg, S. et al. A synthesis of progress and uncertainties in attributing the sources of mercury in deposition. Ambio J. Human
Env. 36(1), 19–32 (2007).
9. Poissant, L., Pilote, M., Beauvais, C., Constant, P. & Zhang, H. H. A year of continuous measurements of three atmospheric mercury
species (GEM, RGM and Hgp) in southern Quebec Canada. Atmos. Environ. 39(7), 1275–1287 (2005).
10. Valente, R. J., Shea, C., Humes, K. L. & Tanner, R. L. Atmospheric mercury in the Great Smoky Mountains compared to regional
and global levels. Atmos. Environ. 41(9), 1861–1873 (2007).
11. Lyman, S. N., Gustin, M. S. & Prestbo, E. M. A passive sampler for ambient gaseous oxidized mercury concentrations. Atmos.
Environ. 44, 246–252 (2010).
12. Sheu, G. R., Mason, R. P. & Lawson, N. M. Speciation and distribution of atmospheric mercury over the northern Chesapeake
Bay. J. Am. Chem. Soc. 12, 223–242 (2002).
13. Chen, L. et al. Mercury speciation and emission from municipal solid waste incinerators in the Pearl River Delta. South China.
Sci. Total Environ. 447, 396–402 (2013).
14. Schroeder, W. H. & Munthe, J. Atmospheric mercury-An overview. Atmos. Environ. 32(5), 809–822 (1998).
15. Slemr, F., Schuster, G. & Seiler, W. Distribution, speciation, and budget of atmospheric mercury. J. Atmos. Chem. 3(4), 407–434
(1985).
16. Slemr, F., Seiler, W. & Schuster, G. Latitudinal distribution of mercury over the Atlantic Ocean. J. Geophys. Res. Oceans 86(C2),
1159–1166 (1981).
17. Sprovieri, F., Hedgecock, I. M. & Pirrone, N. An investigation of the origins of reactive gaseous mercury in the Mediterranean
marine boundary layer. Atmos. Chem. Phys. 10(8), 3985–3997 (2010).
18. Ebinghaus, R. et al. International field intercomparison measurements of atmospheric mercury species at Mace Head, Ireland.
Atmos. Environ. 33(18), 3063–3073 (1999).
19. Prospero, J. M. et al. The atmospheric aerosol system: An overview. Rev. Geophys. 21(7), 1607–1629 (1983).
20. Sunderland, E. M. & Mason, R. P. Human impacts on open ocean mercury concentrations. Glob. Biogeochem. Cycle https://doi.
org/10.1029/2006GB002876 (2007).
21. Zhang, L. et al. Estimation of speciated and total mercury dry deposition at monitoring locations in eastern and central North
America. Atmos. Chem. Phys. 12(9), 4327–4340 (2012).
22. Sheu, G. R. et al. Distribution of atmospheric mercury in northern Southeast Asia and South China Sea during Dongsha experi-
ment. Atmos. Environ. 78, 174–183 (2013).
23. Ebinghaus, R. et al. Long-term measurements of atmospheric mercury at Mace Head, Irish west coast, between 1995 and 2001.
Atmos. Environ. 36(34), 5267–5276 (2002).
24. Laurier, F. J., Mason, R. P., Whalin, L. & Kato, S. Reactive gaseous mercury formation in the North Pacific Ocean’s marine boundary
layer: A potential role of halogen chemistry. J. Geophys. Res. Atmos. https://doi.org/10.1029/2003JD003625 (2003).
25. Tsai, M. Y. Spatiotemporal Variation and Clustered Transportation Routes of Atmospheric Speciated Mercury in the Intersection
of Taiwan Strait and South China Sea. Master Thesis, Institute of Environmental Engineering, National Sun Yat-sen University
(2016) (in Chinese).
Scientific Reports | (2021) 11:5678 | https://doi.org/10.1038/s41598-021-84434-z 14
Vol:.(1234567890)www.nature.com/scientificreports/
26. Hung, K. N. et al. Spatiotemporal distribution and long-range transport of atmospheric speciated mercury at three remote islands
in Taiwan Strait and South China Sea. Atmos. Res. 248, 105193 (2021).
27. Chen, T. S. Spatiotemporal Variation and Long-range Transport of Atmospheric Speciated Mercury in the Intersection of Northern
Philippines and Southern Taiwan. Master Thesis, Institute of Environmental Engineering, National Sun Yat-sen University (2017)
(in Chinese).
28. Chen, W. K. et al. Correlation analysis, transportation mode of atmospheric mercury and criteria air pollutants, with meteorological
parameters at two remote sites of mountain and offshore island in Asia. Aerosol Air Qual. Res. 16, 2692–2705 (2016).
29. Jen, Y. H., Chen, W. H., Hung, C. H., Yuan, C. S. & Ie, I. R. Field measurement of total gaseous mercury and its correlation with
meteorological parameters and criteria air pollutants at a coastal site of the Penghu Islands. Aerosol Air Qual. Res. 14, 364–375
(2014).
30. Fu, X. et al. Mercury in the marine boundary layer and seawater of the South China Sea: Concentrations, sea/air flux, and implica-
tion for land outflow. J. Geophys. Res. Atmos. 115(D6), D06303 (2010).
31. Wu, C. X. Investigation on Chemical Fingerprints and Source Apportionment of Marine Fine Aerosol Particles at Two Islands in
South China Sea, Master Thesis, Institute of Environmental Engineering, National Sun Yat-sen University (2020) (in Chinese).
32. Feng, X., Sommar, J., Gardfeldt, K. & Lindqvist, O. Improved determination of gaseous divalent mercury in ambient air using KCl
coated denuders. Fresenius J. Anal. Chem. 366(5), 423–428 (2000).
33. Landis, M. S., Stevens, R. K., Schaedlich, F. & Prestbo, E. M. Development and characterization of an annular denuder methodol-
ogy for the measurement of divalent inorganic reactive gaseous mercury in ambient air. Environ. Sci. Technol. 36(13), 3000–3009
(2002).
34. Fleming, Z. L., Monks, P. S. & Manning, A. J. Untangling the influence of air-mass history in interpreting observed atmospheric
composition. Atmos. Res. 104, 1–39 (2012).
35. Stein, A. F. et al. NOAA’s HYSPLIT atmospheric transport and dispersion modeling system. Bull. Am. Meteorol. Soc. 96(12),
2059–2077 (2015).
36. Roy, D. P., Jin, Y., Lewis, P. E. & Justice, C. O. Prototyping a global algorithm for systematic fire-affected area mapping using MODIS
time series data. Remote Sens. Environ. 97(2), 137–162 (2005).
37. Chand, D. et al. Reactive and particulate mercury in the Asian marine boundary layer. Atmos. Environ. 42, 7988–7996 (2008).
38. Choi, H. D., Huang, J., Mondal, S. & Holsen, T. M. Variation in concentrations of three mercury (Hg) forms at a rural and a sub-
urban site in New York State. Sci. Total Environ. 448, 96–106 (2013).
39. Gustin, M. & Jaffe, D. Reducing the uncertainty in measurement and understanding of mercury in the atmosphere. Environ. Sci.
Technol. 44(7), 2222–2227 (2010).
40. Liu, B. et al. Temporal variability of mercury speciation in urban air. Atmos. Environ. 41(9), 1911–1923 (2007).
41. Babu, B. V. Biomass pyrolysis: A state-of-the-art review. Biofuels Bioprod. Biorefin. 2(5), 393–414 (2008).
42. Kuo, L. J., Herbert, B. E. & Louchouarn, P. Can levoglucosan be used to characterize and quantify char/charcoal black carbon in
environmental media?. Org. Geochem. 39(10), 1466–1478 (2008).
43. Yang, H. Y. et al. Chemical fingerprint and source identification of atmospheric fine particles sampled at three environments at
the tip of Southern Taiwan. Aerosol Air Qual. Res. 17(2), 529–542 (2016).
44. Friedli, H. R. et al. Mercury emissions from burning of biomass from template North American forests: Laboratory and airborne
measurements. Atmos. Environ. 37, 253–267 (2003).
45. Friedli, H. R., Arelland, A. F., Cinnirella, S. & Pirrone, N. Initial estimates of mercury emissions to the atmosphere from global
biomass burning. Environ. Sci. Technol. 43, 3507–3513 (2009).
46. Shi, Y. et al. High-resolution inventory of mercury emissions from biomass burning in tropical continents during 2001–2017. Sci.
Total Environ. 653, 638–648 (2019).
47. Sigler, J.M., Mao, H., Talbot, R. Gaseous elemental and reactive mercury in Southern New Hampshire. Atmos. Chem. Phys. 9,
1929–1942 (2009).
48. Howard, D. et al. Investigation of mercury emissions from burning of Australian eucalypt forest surface fuels using a combustion
wind tunnel and field observations. Atmos. Environ. 202, 17–27 (2019).
49. Jhang, Y. M. Spatiotemporal Distribution and Source Identification of Atmospheric Mercury surrounding the Taiwan Strait.
Institute of Environmental Engineering National Sun Yat-sen University Master Thesis (2014) (in Chinese).
50. Chen, D. W. Spatiotemporal Distribution of Atmospheric Speciated Mercury and Their Chemical Characteristics at the Penghu
Islands. Master Thesis, Institute of Environmental Engineering, National Sun Yat-sen Universit, (2015) (in Chinese).
51. Hung, K. N. Long-range Transport of Speciated Mercury in the Atmosphere of South China Sea and Taiwan Strait. Master Thesis,
Institute of Environmental Engineering, National Sun Yat-sen University (2018) (in Chinese).
52. Wang, C. J., Ci, Z. J., Wang, Z. W., Zhang, X. S. & Guo, J. Speciated atmospheric mercury in the marine boundary layer of the Bohai
Sea and Yellow Sea. Atmos. Environ. 131, 360–370 (2016).
53. Xu, L. et al. Characteristics and sources of atmospheric mercury speciation in a coastal city, Xiamen China. Chemosphere 119,
530–539 (2015).
54. Osawa, T., Ueno, T. & Fu, F. Sequential variation of atmospheric mercury in Tokai-mura, seaside area of eastern central Japan. J.
Geophys. Res.-Atmos. 112(D19), D19107 (2007).
55. Marumoto, K., Hayashi, M. & Takami, A. Atmospheric mercury concentrations at two sites in the Kyushu Islands, Japan, and
evidence of long-range transport from East Asia. Atmos. Environ. 117, 147–155 (2015).
56. Nguyen, H. T. et al. Monitoring of atmospheric mercury at a global atmospheric watch (GAW) site on An-Myun Island Korea.
Water Air Soil Pollut. 185(1–4), 149–164 (2007).
57. Nguyen, H. T., Kim, M. Y. & Kim, K. H. The influence of long-range transport on atmospheric mercury on Jeju Island Korea. Sci.
Total Environ. 408(6), 1295–1307 (2010).
58. Han, Y. J. et al. General trends of atmospheric mercury concentrations in urban and rural areas in Korea and characteristics of
high-concentration events. Atmos. Environ. 94, 754–764 (2014).
59. Sheu, G. R. et al. Temporal distribution and potential sources of atmospheric mercury measured at a high-elevation background
station in Taiwan. Atmos. Environ. 44, 2393–2400 (2010).
60. Wan, Q. et al. Atmospheric mercury in Changbai Mountain area, northeastern China I. The seasonal distribution pattern of total
gaseous mercury and its potential sources. Environ. Res. 109, 201–206 (2009).
Acknowledgements
This study was performed under the auspices of Ministry of Science and Technology (MOST) of Republic of
China (ROC), under the contract number MOST-107-2111-M-110-001. The authors are grateful to MOST for its
continuously financial support. Special thanks also go to National Costal Guard of Taiwan, ROC at the Taiping
Island for constantly assisting in the sampling of atmospheric speciated mercury and providing valuable local
meteorological dada as well.
Scientific Reports | (2021) 11:5678 | https://doi.org/10.1038/s41598-021-84434-z 15
Vol.:(0123456789)You can also read