Telenet Goldman Sachs - European Leveraged Finance Conference - Renaat Berckmoes, Chief Financial Officer - Media Corporate IR Net
←
→
Page content transcription
If your browser does not render page correctly, please read the page content below

Telenet
Goldman Sachs - European Leveraged Finance
Conference

Renaat Berckmoes, Chief Financial Officer

L d
London - September
         S t   b   6
                   6, 2012
Safe Harbor Disclaimer

  Safe Harbor Statement under the Private Securities Litigation Reform Act of 1995.

  Various statements contained in this document constitute “forward-looking statements” as that term is defined
  under the U.S. Private Securities Litigation Reform Act of 1995. Words like “believe,” “anticipate,” “should,”
  “intend,” “plan,” “will,” “expects,” “estimates,” “projects,” “positioned,” “strategy,” and similar expressions
  identify these forward-looking statements related to our financial and operational outlook, dividend policy and
  future g
         growth pprospects,
                       p     , which involve known and unknown risks,, uncertainties and other factors that may  y cause
  our actual results, performance or achievements or industry results to be materially different from those
  contemplated, projected, forecasted, estimated or budgeted whether expressed or implied, by these forward-
  looking statements. These factors include: potential adverse developments with respect to our liquidity or results
  of operations; potential adverse competitive, economic or regulatory developments; our significant debt
  payments and other contractual commitments; our ability to fund and execute our business plan; our ability to
  generate cash h sufficient
                    ff        to service our debt;
                                             d b interest rate and d currency exchange
                                                                                 h      rate fluctuations;
                                                                                             fl            the
                                                                                                            h impact off
  new business opportunities requiring significant up-front investments; our ability to attract and retain customers
  and increase our overall market penetration; our ability to compete against other communications and content
  distribution businesses; our ability to maintain contracts that are critical to our operations; our ability to respond
  adequately to technological developments; our ability to develop and maintain back-up for our critical systems;
  our ability to continue to design networks,
                                         networks install facilities,
                                                          facilities obtain and maintain any required governmental
  licenses or approvals and finance construction and development, in a timely manner at reasonable costs and on
  satisfactory terms and conditions; our ability to have an impact upon, or to respond effectively to, new or
  modified laws or regulations, pending debt exchange transactions, our ability to make value-accretive
  investments, and our ability to sustain or increase shareholder distributions in future periods. We assume no
  obligation
      g       to update
                  p       these forward-looking g statements contained herein to reflect actual results,, changes  g   in
  assumptions or changes in factors affecting these statements.

  Adjusted EBITDA and Free Cash Flow are non-GAAP measures as contemplated by the U.S. Securities and
  Exchange Commission’s Regulation G. For related definitions and reconciliations, see the Investor Relations
  section of the Liberty Global,
                         Global Inc.
                                 Inc website (http://www.lgi.com).
                                             (http://www lgi com) Liberty Global,
                                                                              Global Inc.
                                                                                      Inc is our controlling
  shareholder.
                                                                                                                            2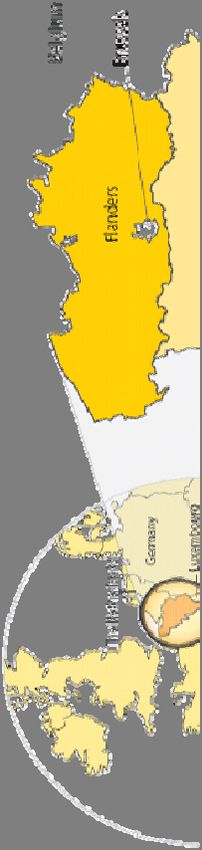
Agenda

  1   Who we are

  2   Change to capital structure and shareholder
      remuneration policy

  3   Future growth drivers

                                                    3
A cable company with a strong
g
track record...
Fully
F ll upgraded,
d d bibi-directional
di ti l 600 MH
MHz network
t k
Powerful
network
Continuous stable level of investments
Active node splitting to create next-gen network
1
EuroDocsis 3.0 powered broadband products
Product
leadership
Full interactive digital HDTV platform with true VOD
Active beyond cable: WiFi and mobile
2
Customer Loyalty closely measured: management
reward system based on customer satisfaction levels
Service is key Leading service levels through efficiency 3
Continuously
C ti l low
l llevels
l off churn
h relative
l ti tto peers
A strong
brand
Strong revenue growth and significant runway ahead
Sustained focus on efficiency, disciplined cost control
Solid financials
Vast
V t majority
j it off capital
it l expenditures
dit success-based
b d 4
Prudent, pro-active balance sheet management
Strong, diversified management team
Our people Balance between long track record and outside
experience 5
Great company culture, promote from within 4
...active in one of Europe’s most
attractive cable markets...
Cable penetration per household Triple-play penetration
(2011) (Q2 2012)
74% 65%
69% 60%
52% 47%
48%
38%
19%
16%
BE UK DE PT NL TNET VMED KDG¹ ZON ZIGGO
(1) Excluding the effect of the TeleColumbus acquisition, as per March, 2012
Strong historical adoption of cable services Triple‐play penetration of 38% at June 30, 2012
Substitution of basic cable TV by digital TV (cable, Significant potential to convert remaining 33% of
IPTV satellite,
IPTV, t llit DTT) ‐ still
till untapped
t d potential
t ti l for
f single‐play
i l l customers
t to
t leading
l di multiple‐play
lti l l bundles
b dl
migration to higher ARPU digital TV platform
Legend: BE=Belgium, UK=United Kingdom, DE=Germany, PT=Portugal, NL=The Netherlands
5
Source: European Commission E-Communications Household Survey, Company data
... in a region
g with national
characteristics
+ 1/3rd of Brussels
Legacy Telenet Network
Interkabel Network = acquired Oct 1, 2008
Flanders is a cohesive footprint Our franchise area covers ~2.9
2.9 million
… a focused, regional government households (61% of Belgium)
… a regional culture and language ~2.8 million homes passed with cable
= ~98%
98% reach
… a regional media environment
~2.2 million unique customers
… a strong and growing economy
= ~75% cable penetration
… superior
p GDP p
per capita
p ((23% above
In B2B,
B2B we cover the whole of Belgium
EU average)
and Luxembourg
6
A strong
g national competitor
versus regional cable systems
Former telco incumbent is half state
state- Fragmented cable industry versus
owned nationwide DSL and mobile operators
>80% VDSL coverage All cable networks are adjacent
Numéricable active in part of Brussels
Belgacom TV is top 3 IPTV platform
(approx. 180,000 homes passed)
Fixed and mobile convergence VOO active in Wallonia
(approx 1.7
(approx. 1 7 million homes passed)
More than 75% market share in B2B
7
Leadingg the cable space in terms of
(multi-) product penetration

                                                                                    Fixed
                                                Digital TV
                                                                                  Telephony
                                                        52%                               32%
                                                     penetration                       penetration

                       Broadband
                        Internet                                                                       Mobile
                               47%
                                                                                                     Telephony
                            penetration                                  Basic
                                                                        Cable TV
                                                                            75%
                                                                         penetration
                                                                         p

Penetration rates relate to total homes passed by the Telenet network                                            8
But still a challenger

                 €4.0 bn                                  €3.8 bn                        €0.9 bn
   Others
                                                              7%
   KPN/BASE        17%                                        2%                            24%

                                                             20%

   Mobistar        37%

   Telenet                                                                                  56%
                  1%

                                                             70%

   Belgacom        44%

                                                                                            19%

                Mobile                               Fixed data & voice                      TV

                                                                                                              9
                           Source: BIPT, 2011 – Market size and market shares are based on service revenues
Cable caters for unparalleled
p
1 Powerful network
service experience
# Product – April 2012
Bandwidth shared 1 Telenet Fibernet 100
over all services
2 Telenet Fibernet 60
Maximum download speed
up to 30 Mbps 3 Telenet Fibernet
4 VOO A La Folie
Dedicated bandwidth per 5 Telenet Comfortnet
service
6 VOO Passionément
Maximum download speed 7 EDPnet Newer & Faster
up to 120 Mbps
8 Dommel CityConnect
y
9 Belgacom Favorite
10 Belgacom Intense
Video and multiple devices will make high broadband speeds relevant
Added value of cable = simultaneous services into the house
New devices (tablet PCs) will require ample streaming capacity
Source: www.ispmonitor.be
10
The ISP Monitor Speed Test is an independent source for bandwidth speed comparison. The results shown above are a summary of the test results gathered by the users of
the ISP Monitor software.Deeper fiberization to retain speed
1 Powerful network
leadership position
TODAY
~1,400
Telenet Service homes/
node
Offering
Optical
N d
Node
Fiber
loops 2015
~500
homes/
Optical node
Nodes
IP Backbone CMTS
Fiber
11
Coax HFC (Hybrid Fiber Coax Network)Beyond our network…
Focus on:
Our products Our service Our brand
12Enhancing customer value 2 Product leadership
(in %) (in %) (in €/month)
Customer mix H1 2011 Customer mix H1 2012 ARPU per customer
profile
72.9
+61% 53.5
33%
34% 39%
38%
45.4
12.8
27% 29%
Q2'12
Q2 12 1P 2P 3P
Single-play Dual-play Triple-play Single-play Dual-play Triple-play
(in 000) (in €/month)
Triple-play subscribers ARPU per unique customer
+9% +10%
819
45.1
752
41.0
H1 2011 H1 2012 H1 2011 H1 2012
13Constant innovation 2 Product leadership
Internet Fibernet – up to 120 Mbps
Digital TV Sporting, Search & Recommend, GUI
Fixed Telephony FreePhone Mobile
Subsidies, Homespots, competitive and
Mobile
innovative SIM-only rate plans
Business A-Desk
14Telenet internet starts where
2 Internet
competition ends
Advertized download
Internet VDSL2 speeds (Mbps)
Up to 25 Mbps
Internet ADSL €35.00
Up to 12 Mbps
€25.00 Basic Internet Fibernet XL
Up to 30 Mbps Up to 120 Mbps
Home Internet 12 €24.95 €64.95
Up to 12 Mbps
€40.00
0 15 30 60 120
// // // //
Internet Basic Start Fibernet
Up to 6 Mbps Up to 30 Mbps Up to 60 Mbps
€25.00 €24.95 €44.95
I t
Internet
t Relax
R l
Up to 16 Mbps
€30.00
Home Internet 1
Up to 1 Mbps Comfort
€25 00
€25.00 Up to 30 Mbps
€34.05
Internet Max
Up to 16 Mbps
Home Internet 4 €40.00
Maxi
Up to 4 Mbps
U to
Up t 30 Mbps
Mb
€30.00
€44.94
(*) Prices mentioned refer to stand-alone residential broadband internet products, in € (including 21% VAT) – temporary promotions have not been 15
reflected – prices mentioned on company websites as per July 26, 2012Increased digitalization 2 Digital
g TV
(in %) (in %) (in €/month)
Digitalization rate g
Digitalization rate ARPU per customer
H1 2010 H1 2012 profile
32%
x2
46%
54% 68%
Analog
12 1 TV
12.1 Digital TV
Analog TV Digital TV Analog TV Digital TV Basic access VAS
12.1
(in 000) Accelerated digitalization
g fueled by
y
Digital TV subscribers successful digital TV migration
campaign;
+17% 116
116,700
700 net new subscribers to our
1,473 higher ARPU interactive digital TV
1,262
platform in H1 2012, of which 71,300
in Q
Q2 2012;;
H1 2011 H1 2012
68% of cable TV customers on digital.
16Sporting Telenet 2 Digital TV
Addition of top Belgian football resulted in 48%
increase in subscribers
Belgian football
~183,700
3 top fixtures per week, exclusive and live in
HD
subscribers
5 remaining fixtures on a non-exclusive €16.15 +48%
basis if 3-play yoy
The best
sports now Top
p European
p football
€21.55
€21 55
exclusively 550 fixtures per season, live
if 2-play
on Premier League, German, Italian, Dutch and
Sporting French national leagues
Telenet €26.95
if 1-play
NBA Basketball
NFL American Football
Golf
All prices are retail prices per month and including 21% VAT
Also available on 17Fixed telephony
p y remains a reliable 2 Fixed telephony
cheap voice solution
(in 000)
Fixed
i d telephony
l h market
k share
h (*)
Fixed telephony subscribers
Telenet Competition
920
880
815
741
629 67% 64% 61%
71%
548
455
364
33% 36% 39%
29%
2005 2006 2007 2008 2009 2010 2011 H1
2012 2008 2009 2010 2011
(*) Adjusted for Telenet footprint only.
Source: company data, adjusted based on own estimations.
Continued penetration(**) amongst our customer base, reaching 32.2% at the end of Q2 2012;
Net new subscriber growth driven by attractive flat
flat-fee
fee rate plans and multiple
multiple-play
play growth;
Introduction of FreePhone Mobile in November 2011 is expected to drive incremental RGU
growth;
Sustained market share gains despite mature and intensely competitive market;
Reliability and cheap flat-fee plans remain key advantages over mobile.
18
(**) Penetration as a % of homes passed across the Combined Network. Combined Network includes both Telenet Network and Telenet Partner Network.FreePhone tariff plans 2 Fixed telephony
Relevance of fixed line fuelled by free FreePhone Mobile option
FreePhone MOU to mobile
Europe
€20 + Free option:
FreePhone Mobile
x4
per month Q1 2011 Q1 2012
Introduction of free option FreePhone Mobile
FreePhone Europe allows customers to make the following calls (per month):
U li it d offpeak
Unlimited ff k calls
ll to
t fixed
fi d li
lines iin B
Belgium
l i
1,000 offpeak minutes to mobile numbers in Belgium
2,000 offpeak minutes to fixed lines in Europe + Turkey + Morocco
€10 option to place 24/7 calls to fixed lines in Belgium and Europe
19The convergent
g future:
2 Mobile
WiFi + mobile
Telenet Hotspots / WiFi homezone + Telenet Mobile
Telenet Hotspots: >1,200
locations (airports, train stations,
hotels, highway parkings)
International coverage:
>140,000 locations in 95
countries through iPass
Telenet WiFi homezone via
home gateway
20Launch of competitive
p SIM-only
y 2 Mobile
rate plans
P
Pay as you go Ki
King K
Kong
€0.15 /min 150 minutes 2,000 minutes
€0.10 /SMS 10,000 SMS 10,000 SMS
€0.10 /MB 500 MB 1 GB
Stand-alone €0 €20 €70
For Telenet
customers €0 €15 €50
Simple, transparent
No fixed contract duration
85% of mobile consumers will be able to save money 21Telenet for Business 2 Business
Integration of VAS + connectivity and SmallBiz + enterprise
segments create foundation for unique service portfolio
Value Added Services Security Solutions Security Consulting Managed Services
Integrated c-cure
product hostbasket Hosting Housing Applications
Unified
Cloud
Collaboration
portfolio
Connectivity Carrier Offer
Data Internet Voice Multi-TV
Service Levels: Securitisation & Back-up Options
Transport Fiber Coax Copper Mobile Wireless
Client
segment
targets
22Delivering
g a superior service
3 Service is key
experience to our customers
A unique service experience
360° Experience
for our customers
Speed leadership
through Fibernet
Internet Television
Richest experience &
OTT market convergence
Platform
Bundles
Maximize ARPU per
unique customer
23Enhance customer loyalty 3 Service is key
(in %) Continued low churn levels for all
Annualized churn services compared to peers and other
10.3% cable operators;
7.1% Reflects Telenet’s continued
7.1%
investments in customer care and
focus on customer experience;
Q1'10 Q3'10 Q1'11 Q3'11 Q1'12
Basic cable TV Broadband internet Management incentive schemes to
Fixed telephony
enhance customer loyalty.
New Telecom Act Telenet
Maximum fixed No fi
N fixed
d contract
t t
contract term limited term for all major
to six months as of services as of
October 1,, 2012 October 1, 2012
24And reward accordingly 3 Service is key
TOP-150
TOP 150
Customer
Loyalty
15%
g
Managerial
skills
43%
Operational
and financial
performance
44%
2007-2009 As of 2010
Customer
C
Customer loyalty
satisfaction
25Strong stable cash flows and
4 Solid financials
significant operating leverage % of revenue
(in €m) (in €m)
Revenue Adjusted
j EBITDA
1,376 723
1,299(*)
1,197
669
+9%
9%
+7% 608 CAGR
CAGR
2009 2010 2011 2009 2010 2011
50.7% 51.5% 52.6%
(in €m) (in €m)
Accrued capital expenditures Free cash flow
160 254 242
31 +22%
162 CAGR
310
(**) +9%
318
259
(**)
yoy
2009 2010 2011 2009
00 2010
0 0 2011
0
(**) (**) (**)
26.5% 22.0% 22.5% 13.5% 19.6% 17.6%
(*) Including approximately €8.0 million of revenue on certain premium voice and SMS content sevices, which were no longer recognized as of
26
January 01, 2011 following a change in Belgian legislation.
(**) Excluding DTT license in 2010, 4th 3G mobile spectrum license and Belgian football rights in 2011.Experienced
p management
g team 5 Our people
with long tenor across the industry
N
Name J i d Telenet
Joined T l P ii
Position
Duco Sickinghe 2001 Chief Executive Officer and Managing Director
Jan Vorstermans 2003 Chief Operating Officer
Patrick Vincent 2004 Chief Commercial Officer
Renaat Berckmoes 2001 Chief Financial Officer
Luc Machtelinckx 1999 Executive Vice President and General Counsel
Claudia Poels 2008 Senior Vice President Human Resources
Inge Smidts 2009 Senior Vice President Residential Marketing
Herbert Vanhove 2010 Senior Vice President Product Management
g
Martine Tempels 2009 Senior Vice President Telenet for Business
Ann Caluwaerts 2011 Senior Vice President Public Affairs & Media Management
Senior Vice President Strategy
Strategy, Investor Relations and Corporate
Vincent Bruyneel 2004
Communications
Promoting an environment that supports a dynamic and innovative culture
27Regulation: Timeline of wholesale
of cable services
European N to scale
Not l
Commission (DD/MM/YY)
notification RO and
retail‐minus
max 3
6 months 9 months (**) 6 months weeks
Preparation & submission draft Approval of Contract
Implementation
reference offer reference offer negotiations
1/08/2011 1/09/2011 31/1/2012 4/9/2012 1/11/2012 1/5/2013 21/4/2013 6/2013
Annual review
by VRM Launch
date
Court of Appeal :
introduction of
suspension and Possible Possible
annulment suspension(*) annulment at
the earliest
(*) In case suspension would not be granted to Telenet, Telenet could incur additional accrued expenditures related to preparatory IT investments for
wholesale.
(**) Due to the delayed decision on the suspension, which was initially expected by April 26, 2012, the envisioned 4 month period for approval of the
reference offer will be extended which subsequently affects the start of the 6 months implementation timing. 28Agenda
1 Who we are
2 Change to capital structure and shareholder
remuneration policy
3 Future growth drivers
29Policy changes to enhance returns to
shareholders
Target range of 3.5-4.5x
3 5 4 5x Net Total Debt to EBITDA((*))
Net leverage to maintained
1 higher end of Objective to move to around 4.5x from c.3.5x
target range
Higher net leverage supported by:
Strong cash flow generation
Stable business profile
Solid future growth
No significant acquisitions in the foreseeable future
Future shareholder Underpins future growth potential
remuneration Tax neutral for shareholders if in form of program (if in
2 mainly via share form of self-tender, for Belgian retail shareholders and
repurchases other investors that cannot benefit from exemption or
reduction, rate of the Belgian withholding tax is 21%)
Enhances flexibility for shareholder distributions
and increases FCF per share potential
Inc
Increase
ease of ownership
o ne ship percentage
pe centage for
fo remaining
emaining
shareholders as repurchased shares will be cancelled
30
(*) Net leverage ratio is calculated as per the Senior Credit Facility definition, using net total debt, excluding subordinated shareholder loans, capitalized
elements of indebtedness under the clientele and annuity fees and any other finance leases, divided by last two quarters’ annualized EBITDA.Immediate actions
Opportunistic
O t i ti time
ti t raise
to i additional
dditi l debt
d bt financing
fi i
Incurrence of Further improvement of long-term capital structure
1 additional debt
Proceeds of any additional debt are intended to be used
to fund a share buy-back
Telenet is targeting a Net Total Debt to EBITDA ratio of
around 4.5x (*)
(*) Net leverage ratio is calculated as per Senior Credit Facility definition, using net total debt,
excluding subordinated shareholder loans
loans, capitalized elements of indebtedness under the clientele
and annuity fees and any other finance leases, divided by last two quarters’ annualized EBITDA
Voluntary conditional tender offer
Share buy
buy-back
back of
€656.4 million via 20,673,043 shares or up to 18.2% of the share capital
2 (**)
self-tender offer
Offer price of €35.0 per share (***)
Majority shareholder LGI will not tender its shares
Current €50.0 million Share Repurchase Program 2012,
of which 91% has been executed, has been terminated
(**) Total number of shares issued by the Company including own shares currently held by the Company. These treasury shares represent 0.76% of
the total number of shares.
(***) To be adjusted downwards by the gross amount of any distributions prior to the closing of the tender offer (including the €3.25 per share to be 31
paid on August 31, 2012 pursuant to the capital decrease approved by the extraordinary shareholders’ meeting on April 25, 2012).Details about share repurchase plan via
self-tender offer
Share buy-back enhances flexibility for shareholder
Purpose distributions and increases FCF per share potential
However, shareholders with focus on cash only returns can opt
for voluntary tender offer
Self-tender
Self tender in accordance with the Belgian tender offer rules for a
Form maximum of 20,673,043 shares, or 18.2% of the share
capital of TGH NV (*), at a price of €35.0 per share (to be
adjusted downwards by the gross amount of any distributions prior to the closing of the
tender offer, including the €3.25 per share capital return to be paid on August 31, 2012)
LGI, Telenet’s majority shareholder, would not tender any
shares in the tender offer, but reserves its position concerning
tendering in possible future repurchase programs. (**)
Each shareholder would be able to tender approximately
37% of the shares it owns and tender additional shares by
way of a pro ration mechanism (to the extent the tender offer is
under-subscribed)
(*) Total number of shares issued by the Company including own shares currently held by the Company. These treasury shares represent 0.76% of the
total number of shares.
32
(**) If the maximum number of shares is tendered and subsequently cancelled, LGI’s shareholding in Telenet would increase from 50.04% to 61.18%
of the share capital of Telenet and to 61.75% if treasury shares are not counted.Leverage to higher end of range while
maintaining
i t i i strong
t deleverage
d l capacity
it
Leverage ratio (1) (**)
Pro Forma Net Total Debt/EBITDA (*) Pro Forma deleverage capacity
6.25x CONCEPTUAL
6.0x
6 6
5 5
4 Leverage threshold 3.5-4.5x 4
3 3
2 2 -1.0x
-1.5x
1 1
0 0
Q1 09 Q3 09 Q1 10 Q3 10 Q1 11 Q3 11 Q1 12 Q3 12 2012 2013 2014 2015
Pro-forma
Senior Credit Facility EBITDA Covenant Net Debt / L2QA EBITDA
Leverage ratio to increase to around 4.4x (pro-forma Q3’12) from 3.1x (Q2’12)
Reflects planned €3.25 per share capital reduction (€369.2 million in aggregate) and
proposed €656.4 million share buy-back
Telenet maintains strong autonomous deleverage capacity
Assuming all Free Cash Flow would be used for debt repayments, leverage would
decrease by ~1.0x by 2014 and by ~1.5x by 2015
(*) Calculated as per Senior Credit Facility definition, using net total debt, excluding subordinated shareholder loans, capitalized elements of
indebtedness under the clientele and annuity fees and any other finance leases, divided by last two quarters’ annualized EBITDA.
(**) Conceptual, assuming that all FCF will be used to repay existing debt instruments. FCF based on Bloomberg consensus estimates as of Aug 7, 2012
that do not reflect management projections and are included for informational purposes. The Company takes no responsibility for the accuracy of 33
such data.Balanced debt profile remains unchanged
(in €m) (in €m)
Debt profile (committed) Pro-forma debt profile
(estimated amounts and maturities
post transaction)
400 400
799 799
500 500 450
158 431 300 158431 300
175 175 250
100 100
2012 2013 2014 2015 2016 2017 2018 2019 2020 2021 2012 2013 2014 2015 2016 2017 2018 2019 2020 2021 2022 2023 2024
TL M TL N TL O TL P TL Q TL R TL T Revolver TL M TL N TL O TL P TL Q TL R TL T Revolver New issuance
Average maturity of ~7 years New issuance of €700 million
No debt repayments before 2016 equivalent, of which €450 million 10Yr
Senior Secured Notes at 6.25% and
€250 million 12Yr Senior Secured
Notes at 6.75%
Further extends average maturity
34Enhanced shareholder return for 2012
Initial shareholder Amended shareholder
return 2012 return 2012
€1 00 per share
€1.00 €1 00 per share
€1.00
Regular dividend
(paid May 10) (paid May 10)
€3.25 per share €3.25 per share
Capital reduction
(to be paid Aug 31) (paid on Aug 31)
Share buy back €50.0m in total €702.1m in total (*)
(*) Of which €45.7m under the Share Repurchase Program 2012 as announced on Feb 16, 2012 and terminated on August 11, 2012.
35Agenda
1
Who we are
2 Change to capital structure and shareholder
remuneration policy
3 Future growth drivers
36FY 2012 outlook reconfirmed
FY 2012 will be at least at top end of outlook
Top line and Adjusted EBITDA growth will
5% – 6%
Revenue growth be higher in H1 relative to H2 2012;
((~€1,445m
, – €1,459m)
, ) We will no longer
g benefit from favorable
impact from price increases and launch of
Sporting Telenet both happened in Q3
2011;
Adjusted EBITDA 5% – 6% Strong continued underlying growth in H2
growth fueled by digital TV,
TV broadband and
(~€760m – €767m) mobile.
~76% success-based;
Accrued 22% – 23% Higher spending on set
set-top
top boxes and
Capital Expenditures (1)
(~€318m – €335m) customer installations, in line with
expected RGU growth, and Pulsar.
Solid and sustainable Free Cash Flow
Free Cash Flow (2) generation despite higher cash payments
Stable
for Belgian football rights and higher cash
interest expenses,.
(1) Represents accrued capital expenditures. Accrued capital expenditures are defined as additions to property, equipment and intangible assets, including additions from capital leases and other financing arrangements, as reported
in the Company’s statement of financial position on an accrued basis.
(2) Free Cash Flow is defined as net cash provided by the operating activities of Telenet’s continuing operations less (i) purchases of property and equipment and purchases of intangibles of its continuing operations, (ii) principal
payments on vendor financing obligations, and (iii) principal payments on capital leases (exclusive of network-related leases), each as reported in the Company’s consolidated statement of cash flows. Free Cash Flow is an
additional measure used by management to demonstrate the Company’s ability to service debt and fund new investment opportunities and should not replace the measures in accordance with EU GAAP as an indicator of the
37
Company’s performance, but rather should be used in conjunction with the most directly comparable EU GAAP measure.Future growth drivers
1 Broadband penetration 2 TV subscribers
Flanders
95%
Inter- +19% 32%
Digital
net TV
80% 68%
2011 2015 (Est)
Digital Analog
3 Mobile SIMs per 4 Business growth
cable customer opportunities
13% Legacy business Small
M bil
Mobile B2B Bizz
87% Security Hosting
Video MLE
Cloud
services
Telenet Mobile Other mobile provider
38Strong fundamentals to deliver long-term
shareholder
h h ld value
l
1 Convert 62% of 1P and 2P
2 Continued investments in
customers to triple play fixed network (Pulsar node
Repositioning in mobile and splitting project)
quadplay enhancing ARPU Invest and Maintain leadership position
Future maintain on broadband speed and
Broadband market growth
growth
th leadership interactive digital TV platform
from c.80% now to c.95% by
2015 position
Strong focus on customer
Convert 32% remaining excellence and loyalty
analog TV base to digital
3 4 Significant availability of
Balanced revenue mix
underlines defensive cash at 4.5x leverage
characteristics Enhanced flexibility for
Solid EBITDA margins and Strong long-term shareholder
Sound share-
Free Cash Flow generation distributions
fi
financial
i l holder
profile No debt maturities before Stable leverage target of
potential
2016, average maturity ~4.5x projects attractive
around 7 years and recurring shareholder
distributions
Interest risks fully hedged
39And long
long-term
term strategy
L d hi
Leadership
Leading cable network
Network
Fiber closer to the homes
Differentiate
ff
Aggregate services
Service Layer
All-IP
E ll
Excellence
Competitive, simple and rational
Customer
Top leadership commitment for
40Thank
you.
you
Telenet Vincent Bruyneel Rob Goyens
Liersesteenweg 4 Senior Vice President Strategy, Investor Director Investor Relations
2800 Mechelen,
Mechelen Belgium Relations and Corporate Communications and Strategic Planning
investors.telenet.be + 32 (0)15 33 56 96 + 32 (0)15 33 30 54
vincent.bruyneel@staff.telenet.be rob.goyens@staff.telenet.beYou can also read