Technical Advisory Group - Winter modelling update Modelling other viruses - GOV.WALES
←
→
Page content transcription
If your browser does not render page correctly, please read the page content below
Technical Advisory Group
Winter modelling update
Modelling other viruses

10th September 2021

© Crown copyright 2020
Modelling other winter viruses

Welsh Government COVID-19 TAG Policy Modelling Subgroup

  1. Summary
  1. This paper outlines some scenarios of flu and RSV models to compliment the
     regular update of covid-19 models that we publish.
  2. We are at a point where the covid modelling that Welsh Government
     commission from Swansea University has been quite robust in predicting what
     happens over the next two months or so, with the last few most likely
     scenarios (MLS) from Swansea University being close to the actual data. This
     has been useful for policy makers in Government and for the NHS.
  3. This has led to questions about modelling other respiratory viruses like
     influenza (flu) and RSV (respiratory syncytial virus) which were largely absent
     in winter 2020/21 but are likely to recur, and may rebound at a higher rate
     than a typical winter, partly due to an ‘immunity debt’ where lack of exposure
     means low immunity, for instance in 1-2 year olds who have not been
     exposed to RSV. In general, nearly 90% of children may be infected with RSV
     in the first two years of life, but a small proportion may develop bronchiolitis
     and need hospital treatment including for some, Paediatric ICU.
  4. RSV cases and admissions have increased in Wales and the RSV season
     began 15 weeks earlier than normal (in July) but may be plateauing now, as
     may also be the case in parts of England. There was an initial peak followed
     by a fall in RSV cases in the North West of England although this fall is partly
     due to less testing for RSV in Manchester hospitals.
  5. Both flu and RSV may show asynchronous growth in different parts of Wales,
     and the impact of flu will depend on type, clade and vaccine composition.
  6. Influenza vaccines are less effective than the covid vaccines and are not
     effective enough to reach herd immunity type effects. However there is
     evidence that repeated annual vaccination boosts effectiveness. Awareness
     of covid might increase flu vaccine uptake. Flu vaccines are being rolled out to
     more children and young people than in previous years, up to secondary
     school year 11.
  7. There is no current RSV vaccine in use although very high risk infants are
     given monthly injections of the monoclonal antibody Palivizumab to prevent
     severe disease caused by RSV – this is around 50% effective.
  8. Current modelling carried out by Public Health Wales (PHW) is based on
     detecting the onset of annual influenza and RSV epidemics and providing a
     series of thresholds to compare severity against historical seasons. This is the
     World Health Organisation / European Centre for Disease Prevention and
     Control (ECDC) agreed approach for seasonal respiratory infection
     surveillance, which allows for country to country comparison of thresholds
     reached. In terms of planning, this allows PHW to compare seasons to
     historical seasons hit very high/ high/ medium/ low levels of severity for

                                         2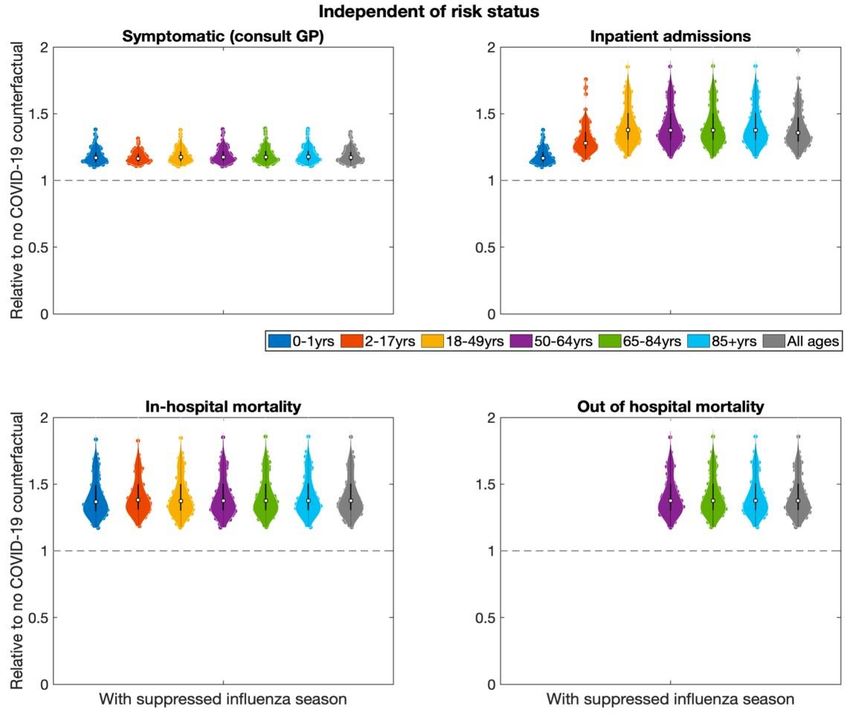
scenario planning, and highlighting any relevant antigenic differences in
        emerging influenza viruses. There may be an increased chance of vaccine
        mismatch this winter as there has been very little flu activity in the Southern
        hemisphere in their winter/our summer.
    9. There may be a view that the way things have happened pre-covid has
        worked well, but there may also be a view that there is an opportunity to
        model several viruses simultaneously and estimate potential combined
        scenarios of respiratory pressures on the NHS system. This may be more
        important because of the backlog of elective care which is in turn putting
        pressure on emergency care in the NHS.
    10. It may be that individual behaviours around wearing face coverings, self -
        isolation and staying at home with symptoms, and other changes in terms of
        infection prevention and control in health and social care, will have longer
        term effects in preventing transmission of several viruses, but this remains to
        be seen, and we need to prepare for the possibility of very challenging
        conditions with lots of viruses in circulation. The R0 for influenza is likely to be
        lower than COVID-19 at around 1.8 whereas R0 for Delta variant of SARS-
        COV2 is much higher at around 6. The R0 for RSV may be around 3.5 so it is
        quite infectious and most children are infected in the first two years of life.
    11. There are other viruses like the common cold (especially rhinovirus),
        parainfluenza, adenovirus and metapneumovirus, that can cause acute
        respiratory illness and lead to hospital admissions which are not explicitly
        considered here.
    12. It may be that we move beyond modelling respiratory viruses to including
        scenarios for impacts of other viruses like norovirus which often lead to
        problems in the health system during the busy winter period if hospital bed
        bays or wards need to be closed due to outbreaks.
    13. It may also be useful to model excess winter deaths from other causes like
        CVD, COPD and fractures related to falls.
    14. With any models, we can start with simple models and refine them over time.
        Modelling is always an iterative process but even simple models can produce
        useful results if they give a possible outcome space that the system can
        expect. For instance, if a model suggests that respiratory viruses will occupy
        between 500 and 2,000 beds on 1st December, this is a wide range but is still
        useful for preparations. Once we know the dominant strains of influenza that
        are in circulation, models can be updated.
    15. Modelling shared with JCVI has suggested that the 2021-22 flu season could
        be 50%-100% higher than a typical season and could peak at a different
        time.1
    16. The scenarios in this report suggest that we may see greater than normal
        sized flu and RSV seasons, which may be shifted in time from their normal
        peaks. When combined with other pressures on the NHS this may pose
        particular challenges.

1JCVI interim advice: potential COVID-19 booster vaccine programme winter 2021 to 2022 - GOV.UK
(www.gov.uk)

                                              3
17. Continued surveillance of infections in schools, supply, uptake and
       effectiveness of vaccines, and impact and spread of covid variants and other
       virus types, is crucial in helping to understand what trajectory Wales is
       following.

   2. Respiratory Syncytial Virus modelling
RSV is a virus that affects people of all ages but typically infects up to 90% of
children in the first two years of life, and some children get acutely ill and require
hospital treatment. RSV causes bronchiolitis – inflammation of the lungs, dry cough,
and breathing problems. There is some protection against severe illness in infants in
the early weeks of life, due to transplacental antibody transfer in third trimester of
pregnancy. The monoclonal antibody treatment Palivizumab is given to some high
risk infants (mainly those born premature) to prevent severe RSV illness. This is
given as a monthly injection in the RSV season.

RSV immunity through previous infection usually wanes quite quickly. Evidence
suggests that young children are often infected by older siblings but children without
older siblings are still infected, presumably from other children or adults. RSV
season usually starts in September and peaks in November-December. There were
very few cases of RSV detected in the 2020/21 season due to covid-19 social
distancing so there is concern over a large rebound in cases in 2021/22 as has been
observed in Australia and New Zealand; this may be in children aged 1-2 years who
have not yet been exposed to RSV, and with infants where maternal immunity is not
passed on due to lack of exposure to RSV in the mother.

Current data suggests RSV season has already started in Wales, 15 weeks early.
But this may be asynchronous across different parts of Wales. We looked at data for
bronchitis and bronchiolitis hospital admissions by age, LHB, hospital and date,
ICD10 and HRG for 2016-2020 and found that the shape of the epi curve for
admissions was remarkably similar by year and LHB – with hospital activity peaking
between 22nd November and 2nd December. The median length of stay is one day.
91% of admissions are age 0, 8% age 1, and very few admissions over age 5. The
data included zero day admissions which may be where children are observed for a
few hours then sent home.

Welsh Government RSV Modelling Scenarios

In Wales we have modelled 4 scenarios for pressures around paediatric bronchiolitis
which is mainly caused by RSV. These are:

   1. An earlier outbreak with a 50% increase in total number of RSV cases /
      admissions.
   2. An early, but normal or quieter than normal, RSV season (particularly if non-
      pharmaceutical Interventions are maintained).
   3. An earlier, larger outbreak with 100% increase in total number of RSV cases /

                                          4
admissions.
4. As scenario 3, but with the 2022 peak returned to normal timing
Since the RSV season has started early, these scenarios have been transposed 15
weeks earlier than they have been in previous seasons. For scenarios 1-3, both the
2021 and 2022 seasons start 15 weeks early, but in scenario 4, the 2022 season
returns to normal timing. While it is unlikely that the 2022 season will start as early as
the 2021 season, it is also not known when winter viruses will return to normal
seasonality.
The results are shown below. These produce a possible peak of 336-672 hospital
admissions per week that would have occurred around mid-August 2021. These
admissions include zero day admissions. The PICU scenarios are based on a
proportion of admissions so might be higher if the admissions.
Figure 1. Comparison of RSV hospital admissions scenarios for Wales, based on
previous hospital admissions data.
Weekly admissions
800
700
600
500
400
300
200
100
0
2021-10
2021-43
2022-44
2021-01
2021-04
2021-07
2021-13
2021-16
2021-19
2021-22
2021-25
2021-28
2021-31
2021-34
2021-37
2021-40
2021-46
2021-49
2021-52
2022-02
2022-05
2022-08
2022-11
2022-14
2022-17
2022-20
2022-23
2022-26
2022-29
2022-32
2022-35
2022-38
2022-41
2022-47
2022-50
2022-53
Scenario 1 Scenario 2 Scenario 3 Scenario 4
5Figure 2. Comparison of RSV paediatric intensive care (PICU) scenarios for Wales,
based on previous hospital admissions data.
Weekly PICU admissions
30
25
20
15
10
5
0
2021-31
2022-41
2021-01
2021-04
2021-07
2021-10
2021-13
2021-16
2021-19
2021-22
2021-25
2021-28
2021-34
2021-37
2021-40
2021-43
2021-46
2021-49
2021-52
2022-02
2022-05
2022-08
2022-11
2022-14
2022-17
2022-20
2022-23
2022-26
2022-29
2022-32
2022-35
2022-38
2022-44
2022-47
2022-50
2022-53
Scenario 1 Scenario 2 Scenario 3 Scenario 4
Academy of Medical Sciences (AMS) RSV Modelling Scenarios
The Academy of Medical Sciences (AMS) have recently published a winter planning
report, “COVID-19: Preparing for the future”. The paper explores the health and
social care challenges we may be facing over the coming winter and beyond. It
includes a range of modelled scenarios for winter 2021/22 for COVID-19, influenza
and respiratory syncytial virus (RSV). We are grateful to Dr Alexandra Hogan from
Imperial College London for sharing the model and discussing the results with us.2
The AMS paper considers two RSV scenarios:
1. In Scenario 1, they assume that maternal protection decays over the period
that behavioural and environmental interventions are in place due to a lack of
exposure. In this scenario, a peak outbreak would be roughly 2 times the
magnitude of a normal year, with an increase of
65% in cases in children2. In Scenario 2, they assume no change in pre-existing levels of maternal
protection. In this scenario, a peak outbreak would be roughly 1.5 times the
magnitude of a normal year, with an increase of
25% in cases in childrenFigure 3. Comparison of RSV hospital admissions scenarios for Wales, based on
previous hospital admissions data (AMS scenarios)
Weekly admissions
700
600
500
400
300
200
100
0
2021-01
2021-04
2021-07
2021-10
2021-13
2021-16
2021-19
2021-22
2021-25
2021-28
2021-31
2021-34
2021-37
2021-40
2021-43
2021-46
2021-49
2021-52
2022-02
2022-05
2022-08
2022-11
2022-14
2022-17
2022-20
2022-23
2022-26
2022-29
2022-32
2022-35
2022-38
2022-41
2022-44
2022-47
2022-50
2022-53
Scenario 1 Scenario 2 Scenario 3
Figure 4. Comparison of RSV paediatric intensive care (PICU) scenarios for Wales,
based on previous hospital admissions data (AMS scenarios)
Weekly PICU admissions
40
35
30
25
20
15
10
5
0
2021-25
2022-35
2021-01
2021-04
2021-07
2021-10
2021-13
2021-16
2021-19
2021-22
2021-28
2021-31
2021-34
2021-37
2021-40
2021-43
2021-46
2021-49
2021-52
2022-02
2022-05
2022-08
2022-11
2022-14
2022-17
2022-20
2022-23
2022-26
2022-29
2022-32
2022-38
2022-41
2022-44
2022-47
2022-50
2022-53
Scenario 1 Scenario 2 Scenario 3
Scenario 1 (lower) Scenario 2 (lower) Scenario 3 (lower)
Scenario 1 (higher) Scenario 2 (higher) Scenario 3 (higher)
3. Influenza modelling
Trying to predict the volume of healthcare activity related to seasonal influenza is
very difficult. It may be best to have scenarios for what a high, mid and low flu
season looks like and then track which scenario we are closest to. For instance
2017/18 is a recent example of a flu season that produced a lot of hospital pressures
and deaths.
8Flu seasons vary with some flu types, subtypes and clades producing different
effects in terms of the balance between primary and secondary care pressure, which
is partly related to severity by age, as well as vaccine match and uptake. The
2010/11 flu season (the third wave of the A(H1N1)pdm09 pandemic) was the most
intense in terms of primary care consultations and perhaps younger adults being
admitted to hospital, but the 2014/15 and 2017/18 flu seasons (both due to newer
A(H3N2) clades) were much worse in terms of respiratory-related mortality and care
home outbreaks. Cold weather can make a difference as well. The GP signal in
2014/15 brushed ‘medium’ levels of intensity, but the winter mortality was the worst
seen in more than 20 years.
We have received influenza modelling from the University of Warwick that was used
by JCVI around influenza decision making. We also have influenza scenarios from
the AMS report.
9Figure 3 shows the relative number of influenza health episode occurrences in a flu
season following a suppressed flu season, compared to a no COVID-19
counterfactual scenario (with no alterations to population mixing patterns in the
previous flu season). The University of Warwick modelling suggests that outcomes
such as cases, hospital and deaths are almost certain to be higher in a flu season
following a suppressed flu season (e.g. winter 2020/21), with counts up to two times
a normal flu season plausible.
10Figure 3. Age-stratified health episode occurrences (influenza) relative to the no
COVID-19 counterfactual scenario. Each age grouping is measured relative to the
outcomes attained for that age grouping under the counterfactual scenario. White
squares represent the medians. Solid black lines the interquartile range. Results are
produced accounting for both low- and at-risk groups.
Source: Hill and Keeling, 2021 University of Warwick (unpublished report to JCVI).
Based on Hill et al, 2020 3
Academy of Medical Sciences influenza modelling
Welsh Government received data from Professor Azra Ghani, Imperial College, of
the AMS influenza modelling which was based on Princeton’s influenza modelling. 4
Applying the Princeton modelling to the UK, this gives a reasonable worst-case
scenario with an influenza epidemic could be between 1.5 and 2.2 times the
magnitude of a ‘normal’ year. These outbreaks may reach peak numbers in the
winter, increasing the burden to healthcare systems at a time when admissions
3Hill et al (2020) Optimising age coverage of seasonal influenza vaccination in England: A
mathematical and health economic evaluation. PLoS Comput Biol 16(10): e1008278.
https://doi.org/10.1371/journal.pcbi.1008278
The impact of COVID-19 nonpharmaceutical interventions on the future dynamics of
endemic infections | PNAS4
11related to cold weather may have increased, at the same time as the NHS is trying to
tackle a backlog in elective activity. It may also be that a winter wave in covid
pressure occurs at the same time. High rates of influenza will also increase the
pressure on TTP as flu symptoms are very similar to covid symptoms.
Figure 4. Wales apportioned model of AMS flu scenarios, total cases per week.
4. Summary
This paper has outlined some potential scenarios of influenza and RSV. Because of
‘immunity debt’ due to a lack of infection during the pandemic, we may see a bigger
than normal RSV and flu season which may also be shifted outside of the regular
winter peak times. This may also co-occur with covid related pressure on the NHS,
and cause diagnostic uncertainty and increased pressure on TTP. Having more
scenarios and tracking these scenarios against surveillance data will be important
this winter. In the future the ambition is to have combined scenarios of pressure from
all respiratory viruses, which varies in which part of the system it is felt (primary vs
secondary care) and the age groups that are most affected by these viruses – so
RSV is mainly very young children, influenza mainly young children and older adults,
12and covid-19 may be different again with high rates of vaccination uptake across the
population.
The data for these scenarios can be shared with LHBs so that they can take a
proportion of them to see what they mean for their own localities. In future, it would
be useful to also model flu mortality and critical care demand.
Thank you
Thank you to the Academy of Medical Sciences for sharing their data, and in
particular to Professor Azra Ghani and Dr Alexandra Hogan (Imperial College
London) for their help with this work. Thank you to Dr Ed Hill from University of
Warwick for his help with this work.
13You can also read