Symposium: insect decline and conservation Review Butterflies Australia: a national citizen science database for monitoring changes in the ...
←
→
Page content transcription
If your browser does not render page correctly, please read the page content below
bs_bs_banner

Austral Entomology (2021) 60, 111–127

Symposium: insect decline and conservation

Review
Butterflies Australia: a national citizen science database for monitoring changes
in the distribution and abundance of Australian butterflies
Chris Sanderson,1 Michael F Braby1,2*                            and Suzi Bond2,3
1
 Division of Ecology and Evolution, Research School of Biology, The Australian National University, Acton, ACT 2601,
Australia.
2
 Australian National Insect Collection, GPO Box 1700, Canberra, ACT 2601, Australia.
3
 The Fenner School of Environment and Society, The Australian National University, Acton, ACT 2601, Australia.

Abstract                    Conservation biology is a field of science that is heavily biased against insects and allied invertebrates, largely due to a
                            data deficiency feedback loop that maintains a cycle of ignorance and inaction. Because many invertebrate groups
                            are, and remain, extremely data poor, it is frequently difficult to conduct even the most basic conservation actions,
                            such as status evaluation, listing, recovery and monitoring of threatened species. Thus, declines and extinctions of
                            invertebrates are frequently undetected and poorly documented. To address this data deficiency, we have developed
                            a new national database – Butterflies Australia – for one insect taxon that integrates citizen science (data collectors)
                            with global, standardised monitoring protocols and emerging tools in technology and biodiversity informatics. The
                            database is created from a platform, which consists of a phone app and website, that offers the potential to rapidly
                            increase data availability on the occurrence of Australian butterflies at a far greater scale than was previously possible,
                            as well as to monitor trends in their distribution and abundance over time. We discuss the attributes and importance of
                            successful citizen science projects and quantitative methods for monitoring butterflies, both from an Australian per-
                            spective and in an international context, and then outline the operational aspects of the Butterflies Australia platform.
                            A review of survey methods that have been used for monitoring or inventorying butterflies in Australia over the past
                            50 years revealed a diverse array of sampling techniques, with little standardisation between studies and wide varia-
                            tion in space (sampling unit) and time (sampling effort). Transect counts, in particular, have rarely followed the inter-
                            national guidelines recommended for standardised global butterfly monitoring. Finally, we discuss the benefits of our
                            new citizen science tool for butterflies and potentially other invertebrates. We envisage that our platform will engen-
                            der increased community awareness, improved quantity and quality of data collection, better conservation policy and
                            planning, as well as enhanced resourcing and research for the conservation management of butterflies.
Key words                   Atlas of Living Australia, BioBlitz, biodiversity informatics, butterfly conservation, eButterfly, invertebrate
                            conservation, Lepidoptera, phone app.

IN TR ODUCTION                                                                   Environment Protection and Biodiversity Act (EPBC Act), but
                                                                                 only 0.04% (40 species) of invertebrates are listed as
Conservation biology is a field of science that is heavily biased
                                                                                 threatened under the same conservation schedule (Walsh
towards vertebrates, both in terms of total funding allocation
                                                                                 et al. 2013; Taylor et al. 2018). Assuming that the proportion
and average expenditure invested per species. Whereas birds
                                                                                 of threatened species is roughly equal across taxonomic groups
and mammals receive the major share of resources, insects and
                                                                                 (at 16.6% – Walsh et al. 2013), then invertebrates are
allied invertebrates receive comparatively little conservation
                                                                                 under-represented by several orders of magnitude. Similar
attention (Cardoso et al. 2011b; Braby 2018). This taxonomic
                                                                                 taxonomic bias exists in species with national recovery plans,
bias in attention is clearly apparent when one compares the
                                                                                 with only 22% of threatened invertebrates with a recovery plan
proportions of species evaluated for their conservation status,
                                                                                 compared with 58–65% for listed species of birds and
with only 0.5% of the worlds described arthropod species evalu-
                                                                                 amphibians and 42% for mammals and fish (Walsh
ated (Cardoso et al. 2011a; Cardoso et al. 2011b). In Australia,
                                                                                 et al. 2013). Even butterflies, which are the best studied
12–24% of all species of mammals, birds and amphibians have
                                                                                 invertebrate group in Australia, are under-represented in interna-
been listed as threatened (i.e. critically endangered (CR),
                                                                                 tional and national threatened species lists. For example, the
endangered (EN) or vulnerable (VU)) under the national
                                                                                 Action Plan for Australian Butterflies (Sands & New 2002)
           *michael.braby@anu.edu.au                                             identified only six species as threatened nationally, but a further
© 2021 Australian Entomological Society                                                                                          doi: 10.1111/aen.12513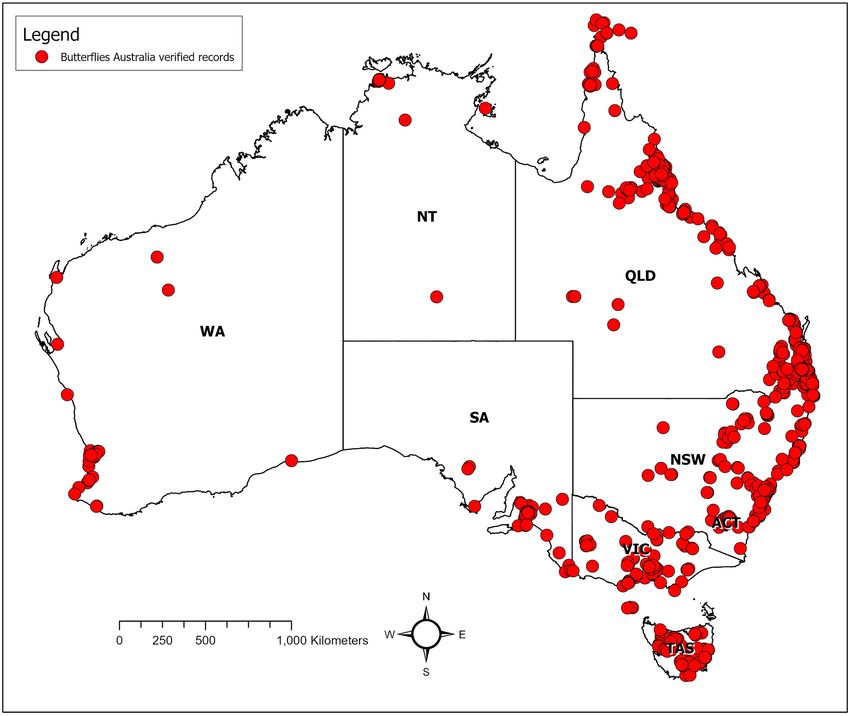
112     C Sanderson et al.
56 taxa were classified as data deficient at various spatial scales.    is to enlist and foster citizen science and biodiversity informatics
Currently, only 10 species or subspecies of Australian butterflies     programs (Cardoso et al. 2011b; Harvey et al. 2020). Here, we
(1.6% of the total 614 taxa) are listed as threatened (3 CR, 7 EN     have borrowed ideas from the taxonomic group that receives
and 0 VU) under the IUCN Red List or EPBC Act (Taylor                 much of the conservation attention globally – birds – in an
et al. 2018). A further 20 taxa have been assessed as threatened      attempt to address the significant shortfall in data availability
but only at smaller, regional scales under various state-based        for use in conservation for butterflies. eBird, for example, is a
legislation. Thus, declines and extinctions of insects and other      global data gathering initiative that has grown to collect more
invertebrates are frequently unknown, poorly documented and           than a hundred million observations of bird records each year
grossly underestimated (Woinarski et al. 2019).                       by a vast network of citizen scientists (Sullivan et al. 2014;
    This general lack of knowledge or impediment in invertebrate      eBird 2020). Butterflies, like birds, have wide appeal to the
conservation (Cardoso et al. 2011b) creates a negative feedback       general public (the ‘charisma’ effect) and thus are readily
loop (Oberprieler et al. 2019), which we refer to as the ‘data        accepted as subjects worthy of conservation attention.
deficiency feedback loop’ (Fig. 1). Essentially, a lack of under-          In this overview, we highlight the importance of citizen
standing of the importance of invertebrates among the general         science as a collaborative mechanism for data collection on a scale
public and policymakers, together with limited knowledge about        that was previously not possible and then review and discuss the
their taxonomy and patterns of diversity, distribution and            quantitative field survey methods and sampling protocols by
abundance, means that invertebrates are typically excluded from       which that data have so far been collected for monitoring or
faunal inventory and monitoring surveys (the data collection          inventorying Australian butterflies in an international context.
phase). Consequently, invertebrates are rarely considered in con-     We then introduce a new tool – Butterflies Australia – for citizen
servation policy and planning because they are poorly known or        scientists to collect, submit and verify data records via means of a
data deficient. However, because they are excluded from such           phone app and web-based platforms. Finally, we discuss the ben-
surveys and subsequent conservation programmes, invertebrates         efits of the Butterflies Australia platform and how we envisage it
are unlikely to attract funding, resources or scientific research,     will break the data deficiency feedback loop.
consigning them to remain poorly known and data deficient, thus
completing the negative feedback loop (Fig. 1). Consequently,
many invertebrates are, and remain, extremely data poor, making       CI T IZ E N S C IE N C E
it impossible to conduct even basic conservation actions of threat-
ened species, such as conservation status evaluation, listing, re-    Citizen science involves public participation and collaboration in
covery or management actions and monitoring (Braby 2018).             scientific research with the aim to increase scientific knowledge
Additionally, this may lead to the loss of available expertise in     (ACSA 2020). It includes the engagement of volunteers in
the impacted taxonomic groups as opportunities to work as a pro-      professional research so that there is a partnership between the
fessional taxonomist disappear due to lack of funding, which may      public and the professional scientific community (Walker 2013,
have flow on effects to other policy areas such as biosecurity         2015). Essentially, citizen scientists are the volunteers who
(Taxonomy Decadal Plan Working Group 2018).                           collect and/or process data as part of a broader scientific enquiry
    There is a pressing need to break this data deficiency feed-       (Silvertown 2009). Any member of the public, from children to
back loop so that conservation policy and planning can be appro-      senior citizens, can take part in citizen science, and during the
priately informed by robust data on invertebrates. One approach       past two decades, there has been an unprecedented explosion
                                                                      of activity, especially in the biological sciences, including
                                                                      conservation biology. Silvertown (2009) attributes this rapid
                                                                      growth of citizen science to three factors: (1) the development
                                                                      of the internet, together with the rise of new software tools and
                                                                      technology (laptop computers, mobile devices, etc.); (2) recogni-
                                                                      tion by professional scientists that volunteers represent a free
                                                                      source of labour capable of collecting large volumes of unbiased
                                                                      data; and (3) funding providers increasingly imposing upon
                                                                      grant holders to undertake public outreach as a form of ‘public
                                                                      accountability’ of their science. Another factor may be the steady
                                                                      decline of employed professionals to collect basic data and the
                                                                      concomitant loss of support services in recent decades, resulting
                                                                      in increased administrative burden placed on scientists.
                                                                          Throughout history, citizen scientists have always made
                                                                      important contributions to science, but citizen science has now
                                                                      moved to the point that it is part of mainstream science and
                                                                      culture, such as in parts of the Northern Hemisphere (Europe
                                                                      and North America) where it is the primary form of observa-
Fig. 1. The data deficiency feedback loop in invertebrate              tional science (Walker 2015). The success of citizen science rests
conservation.                                                         on several key principles (Silvertown 2009; New 2010; Tulloch
© 2021 Australian Entomological Society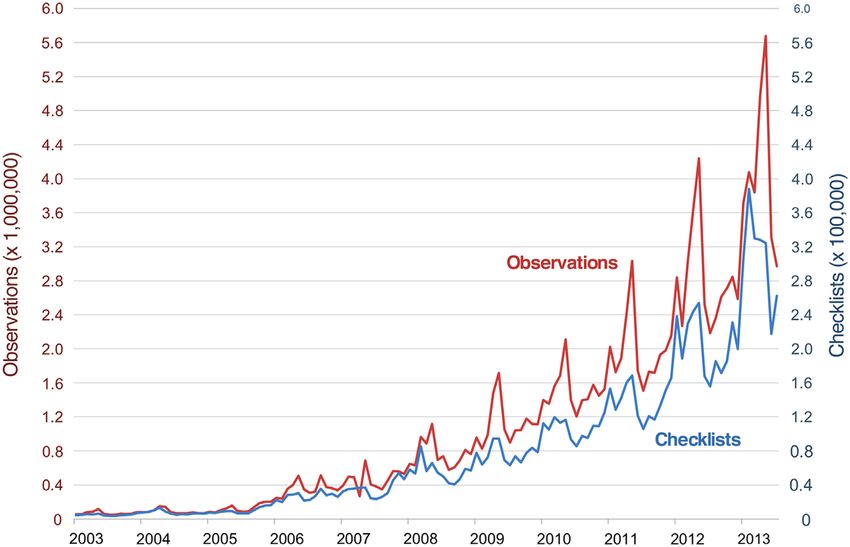
Butterflies Australia          113
Table 1     The 10 key principles for successful citizen science adopted by the Australian Citizen Science Association (ACSA 2020)

1. Citizen science projects actively involve citizens in scientific endeavour that generates new knowledge or understanding.
2. Citizen science projects have a genuine science outcome.
3. Citizen science provides benefits to both science and society.
4. Citizen scientists may participate in various stages of the scientific process.
5. Citizen scientists receive feedback from the project.
6. Citizen science, as with all forms of scientific inquiry, has limitations and biases that should be considered and controlled for.
7. Where possible and suitable, project data and metadata from citizen science projects are made publicly available, and results are published in an open access
   format.
8. Citizen scientists are suitably acknowledged by projects.
9. Citizen science programmes offer a range of benefits and outcomes, which should be acknowledged and considered in project evaluation.
10. The leaders of citizen science projects take into consideration legal and ethical considerations of the project.

et al. 2013). The Australian Citizen Science Association                          are hugely important and vital in the interactive learning experi-
(ACSA 2020) in conjunction with the European Citizen Science                      ence. Some citizen science platforms have a deliberate emphasis
Association has adopted 10 of these principles that they consider                 on the creation of an ‘online community’, which can foster a
underpin good practice in citizen science (Table 1). In addition to               friendly space for participants to chat, interact and learn. Volun-
these principles, it is critical that the data are validated and that             teers willing to contribute their skills, time and money towards a
the methods of data collection be standardised and well designed                  project will only do so if they see benefits – that it is scientifically
without bias. Also, the platform should be relatively easy and fun                worthwhile, rewarding and a healthy/social experience and that
to use to encourage continual usage. Importantly, citizen scien-                  it provides a sense of purpose. They may also wish to become in-
tists need to understand the underlying reason or question behind                 volved in citizen science programmes simply from a desire to
the scientific inquiry (i.e. the bigger picture), and they must re-                achieve direct action where they can see none being taken by lo-
ceive feedback on their contribution as a reward for participation.               cal authorities. For others, the greatest reward comes in the form
    The importance of data quality through a moderation or vet-                   of scientific discovery – the thrill of finding something new, un-
ting process is outlined below (see Butterflies Australia).                        usual or rare and to share that experience. A successful citizen
Moderation of records ensures not only high data quality but                      science project will cater for these different motivations while
also confidence in the database in which the data are curated.                     still adhering to the 10 key principles (Table 1), as well as ensur-
Training and skill development of volunteers may be required                      ing high data quality and good communication.
for some projects with regard to data collection. The importance                      The field of biodiversity informatics has seen a dramatic in-
of volunteer training is exemplified by the Small Ant-blue                         crease in data collection and analysis in recent decades, particu-
Acrodipsas myrmecophila in the Australian Capital Territory                       larly with regard to mapping the spatial distribution of species
(ACT). Acrodipsas myrmecophila is a rare, myrmecophagous                          (Jetz et al. 2012). Central among these is the Global Biodiversity
lycaenid butterfly that is obligatorily associated with a specific                  Information Facility (GBIF 2020), which is an international bio-
ant, Papyrius sp. (Britton 1997). In the ACT, A. myrmecophila                     diversity aggregator into which many data sets feed. Currently,
was previously known only from a single record (a male                            GBIF holds around 1.6 billion occurrence records. Two other
collected from near Uriarra Hill in November 1991 by R. A.                        globally important citizen science platforms are eBird (2020)
Eggleton) (Braby 2000), but it was not known from Canberra                        and iNaturalist (2020). eBird is an international platform devel-
until 2018 when a breeding site was discovered serendipitously                    oped by Cornell University for submitting records on birds
by a citizen scientist. Subsequently, citizen scientists underwent                (Sullivan et al. 2014); it sets the gold standard for engaging cit-
a day of training on how to identify the butterfly, as well as                     izen scientists on a global scale, with over 140 million records
how to find and identify its immature stages (eggs and pupal                       submitted during the first decade (Fig. 2). Currently, more than
cases). The citizen scientists were also trained on how to search                 100 million bird observations are contributed annually to eBird
for and identify nests of the attendant ant. The outcome of this                  by citizen scientists around the world, and this exponential
programme was that six new butterfly breeding sites (and over                      growth in data accumulation is typical of projects that adhere
500 ant nests!) were discovered by volunteers and mapped                          to the key guiding principles noted above. iNaturalist is another
across the remnant grassy woodlands in Canberra Nature Park                       international citizen science platform for submitting biodiversity
reserves and adjacent areas in New South Wales. This survey                       records; currently, it has collected 47 million records for 292 000
work led to a substantially improved understanding of the                         species in the 12 years since its inception in 2008.
spatial distribution and conservation management requirements                         Nationally, the most important citizen science bioinformatics
of A. myrmecophila, as well as greater appreciation by the local                  platform in Australia is the Atlas of Living Australia
community about the complex ecological requirements of the                        (ALA 2020), with currently around 90 million occurrence re-
species (Bond 2019).                                                              cords. It aggregates data sets from regional databases (>8000);
    Communication and feedback between professional scien-                        however, individual citizens can no longer upload data directly
tists or volunteer experts (moderators) and their citizen scientists              to ALA – instead, they are directed to a link to iNaturalist on
are a key component in the success of any citizen science project.                the ALA website to submit observations. Significant regional cit-
Congenial conversations between data collectors and data users                    izen science bioinformatics platforms in Australia are Canberra
                                                                                                                     © 2021 Australian Entomological Society
114 C Sanderson et al.
Fig. 2. The exponential growth of citizen science data collected by eBird during the first decade since its inception in 2003
(source: Sullivan et al. 2014). The graph shows the number of observations and checklists (species lists) submitted monthly from 2003 to
2013. The amount of data increased annually by 30–40%, with a cumulative total of over 140 million observations submitted by mid-
2013. Currently, eBird (2020) is generating around 140 million observations per year.
Nature Map (2020) and BioBlitz (2020), among others. Williams 1996). Notable examples of citizen science activities
Canberra Nature Map started in 2014 as a website to map rare include Courtenay Smithers’ pioneering efforts on butterfly
plants in the Australian Capital Territory, but it quickly expanded migration and mark–release–recapture (MRR) studies on
to cover all flora and fauna in the ACT and adjacent areas. It now Danaus plexippus in the 1960s–1970s (Peters 2012). Monitor-
belongs to the NatureMapr platform, which covers several ing, ecological restoration and conservation management of
regions outside Canberra. Local experts moderate data records, three flagship butterfly species over the past three decades have
which are then migrated to ALA. BioBlitz manages snapshot been largely undertaken by citizen science groups: the Friends of
biodiversity surveys undertaken by professional scientists in the Eltham Copper Butterfly for Paralucia pyrodiscus
conjunction with citizen scientists that target a specific area (New 2011), the Richmond Birdwing Conservation Network
during a fixed time period. BowerBird was a natural history for Ornithoptera richmondia (Sands & New 2013) and an infor-
website dedicated to citizen science, and it was released and mal group for the Purple Copper Paralucia spinifera (Baker
launched in 2013 with the intention of being an online version et al. 1993; Nally 2003; Mjadwesch & Nally 2008; New 2010).
of a traditional field naturalist club, with mentoring of newer
members by more experienced members (Walker 2013, 2015).
It has now closed, with its content moved to iNaturalist BUTTERFLY MONITORING
and ALA.
Butterflies have had a long history of citizen science partici- Monitoring is the systematic collection of data in a standardised
pation, particularly in the Northern Hemisphere, but this uptake manner at regular intervals over time (Spellerberg 2005). Lovett
has yet to be fully realised in countries like Australia et al. (2007) define environmental monitoring as a time series of
(New 2010). The UK Butterfly Monitoring Scheme measurements (of physical, chemical and/or biological
(UKBMS 2020) is perhaps the best known long-term citizen variables) designed to answer questions about environmental
science monitoring project for butterflies, which has been change. Monitoring, in a biodiversity context, is the tool by
running since 1976 (Asher et al. 2001; Thomas 2005). In North which one can determine if the natural assets of a site or location
America (Canada and USA), eButterfly (2020) is a relatively are changing over time from a predetermined standard (base-
new initiative modelled on eBird, and it has been a highly line), typically in relation to key threatening processes (habitat
successful citizen science platform for submitting butterfly data loss or deterioration, invasive species, pollution, climate change,
since its inception in 2012 (McFarland et al. 2015; Prudic etc.), habitat restoration or natural ecological succession (Stork
et al. 2017). In Australia, participation of citizen scientists in et al. 1996; Samways 2005). Moreover, monitoring provides
butterfly natural history and conservation has, up until now, been the early warning signal of detrimental change, and thus, it
on a much smaller scale and mostly centred around migration provides the hard evidence for intervention and other informed
(Smithers 1972, 1977, 1978, 1983a, 1983b, 1985) and recovery management decisions (Lindenmayer & Gibbons 2012).
teams for threatened species under various state-based In conservation biology, the two variables that are most
conservation schedules (New & Yen 1995, 2013; frequently monitored are: (1) the spatial distribution of species,
© 2021 Australian Entomological SocietyButterflies Australia 115
to assess changes in occupancy, geographic range size or geo- van Swaay et al. (2015) published an international set of
graphic range boundaries (usually inferred from atlas mapping guidelines for standardised monitoring of butterflies. They rec-
or recording schemes), and (2) the abundance of species, to as- ommended two primary methods for monitoring adult butter-
sess changes in relative abundance or absolute population size flies: (1) transect counts, and (2) fruit baiting (for tropical
(usually derived from population monitoring schemes) forest species). However, other (supplementary) methods, such
(Thomas 2005; van Swaay et al. 2008; Jetz et al. 2012). How- as point counts, area counts, MRR and counting other life stages
ever, other components of biodiversity may be monitored, such (e.g. larvae), can be used depending on the habitat or target spe-
as species richness and composition. In some cases, it may be cies (see van Swaay et al. 2015). The methods are standardised
important to monitor certain biological attributes of species, such and quantitative, based on specific dimensions in space (the sam-
as their phenology, sex ratio, movement patterns and migration pling unit) and time (the sampling effort) and repeated at various
or aggregation behaviour. time intervals (the survey effort), so that the data collected are ro-
Among insects, butterflies have been widely used in monitor- bust for statistical analysis in order to detect changes over time.
ing programmes, particularly in the Northern Hemisphere In Australia, various quantitative sampling methods have
(Europe, North America and parts of Asia), to assess long-term been used for monitoring or inventorying butterflies to estimate
changes in occupancy or distribution and abundance abundance and/or species richness over the past 50 years
(Thomas 2005; van Swaay et al. 2008; van Swaay et al. 2015). (Table 2). Of the 48 studies reviewed, transect counts have been
Butterflies have many desirable attributes that are useful for most popular (42%), but MRR and point counts or area counts
monitoring such biological variables: their taxonomy is have frequently been used (Table 2). Novel methods, such as
relatively well-understood, most species are relatively easy to the use of malaise traps (Ginn et al. 2007), and capture rates
identify, they are day flying and relatively conspicuous, the life based on sweep netting have also been deployed. Fruit baiting
history and general biology are well-documented, and informa- has rarely been used (Braby 1995b; Sambhu et al. 2018), mainly
tion is available on the ecology for most species (Thomas 2005; because few butterflies in Australia specialise on fermented
McGeoch 2007; Gerlach et al. 2013). fruits (Braby 2000). Three studies dealing with threatened spe-
In Australia, butterfly monitoring is still in its infancy, and the cies (Braby 2010; Andren & Cameron 2012, 2014; Taylor 2014)
science has not reached the level of maturity seen in countries mainly focused on mapping the spatial distribution based on oc-
like the UK or USA (Braby & Williams 2016). Although there cupancy surveys (presence/absence data) and then estimating the
has been progress towards compiling atlases based on point data occupancy rate, as well as the extent of occurrence and/or area of
for some regions (Crosby 1986; Virtue & McQuillan 1994; occupancy. Several studies (Hill 1992, 1995; Haywood &
Gullan et al. 1996; Braby et al. 2018), fine-scale distributional Wilson 2002; Collier et al. 2006; Franklin 2011; Kennedy 2020)
mapping schemes designed to record spatial changes over broad claim to have used the Pollard walk, which follows standardised
geographical scales are yet to be realised (Dunn & Dunn 1991). criteria in terms of dimensions of the sampling unit and sampling
At one level, the geographical range of Australian butterflies is effort, time of day and prevailing weather conditions, but closer
reasonably well known (e.g. see expert range maps in examination of these papers revealed widespread misunder-
Braby 2016); however, the vast majority of spatial data about standing of the criteria, particularly those for the sampling unit.
species distributions is not readily available in an electronic for- The Pollard walk (Pollard et al. 1975; Pollard 1977; Pollard
mat or has not been integrated, being scattered in specimens in & Yates 1993) is a specific type of transect counting method
museum and private collections, field notebooks of collectors and the one recommended as the international standard for mon-
and private databases, as well as the scientific and grey literature. itoring butterflies (van Swaay et al. 2015). It involves walking
Similarly, monitoring of populations in Australia to assess tem- along a fixed route or transect (typically 300–1000 m in length)
poral trends in relative abundance typically has been short term at a slow, constant pace (~1 km/45–60 min or 100 m/5–6 min or
(≤3 years) and usually not designed to determine if there are tem- 17–22 m/min) and counting all the butterflies in an imaginary
poral trends against a standard baseline, either locally, regionally cube of 125 m3 (i.e. 2.5 m either side, 5 m above ground and
or nationally (Table 2). Exceptions to this are perhaps the 5 m in front of the observer). Butterflies observed outside the
pioneering study by Smithers (1972) (4.5 years) and two studies imaginary cube are recorded as incidentals. Binoculars, camera
(Newland 2006; Bell 2014) that conducted replicated, snapshot or sweep net (to catch and release specimens) can be used to
surveys 12 years apart specifically to examine the impact of assist with identification, but counting should cease when the
key threatening processes. There are, however, several observer is stationary as this will affect the sampling effort.
long-term studies (7–30 years) of individual species or assem- Weather conditions and temporal factors are important
blages currently in progress that have not yet been formally pub- criteria for successful butterfly monitoring, and the variables of
lished. These population monitoring studies include the butterfly temperature, cloud cover, wind, time of day and time of year
fauna of the ACT (7 years: S. Bond unpubl. data), the butterfly all need to be considered. Pollard (1977) recommended that sur-
assemblage at Penambol Conservation Park, South Australia veys be undertaken only in suitable weather conditions, specifi-
(15 years: B. T. Haywood pers. comm. 2020), the threatened cally between temperatures of 13–17 °C during sunny weather
Ptunarra Xenica Oreixenica ptunarra in Tasmania (22 years: (≥60% sunshine) or above 17 °C regardless of cloud cover. van
Bell 1999, 2014, & pers. comm. 2020) and the threatened Swaay et al. (2015) incorporated these criteria into their set of
Eltham Copper P. pyrodiscus near Melbourne, Victoria (ca. global monitoring guidelines, noting a minimum temperature
30 years: A. Canzano & J. Harris pers. comm. 2020). of 13 °C and a maximum temperature of 33–35 °C for butterfly
© 2021 Australian Entomological SocietyTable 2 Summary of quantitative survey methods used for monitoring or inventorying butterflies (adult stage) in Australia
116
Method Sampling unit/sampling Survey effort Purpose Target species Reference
effort
Point count 46 m line/30 min 96 samples over 4.5 years (1 count To assess seasonal and annual changes Danaus plexippus Smithers (1972)
approx. per fortnight × 96 sampling in abundance
occasions × 1 site)
Point count 10 m radius of circle/20 min 108 samples over 17 months (2 To determine species richness and Assemblage (110 species) Hill et al. (1992)
sampling units × 3 counts per day × 6 composition among rainforest
C Sanderson et al.
sampling occasions × 3 sites) microhabitats
Point count ~6 m radius of circle/1–2 45 samples over 1 week (3 counts per To assess and compare abundance Paralucia pyrodiscus van Praagh (1996)
observers/12–20 min day × 3 sampling occasions × 5 sites) among sites
© 2021 Australian Entomological Society
Point count 3 m radius of circle/2 min 96 samples over 2 years (12 counts per To assess diurnal changes in abundance Croitana aestiva Palmer and Braby (2012)
day × 4 sampling occasions × 1 site, in relation to adult food sources
plus 12 counts per day × 2 sampling
occasions × 2 sites)
Area count 30 m × 10 m quadrat/20 min 54 samples over 17 months (3 counts To determine species richness and Assemblage (110 species) Hill et al. (1992)
per day × 6 sampling occasions × 3 composition among rainforest
sites) microhabitats
2
Area count 200 m quadrat/20 min 90 samples over 6 months (10 To compare abundance among Assemblage (61 species) Hill (1995)
sampling units × 1 count × 3 sampling rainforest microhabitats in relation to
occasions × 3 sites) corridors
Area count 50 m × 50 m quadrat/30 min 72 samples over 1 year (1 count per To compare species richness and Assemblage (18 species) Lomov et al. (2006)
month × 12 sampling occasions × 6 composition in relation to habitat
sites) restoration
Area count 200 m × 50 m quadrat/50 min 96 samples over 8 months (8 counts per To assess diurnal and seasonal changes Assemblage (43 species) M. F. Braby (unpubl. data)
day × 2 days × 2 sampling in species richness, composition and
occasions × 3 sites) abundance
Transect count 1870 m × 10 m × 5 m 84 samples over 3 years (1 count per To assess seasonal changes in Heteronympha merope Pearse (1978)
transect/time not given week × 28 sampling occasions per abundance
year × 3 years × 1 site)
Transect count 2100–3825 m × 10 m × 5 m 48 samples over 1 year (1 count per To determine temporal distribution of Assemblage (>60 species) Hill (1987, 1988)
transect/86–120 min month × 12 sampling occasions × 4 species richness
sites)
Transect count (Pollard walk) 1500 m × 5 m transect/30– 22 samples over 5 months (1 count per To assess seasonal changes in Geitoneura klugii, Braby and New (1989)
45 min week × 22 sampling occasions × 1 site) abundance Geitoneura acantha
Transect count 2100 m × 10 m × 5 m 45 samples over 2.5 years (1–2 counts To assess temporal changes in Hypochrysops apelles, Hill (1992)
transect/95 min per month × 30 sampling occasions × 1 abundance in relation to adult food Hypochrysops epicurus
site) resources
Transect count 500 m/20 min 60 samples over 1 week (1 count per To assess mate location behaviour of Hypolimnas bolina Rutowski (1992)
hour × 10 h × 6 sampling occasions × 1 males
site)
Transect count 2000 m × 8 m transect/ 12 samples over 12 h (1 count per To assess diurnal changes in abundance Tisiphone helena Braby (1993)
40 min hour × 12 h × 1 site)
(Continues)Table 2 (Continued)
Method Sampling unit/sampling Survey effort Purpose Target species Reference
effort
Transect count (Pollard walk) 1000 m × 5 m transect/ 390 samples over 22 months (1 To assess patterns of spatial distribution Assemblage (16 species) Braby (1995a)
40 min count × 2–3 sampling occasions × 170 and temporal abundance
sites)
Transect count (Pollard walk) 1000 m × 5 m transect/ 360 samples over 1 year (10 counts per To assess diurnal and temporal changes Assemblage (7 species) Braby (1995b)
40 min day × 3 days × 4 sampling in abundance in relation to habitats
occasions × 3 sites)
Transect count 100–150 m × 20 m transect/ 216 samples over 6 weeks (3 sampling To assess activity and compare Paralucia pyrodiscus van Praagh (1996) and Braby
~7 min units × 3 counts per day × 8 sampling abundance among sites et al. (1999)
occasions × 3 sites, at Eltham)
Transect count Space and time not given 13 samples over 13 months (1 sample To assess seasonal changes in Cephrenes augiades, Lyonns (1999)
per month × 13 sampling occasions × 1 abundance Cephrenes trichopepla
site)
Transect count 1020 m/time not given 96 samples over 1 year (1 count per To assess handling effects of mark– Hypolimnas bolina Kemp and Zalucki (1999)
hour × 7 h × 12 sampling occasions × 1 recapture on catchability of territorial
site) males
Transect count 1050 m × 10 m transect/ 23 samples over 6 months (1 count per To determine species richness, Assemblage (10 species) Haywood and Wilson (2002,
25 min week × 23 sampling occasions × 1 site) composition and abundance in relation and pers. comm. 2020)
to habitat condition
Transect count (Pollard walk) Space and time not given, 32 samples over 12 years (2 counts per To determine changes in species Assemblage (74 species) Newland (2006)
except width of transect month × 4 sampling occasions in richness, composition and abundance
(5 m) 1991–1992 × 1 site, plus 2 counts per in relation to habitat disturbance
day × 12 sampling occasions in 2003–
2004 × 1 site)
Transect count 1490–2450 m × 10 m 53 samples over 15 months (17–19 To assess and compare diversity, Assemblage (21 species) Collier et al. (2006)
transect/37–70 min counts × 3 sites) species richness and abundance in
relation to urban habitats
Transect count 155–5100 m × 10 m transect, 552 samples over 20 months (1 count To compare species richness and Assemblage (35 species) Williams (2008, 2009, 2011,
at 50–60 m/min per fortnight × ~8 sampling abundance in relation to fragmentation and pers. comm. 2020)
occasions × 34 sites, plus 2 sampling of urban habitats
units × 1 count per fortnight × ~8
sampling occasions × 12 sites)
Transect count 2900 m × 10 m × 5 m 23 samples over 14 months (2–3 To determine temporal distribution of Assemblage (29 species) Franklin (2011)
transect/90–120 min counts × 8 sampling occasions × 1 site) species richness and abundance
Transect count 210–1120 m × 10 m × 2 m >180 samples over 16 years (1 To assess changes in abundance Oreixenica ptunarra Bell (1999, 2014, and pers.
transect, at 50 m/min count × 2–5 sampling occasions per (population density) in relation to comm. 2020)
year × 6 years (1998–2002, 2014) × 15 threats
sites)
Transect count Space and time not given, 135 samples over 3 years (1 count per To assess seasonal changes in Oreixenica ptunarra Potter-Craven et al. (2018)
except width of transect week × 5 sampling occasions per abundance (population density) in
(10 m) year × 3 years × 9 sites) relation to impacts of threats
Butterflies Australia
(introduced wasps)
(Continues)
© 2021 Australian Entomological Society
117Table 2 (Continued)
118
Method Sampling unit/sampling Survey effort Purpose Target species Reference
effort
Transect count (Pollard walk) 1000 m × 5 m × 5 m transect/ 200 samples over 5 months (1 To compare species richness and Assemblage (14 species) Kurylo et al. (2020)
20 min count × 2 sampling occasions × 100 abundance in relation to intensification
sites) of urbanisation
Transect count 2000 m × 6 m × 3 m transect/ 30 samples over 3 years (1 count per To assess seasonal changes in Dispar compacta, Kennedy (2020)
time not given month × 10 sampling abundance Taractrocera papyria,
C Sanderson et al.
occasions × 3 years × 1 site) Ocybadistes walkeri
Occupancy survey Area variable, number 46 samples over 3 years (1 sample × 46 To determine occupancy and Euploea alcathoe Braby (2010)
captured or observed/2 sites) abundance
© 2021 Australian Entomological Society
observers/1.5 h
2
Occupancy survey Area variable (1–41 800 m 293 samples over 2.5 years (1 To determine occupancy Ocybadistes knightorum Andren and Cameron (2012)
patch size)/time not given sample × 293 patches)
Occupancy survey Area variable, number 37 samples over 2 weeks (1 To determine occupancy Jalmenus eubulus Taylor (2014)
observed/1–2 observers/15– sample × 37 sites)
160 min (x = 60 min)
MRR Not given 4 samples over 4 months (4 sampling To determine seasonal changes in Heteronympha merope Edwards (1973)
occasions × 1 site) population size and sex ratio
MRR ~200 m × 100 m quadrat/2 9 samples over 4 months (9 sampling To determine population size, sex ratio Euploea corinna Kitching and Zalucki (1981)
observers/15–20 min occasions × 1 site) and longevity
MRR 30 m × 30 m quadrat/30 min 9 samples over 5 months (1 sample per To assess seasonal changes in Danaus plexippus James (1981)
fortnight × 9 sampling occasions × 1 population size
site)
MRR 30 m × 10 m quadrat/3 h 6 samples over 3 months (1 sample per To determine population size and sex Danaus plexippus James (1982)
fortnight × 6 sampling occasions × 1 ratio
site)
MRR 110 m × 35 m quadrat/5 h 32 samples over 3 years (1 sample per To determine population size, sex ratio, Danaus plexippus James (1984a, 1984b)
fortnight × 8 sampling occasions per migration and other population
year × 2 years × 1 site, plus 1 sample parameters
per week × 16 sampling occasions × 1
site)
MRR Area not given/30–40 min 112 samples over 10 months (1 sample To determine seasonal changes in Danaus plexippus Zalucki and Kitching (1984)
per week × 19 sampling occasions × 4 population size and sex ratio and
sites, plus 1 sample per week × 18 estimate longevity and movement
sampling occasions × 2 sites) patterns
MRR 100 m × 50 m quadrat/5–6 h 60 samples over 5 months (1 sample To determine and compare seasonal Geitoneura klugii, Braby and New (1989)
per week × 20 sampling occasions × 3 changes in population size and estimate Geitoneura acantha
sites) longevity and movement patterns
2
MRR ~3 km /6 days 64 samples over 2 years (1 sample per To determine age structure and sex Tirumala hamata, Euploea Scheermeyer (1993)
fortnight × 16 sampling occasions per ratio and estimate longevity and corinna, Euploea tulliolus
year × 2 years × 2 sites) movement patterns
MRR and fruit baiting 5 traps/1000 m transect/ 4 samples over 1 year (4 sampling To assess seasonal changes in Mydosama terminus Braby (1995b)
3 days occasions × 1 site) population size
(Continues)Table 2 (Continued)
Method Sampling unit/sampling Survey effort Purpose Target species Reference
effort
MRR 120 m × 70 m quadrat/2 h 27 samples over 4 weeks (1 sample per To determine population size and Hypochrysops halyaetus Dover and
day × 17 sampling occasions × 1 site, estimate longevity and movement Rowlingson (2005)
plus 10 supplementary samples × 1 patterns
site)
Fruit baiting 11 traps/1000 m transect/ 108 samples over 1 year (3 sampling To compare species richness and Assemblage (49 species) Sambhu et al. (2018)
3 days units × 12 sampling occasions × 3 sites) abundance in relation to modified
landscapes
Malaise trapping 1 trap/5 days 96 samples over 2 years (12 sampling To determine efficacy of malaise traps Assemblage (17 species) Ginn et al. (2007)
occasions × 8 sites) as a sampling tool for monitoring
diversity
Other (sweep netting) 25 m radius of circle/number 16 samples over 3 months (4 sampling To determine abundance (population Danaus plexippus Bull et al. (1985)
captured/2–4 collectors/1 h/ occasions × 4 sites) density) and sex ratio
15 days
Other (sweep netting) Area and time not given, 24 samples over 2 years To assess seasonal changes in Eurema (5 species) Jones and Rienks (1987)
number captured/h abundance
Other (sweep netting) 100 m × 50 m quadrat, 60 samples over 5 months (1 capture To assess seasonal changes in Geitoneura klugii, Braby and New (1989)
number captured/5–6 h sample per week × 20 sampling abundance Geitoneura acantha
occasions × 3 sites)
Other (sweep netting) Area not given, number 29 samples over 2 years (1 capture To assess seasonal changes in Mycalesis perseus, Braby (1995b)
captured/5–12 h sample per 2–6 weeks × 29 sampling abundance Mydosama terminus,
occasions) Mydosama sirius
Other (sweep netting) Area not given, number 70 samples over 20 months (1 capture To assess seasonal changes in Cressida cressida Orr (1999)
captured/1 h sample per week × 35 sampling abundance
occasions per year × 2 years × 1 site)
Dimensions for transect sampling units are length by width and, when given, by vertical height above ground. Note transect width refers to the combined distance on each side of the observer; for example, if the observer
recorded butterflies up to 5 m on either side of the transect, then the width is 10 m.
MRR, Mark–release–recapture.
Butterflies Australia
© 2021 Australian Entomological Society
119120 C Sanderson et al.
activity. However, these guidelines require flexibility for imple- 50 min has been reliable in estimating patterns of species rich-
mentation according to latitude and altitude. For example, in ness and abundance (M. F. Braby unpubl. data). Clearly, flexibil-
the temperate areas of mainland southern Australia, temperatures ity in choice of sampling method is needed, and the method
below 21 °C are generally too cold for butterfly activity, while adopted must be adaptable to site conditions. However, regard-
those above 35 °C are too hot for most species, whereas in the less of the method used, the sampling unit must be standardised
tropical region of northern Australia, optimal activity occurs in space (i.e. dimensions of transect, point or area count), and the
when temperatures are >25 °C, and cloud cover is less of an sampling effort must be standardised in time (i.e. time taken to
issue. Surveys should not be undertaken during rain, strong complete the survey). These two components need to remain
wind, smoke or fog because butterflies are less likely to be active consistent when samples are repeated to ensure high-quality data
and thus less likely to be detected. Time of day affects activity (van Swaay et al. 2015). In other words, robust monitoring must
and thus detectability (e.g. Frazer 1973; Rutowski 1992; be standardised and consistent.
Braby 1995b; Wittman et al. 2017), and time of year needs to
be considered for seasonal species with short flight periods.
Pollard (1977) recommended an optimal time of day between BUTTERFLIES AUSTRALIA
1045 and 1545 h. However, these times need to be flexible due
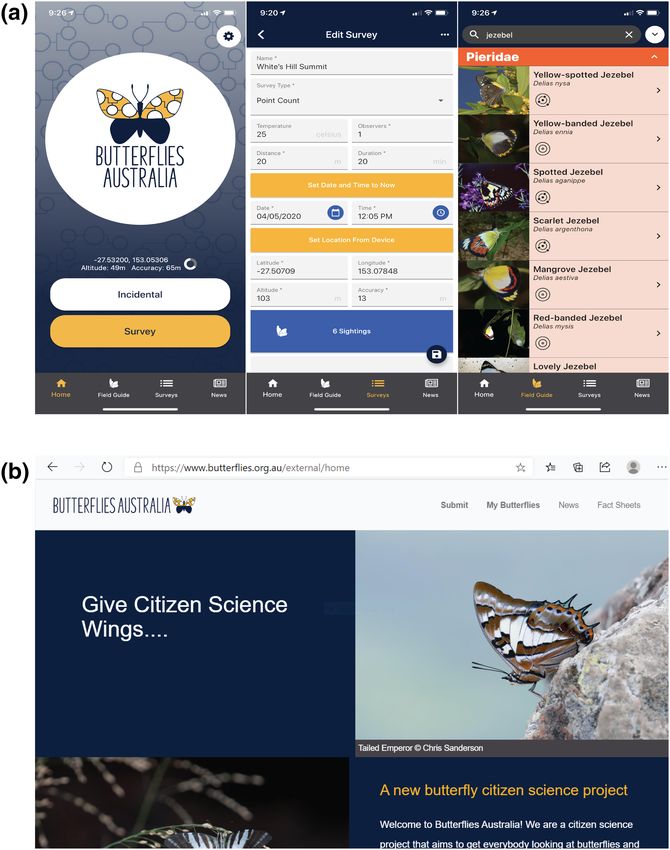
to species having different diurnal activity periods. Some The Butterflies Australia platform (Fig. 3) (Butterflies Austra-
species in Australia are most active at dawn and/or dusk (e.g. lia 2020) is a national citizen science initiative that provides tools
Chaetocneme and Melanitis) or early morning and late for butterfly enthusiasts of all levels of experience, engaging
afternoon (e.g. Euschemon rafflesia, Mycalesis perseus and both amateur and expert butterfly watchers, to contribute their
Mydosama sirius), whereas others fly predominantly in the observational data in a format that is useful for scientific analysis
morning (e.g. Netrocoryne repanda and Lucia limbaria), early (Sanderson 2019). Butterflies Australia was developed as a
to mid-afternoon (e.g. Mesodina and Ogyris) or late afternoon national database of butterfly records, specifically to remove
(e.g. Hypochrysops and Arhopala) (Braby 2000). the impediment of data deficiency for butterflies in Australian
It is clear from the quantitative surveys carried out in conservation policy and scientific research, with the overarching
Australia to date that there has been little standardisation of the goal of breaking the data deficiency feedback loop for at least
various methods used (Table 2), with wide variation in sampling one group of invertebrates (Fig. 1). Essentially, Butterflies
units and sampling efforts, as well as in overall survey effort, Australia combines new technology platforms (phone app and
adopted for some methods. For example, for transect counts, website) with citizen scientists who will be encouraged to follow
the length of the line transect varies from as little as 100 m to the international butterfly monitoring protocols described above.
as much as 5.1 km, and the width varies from 5 to 20 m. More- The project has the following general aims: (1) to raise com-
over, protocols adopted by several studies (e.g. van Praagh 1996) munity awareness of butterflies, and invertebrates in general,
fall well outside the thresholds recommended by the interna- specifically the need for more research and conservation efforts;
tional guidelines (van Swaay et al. 2015). This lack of (2) to encourage community participation through good user
standardisation is not surprising because the studies usually interface design in the app and website, including provision of
had different objectives or purposes. a free field guide in the app; (3) to increase availability of
For transect counts, we recommend a route of up to 1 km over scientifically robust observational data on butterflies; and (4) to
50 min following criteria of the Pollard walk (i.e. counts in a influence policymakers to provide more attention to butterflies
spatial volume of 5 m × 5 m × 5 m). Ideally, the transect should and potentially other invertebrates in their available funding
be located in a single habitat or, if in a heterogeneous habitat, and policy design. The long-term objective is to improve
stratified into sections or sectors (e.g. 100 m in length) to take understanding of the distribution and abundance of native and
into account habitat variability and potentially different introduced Australian butterfly species and how their ranges
management requirements. The counts ought to be repeated on and populations are changing over time. Ultimately, these data
regular intervals during the flight season (typically once every should inform policy by providing more accurate and up-to-date
1–2 weeks depending on the phenology of the species), and at data contributing to the conservation status of each species, as
the end of the year, the counts are summed for each species for well as identifying and prioritising areas for biodiversity
each site to provide an index of abundance for that year. conservation.
Obviously, a 1 km transect may not be practical for small areas; The collection of observation data is done through either the
however, if a minimum length of 300 m cannot be achieved, we phone app or website. While the interfaces for the two platforms
suggest using alternative sampling methods (e.g. point counts or differ slightly, they collect the same information. The require-
area counts). For point counts, we recommend that this method ment for each observation follows the three minimum Darwin
be used for surveying dense habitats in which there are no tracks Core metadata standards, namely: (1) species scientific name,
(e.g. clearings or light gaps in rainforest), forest canopies, (2) date and time (temporal data) and (3) location, latitude and
hilltops and residential gardens – in our experience, a circle with longitude, together with spatial accuracy or precision of the
a radius of 10 m surveyed for 30 min (i.e. similar to the sampling record (spatial data). Observer name is not mandatory, but the
unit and effort used by Hill et al. 1992) has proven to be suitable account name used to sign into the system is recorded as a unique
for point counts. For area counts, an area of 1 ha of a circle (56 m observer ID. Observations can be recorded as either incidental
radius) or quadrat (100 m × 100 m or 200 m × 50 m) surveyed for records, which are ad hoc, serendipitous species records that
© 2021 Australian Entomological SocietyButterflies Australia 121
Fig. 3. Interface of the new Butterflies Australia platforms: (a) phone app, and (b) website.
include the above information, or as surveys. Both incidental and of the count (i.e. sampling effort). Similarly, for line transects,
survey observations have the capacity to include information citizen scientists set the length of the transect and the duration
about all life history stages of each species; however, the default of the count. It is possible to record other important information,
for observations is the adult stage unless otherwise specified. such as altitude and temperature, and any other key information
The terms and conditions of the platform make it clear that (in the comments field for the survey). This interface design al-
citizen scientists must not send data for which they do not lows a high degree of flexibility with survey methods when
have ownership, including data collected illegally (e.g. trespass using the app and website while allowing a high level of repeat-
or lack of collecting permits for protected areas). Nomenclature ability of surveys over time.
for species and higher classification of butterflies follows
the names adopted by the Australian Faunal Directory
Phone app
(AFD 2020), which is managed by one of us (M. F. B.).
The survey methods included in the platform are designed to The mobile phone app (Fig. 3a) comprises a free iOS and An-
be flexible. There are three broad types of survey methods: (1) droid app available for download. It has a number of features that
point counts, (2) area counts, and (3) line transects (transect are not currently available on the website interface. Survey loca-
counts). For point and area counts, citizen scientists can freely tion can be set via the GPS chip in the phone. This feature works
set the diameter of the area (i.e. sampling unit) and the duration offline, so even if the citizen scientist is not in range of a mobile
© 2021 Australian Entomological Society122 C Sanderson et al.
tower or Wi-Fi hotspot, they will be able to record data in the From that point, all observations that pass the automated filter
remotest parts of the country. To allow for this, surveys are not criteria will be automatically marked as valid without relying
automatically uploaded to the server but must be authorised by on verification by the moderators.
the citizen scientist once they are in range of a mobile tower or Records that are invalidated due to insufficient information
have Wi-Fi connection. This feature also allows citizen scientists are stored in the database and can be revisited in the future when
to review their sightings before they are sent to the database for more evidence becomes available. For example, worn specimens
moderation. and the females of several hesperiids and lycaenids can be very
The phone app includes a photographic field guide. The text difficult to identify without a vouchered specimen that may also
provided for each species is minimal to aid in successful identi- require dissection and examination of the genitalia. If a citizen
fication and is not intended to replace the role of a book for field scientist edits a record by adding more information, the record
identification. The app field guide has a photo gallery, which de- is then automatically passed back through the moderator filters.
picts many life histories, as well as differences in sex, subspecies, Moderators and citizen scientists that submit invalidated records
seasonal forms, colour morphs and other variations. Moreover, will retain access to those records, but other citizen scientists will
the app field guide format can provide many images per species not have access to these records. Where citizen scientists are
and in this regard is more advantageous than a hard copy book unsure of the species identification based on a photograph, they
because we expect the number of images to substantially can still submit the record as an ‘unknown species’, which will
increase over time. then be assessed by the moderators for identification. This
feature has the potential to be very useful for biosecurity in cases
where a citizen scientist finds an introduced species for the first
Website
time. In future, we plan to add an additional filter for species
The online website (Fig. 3b) is where the citizen scientist can we consider challenging to identify so that those records will
search through the validated records. Within the species search always be scrutinised by an expert before being verified.
facility, citizen scientists can choose to search on a date range, Once verified, data are then made available for download via
by state, on species scientific or common name, or a combina- the Butterflies Australia website. The data are interoperable and
tion of these elements. For example, a very specific search available via application programming interface (API) for insti-
could be conducted for all records of the migratory Caper tutions that manage national data aggregations, such as the
White Belenois java in Queensland for the month of October ALA. This ensures the data remain freely available to the public.
for the years 2019–2020. Results of this search are displayed The exception is for ‘sensitive data’, which is data that remain
in a table or can be displayed on an interactive map, where protected because, for example, a species may be threatened,
each record can be clicked to display the original observation or a site is likely to be significantly impacted by visitation or
in the database, including any images attached or comments over-collection. Sensitive species data are displayed only in a
from moderators. generalised format, with the observation point obfuscated by a
The data verification facility is a feature of the website. 50 km buffer. Sensitive species data, however, can be made
This feature is only accessible to volunteer experts available on request for research purposes provided the project
(see Acknowledgements) who verify data stored in the database. meets certain criteria (e.g. raw data points are not to be released).
Local experts were recruited to participate as moderators based At this stage, we plan to designate data as sensitive on a species-
on established connections with the database managers by-species basis rather than allowing users to designate specific
(C. S. and M. F. B.) and to ensure adequate coverage of all states records as sensitive.
and territories. Thus, moderators are typically recruited to exam-
ine data from a particular state or territory, but they can verify
data from anywhere in the country. The platform accepts all D I S C U S S IO N
types of records of butterflies, including voucher specimens,
photographs, those based on captured and released specimens The Butterflies Australia platform was officially launched in
and those based on observational sightings. The level of evi- Canberra in late October 2019. Within the first 12 months of
dence provided by the citizen scientist assists the moderator in operation, over 4 000 people downloaded the app, and over
reviewing the species identifications, so, for example, a 8100 validated butterfly observations representing 256 species
sighting-only record of a rare species would be subjected to more were submitted (by 297 citizen scientists) (Fig. 4). Two-thirds
scrutiny than one backed by a photograph or voucher specimen. of the records comprise Nymphalidae and Pieridae (65%),
All observations are first passed through a series of automated whereas the Hesperiidae are poorly represented (5%), which no
filters to check if the species was recorded within certain criteria, doubt reflects the difficulty of identifying members of this
such as its known range (spatial distribution), an appropriate al- speciose family. Not surprisingly, records to date are spatially
titudinal range, known time of year (temporal occurrence) and in biased towards the higher population centres along the eastern
plausible numbers. Another criterion is whether the citizen scien- seaboard, but as more data accrue, citizen scientists will be
tist is a verified user or not. Initially, all new citizen scientists encouraged to target gaps in overall coverage of geographical
have their records scrutinised by the moderators. Once new citi- regions, as well as particular species. Our data will be publicly
zen scientists have demonstrated their reliability in identifying available through the ALA, Australia’s national biodiversity
butterflies, the moderator can then verify the citizen scientist. aggregator, which also makes that data available globally
© 2021 Australian Entomological SocietyYou can also read