Storing vital products with care - Half Year 2021- Roadshow presentation Royal Vopak
←
→
Page content transcription
If your browser does not render page correctly, please read the page content below

Storing
 vital products
 with care

Half Year 2021- Roadshow presentation
Royal Vopak

Forward-looking statement
This presentation contains ‘forward-looking statements’, based on currently available plans and forecasts. By
their nature, forward-looking statements involve risks and uncertainties because they relate to events and
depend on circumstances that may or may not occur in the future, and Vopak cannot guarantee the accuracy
and completeness of forward-looking statements.

These risks and uncertainties include, but are not limited to, factors affecting the realization of ambitions and
financial expectations, developments regarding the potential capital raising, exceptional income and expense
items, operational developments and trading conditions, economic, political and foreign exchange
developments and changes to IFRS reporting rules.

Vopak’s outlook does not represent a forecast or any expectation of future results or financial performance.

Statements of a forward-looking nature issued by the company must always be assessed in the context of the
events, risks and uncertainties of the markets and environments in which Vopak operates. These factors could
lead to actual results being materially different from those expected, and Vopak does not undertake to publicly
update or revise any of these forward-looking statements.

                                                                                         HY1 2021 Roadshow Presentation 2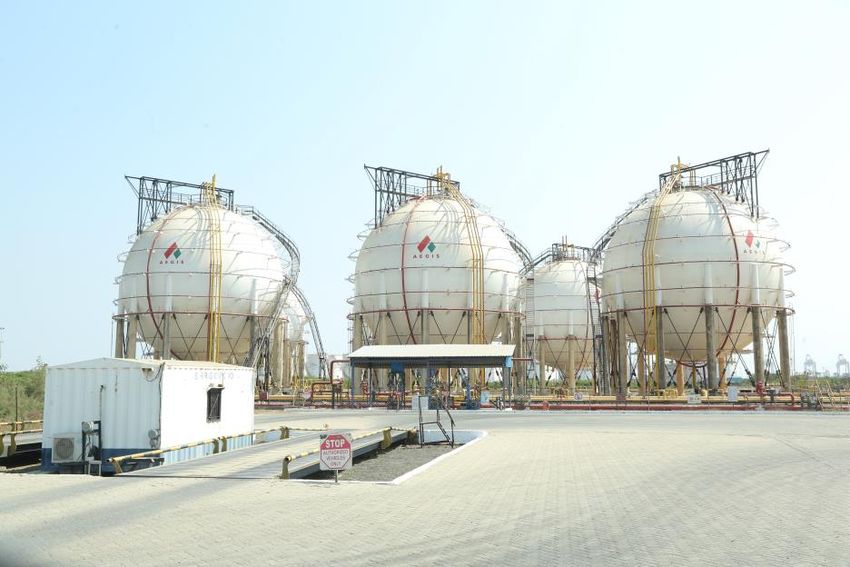
Vopak at a glance
 At year-end 2020
                                                        Number of                       Number of                     Storage capacity
                                                        terminals                       countries                          In million cbm

▪ World’s leading independent tank storage
  company                                                  70                              23                           35.6        34.4
                                                                                                                                           35.6

▪ Diversified customer base including all major                                                                                     2019 2020

  chemical producers and global oil & gas
  companies                                             Market                          Number of                     Total injury rate
                                                                                                                     In 200,000 hours worked own
                                                     capitalization                     employees                      personnel and contractors
                                                          In EUR billions                     In FTE

▪ >80% take-or-pay cash flows with multi-year
                                                         5.4                       5,637                                0.37      0,34 0,37
  commercial contracts
                                                                                                                                  2019 2020

▪ Safe, reliable and efficient operator
                                                   FY2020 EBITDA                      FY2020 EPS                       FY2020 ROCE
▪ Very well positioned to further grow and shift         In EUR millions
                                                   -excluding exceptional items-
                                                                                              In EUR
                                                                                   -excluding exceptional items-
                                                                                                                     -excluding exceptional items-

  towards a more sustainable and digital world
                                                        792                           2.42                           11.6%

                                                                                                        HY1 2021 Roadshow Presentation 3
Investment Highlights

              World’s leading independent tank storage company

                 Highly diversified portfolio of terminals across regions and product lines

                    Solid drivers for demand

                     New expansion projects

                     Well positioned for the shift towards a more sustainable & digital world

                   Blue-chip customer base

                Long-term contracts providing strong revenue visibility

              Experienced management team

                                                                 HY1 2021 Roadshow Presentation   4
Products and Customers
Playing a vital link in the supply chain for gas, chemicals and oil

        Gas                                   Chemical                             Oil products
       LNG, LPG,                                                                                                             Handling and storing
                                             Methanol, xylenes,                    Crude oil, gasoline,                      vital products…
  ethylene, butadiene,
                                           styrene, MEG, vegoils                  naphtha, diesel, fuel oil
        ammonia

      Blue-chip customer base including governments, traders, and leading                                                    ..for a diverse set of
                                                                                                                             customers
       international, regional and national chemical, oil and gas companies

                                                                             Independent            Mid-stream
  Feedstock              Feedstock      Production            Products                                                       Playing a
                                                                             storage &              & end-user
  production             gathering      & Refining            transmission                                                   fundamental role in
                                                                             transshipment          distribution
                                                                                                                             their supply chains

                                     Gas, Chemical and Oil supply chain

                                                                                                              HY1 2021 Roadshow Presentation 5
Strategic terminal types

 New Energy &                              Industrial                               Gas                            Chemical                            Oil
   feedstock                               terminals                             terminals                         terminals                        terminals

                                     Petrochemical clusters are
Vopak actively pursues               becoming larger and more              Vopak is expanding its gas        Demand for chemicals storage
                                                                           storage – in response to          is growing. Vopak operates a     Vopak operates oil hub
opportunities in new energies        complex, making logistics
                                                                           increased demand from             global network of chemicals      terminals located strategically
and sustainable feedstocks. We       integration even more crucial.
                                                                           petrochemicals, gas-fired power   terminals; in particular, we     along major shipping routes,
aim to develop infrastructure        Industrial terminals have a single                                                                       where suppliers, customers and
solutions for the world’s changing   operator, typically serving           plants and transport. Vopak       have a strong presence in
                                                                           continues to contribute to        key hub locations, including     traders are active. These include
energy and feedstock                 multiple plants at the same time.
                                                                           the energy transition by          Antwerp, Rotterdam,              Rotterdam, Fujairah and the
systems. Our strategy for new        This makes optimizing terminal
                                                                           introducing new infrastructure    Singapore and Houston.           Singapore Strait. We also play
energies is to facilitate new        logistics easier. Many
                                                                           for cleaner fuels like LPG and    Besides growth opportunities,    an important role in ensuring
supply chains for hydrogen,          petrochemical clusters adopt this
                                                                           LNG. We own and operate LPG       we are also looking at ways      countries with structural oil
CO2 and new feedstocks, as           model because of the size and
                                                                           terminals in the Netherlands,     of operating our terminals       supply deficits have adequate
well as develop flow batteries.      complexity of their operations.
                                                                           China and Singapore; we have      more efficiently and further     access to energy imports.
Vopak has made first investments     Industrial terminals typically have
in hydrogen                          long-term customer contracts –        LNG facilities in Colombia,       strengthening customer
and is exploring further             since terminals are integrated        Mexico, the Netherlands and       service.
opportunities in Europe and          into the customer’s facility. We      Pakistan.
beyond. In Asia, we are exploring    operate industrial terminals in
the potential of low-carbon          the US, Europe, Middle East,
ammonia and flow batteries.          Asia and China.

                                                                                                                                       HY1 2021 Roadshow Presentation 6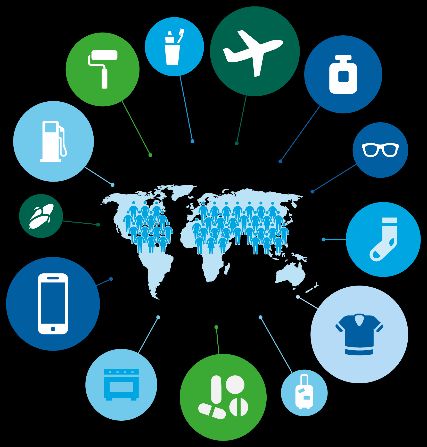
External developments
Structural business drivers influenced by two global trends

Storage       ▪ Structural demand drivers for          Energy           ▪ Facilitate the introduction of
demand          storage of vital products, driven by   transition         lighter, cleaner fuels
drivers         growth in population and global                         ▪ Pursue potential infrastructure
                energy consumption                                        solutions for a low-carbon
              ▪ Increasing global imbalances                              energy future
                resulting from concentration of
                supply and demand

              ▪ Competitive landscape changed          Digital          ▪ Real-time data and transparent
Competition
                as a result of new storage capacity    transformation     processes are required by
                worldwide                                                 customers
              ▪ Vopak strategic capabilities of                         ▪ Connectivity with external
                more importance                                           parties

                                                                               HY1 2021 Roadshow Presentation 7
Portfolio transformation
Shift towards industrial terminals, chemicals and gas terminals
Key projects                                          Proportional revenue by product category
                                                       ~10%      ~10%      10-15%        ~15%
Gas
               • SPEC LNG - Colombia                   ~15%      20-25%
                                                                           25-30%                     Gas terminals
               • ETPL LNG - Pakistan                                                    25-30%
                                                                                                      Industrial terminals
                                                       35-40%
               • RIPET LPG - Canada                              25-30%
                                                                           25-30%                     Chemicals terminals
                                                                                        25-30%
                                                                                                      Oil terminals
Industrial
terminals
               • Dow transaction - US                  40-45%    40-45%
                                                                           35-40%        ~35%
               • Corpus Christi - US
                                                       2014      2017      2019          2020
               • Qinzhou - China
                                                      Proportional revenue by division
Chemicals
               • Houston Deer Park - US
                                                       5-10%     5-10%     ~10%         10-15%
               • Antwerp - Belgium                     ~15%      15-20%    ~20%                       LNG
               • Rotterdam Botlek - the Netherlands    ~20%
                                                                                         ~20%

                                                                 20-25%                               Americas
                                                                           ~25%
                                                       5-10%                             ~25%         Asia & Middle East
Oil                                                              5-10%
               • IMO 2020 conversion                                       ~10%
                                                                                         ~10%         China & North Asia
               • Divestments Algeciras, Amsterdam,     45-50%    40-45%    ~35%         30-35%        Europe & Africa
                 Hamburg, Hainan and Tallinn
                                                       2014      2017      2019          2020

                                                                                    HY1 2021 Roadshow Presentation 8
Data-driven digital transformation
IT multi-year program expected to be completed by end of 2023
▪ Centralized cyber security Digital ▪ Replacing and modernizing our
Cyber security company-wide IT and OT
program to protect our systems Modernization
systems
▪ Significant reduction in response ▪ Developed own software for
time to cyber attacks core processes and
standardize non-core
processes
Digital ▪ Connecting our assets to generate Platforms ▪ Create digital platforms around
real-time data with smart smart terminals enabling
Innovation
sensoring efficient and reliable
▪ Digitizing and connecting our information sharing
terminals ▪ Engage in new ventures
related to technology &
innovation
HY1 2021 Roadshow Presentation 9Overview financial framework
Performance delivery and managing value
▪ Clear financial framework to support strategy
▪ Balanced portfolio management with focus on strong operational cash flow
generation with a disciplined capital investment approach
▪ Aimed towards a strong investment case
• Return on capital employed (ROCE) between 10% and 15%
• Long-term senior net debt to EBITDA ratio between 2.5 and 3.0
• Annual stable to rising cash dividend in balance with a management view on a
payout ratio range of 25-75% of net profit
HY1 2021 Roadshow Presentation 10UN Sustainable Development Goals (SDGs)
5 selected SDGs to create a focus on where we can contribute to society
Description Ambitions / targets
Vopak contributes to facilitating energy security and the energy
transition by creating reliable access to energy and developing
infrastructure solutions for future low-carbon energy and feedstock
ecosystems, facilitating new product flows like hydrogen, ammonia • Facilitate introduction of lighter, cleaner and less polluting fuels
and CO2. Our main contribution to combating climate change is in • Develop new infrastructure solutions for low-carbon energy and feedstocks
facilitating solutions that enable producers and customers along the • Our ambition is to be climate neutral by 2050
value chain to reduce their CO2 footprint. We also aim to reduce our
own carbon footprint and improve our energy efficiency. We aim to
minimize the negative impact of our activities on climate.
In storing vital products today and tomorrow, safety is our first and
foremost priority. This includes ensuring a safe and secure working • Zero fatalities and major incidents and reduce Total Injury Rate (TIR)
environment for all people working at and for Vopak • Improve diversity in management in terms of both gender and nationality
To realize our purpose, we develop, maintain and operate reliable, Industry leader in:
sustainable terminal infrastructure in ports around the world. We adopt • Sustainability, service delivery and efficiency standards
and invest in environmentally sound technologies and processes. We • Design and engineering of new assets
explore the introduction of more sustainable technologies and • Project management and commissioning of new assets
processes and work on the digital transformation of our company • Operating and maintaining existing assets throughout the Vopak network
We strive for environmentally sound management of the products we
• Reduce Process Safety Event Rate (PSER)
store and handle, and we work hard to minimize any negative impact
• Reduce releases of harmful products to the environment
on the environment, in particular by reducing releases to air, water
• No uncontained spills
and soil
HY1 2021 Roadshow Presentation 11Benchmark scores
Ratings based on Environmental, Social and Governance
Safety
MSCI ESG Ratings
▪ Leading safety performance in storage industry
▪ Rating: AAA (Scale: CCC to AAA)
Personnel Safety (TIR)
Total injuries per 200,000 hours worked
1.0
0.37
0.5
ISS
0.0
▪ Rating (scale: 10 high risk to 1 low risk) 2010 2011 2012 2013 2014 2015 2016 2017 2018 2019 2020
▪ Environmental: 3
▪ Social: 3
▪ Governance: 2 Sustainability
▪ UN Sustainability Development Goals (SDGs)
Sustainalytics
▪ Rating: 19.1 (Scale: 0 to 50 high exposure)
▪ Task-force on Climate-related Financial
Disclosures
▪ Investing in emission-reducing methods
HY1 2021 Roadshow Presentation 12HY1 2021 Key messages
Good strategic delivery and financial performance - EBITDA of EUR 407 million
Growth projects contribution in HY1 2021 of EUR 20 million in line with the higher end of
the expected EUR 30 million to EUR 50 million range for 2021
Cost efficiency measures progressing well, consistent with our cost outlook of below
EUR 615 million for the year
Solid progress on strategy execution, new investments in India, China and United States
EBITDA* Proportional EPS* Proportional
In EUR million occupancy rate In EUR storage capacity**
In percent In million cbm
407 88 1.19 22.3
*Including net result from joint ventures and associates and excluding exceptional items
**Reported storage capacity is 35.9 million cbm. Reported storage capacity is defined as the total available storage capacity (jointly) operated by Vopak at the end of the
reporting period, being storage capacity for subsidiaries, joint ventures, associates, and other (equity) interests, and including currently out of service capacity due to HY1 2021 Roadshow Presentation 13
maintenance and inspection programs. Proportional storage capacity is defined as the capacity of the joint ventures and associates and the subsidiaries with non-controlling
interests consolidated based on the economic ownership interests of the Group in these entities.Deliver sustainable shareholder value and profit
Value creation and resilient performance
Measure Drive Create
Grow EBITDA over time and
replace the EBITDA from Safety: Ensuring high standards
divested terminals of safety in all our processes Deliver portfolio transformation
Generate portfolio return of Service: We enable efficient Pursue opportunities in new
capital employed between 10% services that benefit our energies
and 15% customers
Deliver data-driven digital
Operate terminal portfolio with Cost: Efficiency and cost transformation
occupancy rate between 85% management continues
and 95%
Aim to be sustainability leader by focusing on care for
people, planet and profit
HY1 2021 Roadshow Presentation 14Continued portfolio positioning
Strategic transformation toward more sustainable forms of energy & feedstocks
Vopak growth capital allocation
Majority of growth investments will be allocated 15-20% 25-30%
10-15%
towards industrial, gas and new energies 20-25% 10-15% 35-40%
infrastructures Gas, new energy
20-25% 20-25% & feedstocks
Industrial terminals
Positive views on chemicals remain unchanged ~25%
35-40% 35-40% Chemicals
~25%
Oil
In line with our strategy, new growth
2014-’16 2017-’19 2020 >2021
investments in oil infrastructure will mostly be
targeted towards our leading hub positions Investments in growth
In EUR million
Capital allocation decisions in India, China and 525
500
United States reinforce portfolio position and 300-350 300-350
340
strategic ambitions
146
0 0
2018 2019 2020 HY1 2021 >2022
2021
HY1 2021 Roadshow Presentation 15HY1 Portfolio highlights Aegis and Vopak joining forces for LPG and chemical storage in India LPG & chemicals transaction in India LPG spheres in Pipavav, India Creating one of the largest independent tank storage companies for LPG and chemicals in India, with presence in 5 key ports along the Indian coastline The partnership with Aegis is well positioned for further growth, which targets mainly LPG and also chemicals and industrial terminal opportunities Revenues are forecasted to grow with a CAGR of ~6% in the first 5 years, with LPG revenues representing ~75% of total revenues Enterprise value for Vopak’s share will amount to EUR 185 million plus EUR 15 million*, with the implied EBITDA multiple decreasing from 11x in 2022 to 8x in 2026 This transaction will be marginally accretive to Vopak’s EPS in the first years *Depending on the fulfillment of certain Conditions Precendent HY1 2021 Roadshow Presentation 16
HY1 Portfolio highlights
Strengthening our leading position in industrial terminals
Industrial terminals in China and US Investing in India, China and US
Successful start of operations of the greenfield industrial
terminal in Qinzhou, China, with an initial capacity of 290k
cbm
Awarded contract for industrial terminal in Huizhou, Dow industrial
China, where we will own 30% of the 560k cbm terminal terminals transaction Aegis LPG & chemicals
US transaction
The planned terminal would be constructed and operated India Industrial
Corpus Christi terminals
as part of ExxonMobil’s proposed Huizhou chemical industrial terminal China
complex project US
Early July 2021, Vopak Terminal Corpus Christi
completed cold commissioning and is ready to receive
products as planned later this year
HY1 2021 Roadshow Presentation 17Our New Energy focus areas
Vopak currently pursues 10+ infrastructure projects and studies
Hydrogen New feedstocks
H-vision: blue hydrogen in Netherlands Import green ammonia from Morocco or Middle East
Pilot: green liquid organic hydrogen (LOHC) from Germany Xycle: chemical recycling of plastic waste in Rotterdam
to Netherlands
Good progress building new tanks for waste based
Import of green (liquefied) hydrogen, LOHC and ammonia feedstocks in Rotterdam
in Southern Europe, Middle East, Australia and South
America
CO2 Redox-flow
infrastructure batteries
Independent liquid CO2 hub in Rotterdam Pilot: hydrogen bromide redox flow battery in Netherlands
together with Elestor
Export terminal opportunities in Antwerp, Flushing and
Singapore Pilots: vanadium redox flow battery in Singapore and
Australia
HY1 2021 Roadshow Presentation 18Summary financial performance
EBITDA of EUR 407 million in HY1 2021. Adjusted for EUR 15 million negative currency
translation effects, EBITDA increased by EUR 19 million (5%)
Growth project contribution for the first half 2021 is driving positive EBITDA performance in soft
business conditions
Earnings per share of EUR 1.19
Continued capital allocation to growth investments with attractive investment multiples in line
with financial framework
The senior net debt to EBITDA ratio is 2.86 at the end of HY1 2021
HY1 2021 Roadshow Presentation 19HY1 2021 vs HY1 2020 EBITDA
EBITDA performance driven by growth project contribution
Business environment Performance
changes delivery
5-10
10-15 406.6
402.6
15
25-35
20
8
HY1 2020 Oil Chemicals FX-effect Expenses Growth HY1 2021
Markets Markets projects
Figures in EUR million, excluding exceptional items including net result from joint ventures and associates. Chemical market impact includes HY1 2021 Roadshow Presentation 20
industrial performance as well.HY1 2021 vs HY1 2020 EBITDA
EBITDA performance supported by strong performance in Europe & Africa and
China & North Asia
0.9 2.8
3.5
11.9 406.6
402.6 1.7
27.8
15.2
387.4
HY1 2020 FX-effect Adjusted Europe & China & Americas LNG Asia & Global HY1 2021
HY1 2020 Africa North Asia Middle East functions,
corporate
activities
and others
Figures in EUR million, excluding exceptional items including net result from joint ventures and associates HY1 2021 Roadshow Presentation 21Divisional performance
Americas reflects soft market conditions; Asia & ME stable performance;
Europe & Africa benefit from growth projects; China & North Asia resilient
Americas Asia & Middle East China & North Asia
89 92 90 87 86
93 94 93 92 92 90 88 88
90 89
48.7 44.9 47.2 42.4 46.3 77.1 70.0 69.5 68.0
51.5 13.7 13.9 15.5 15.2 15.6
Q2 Q3 Q4 Q1 Q2 Q2 Q3 Q4 Q1 Q2 Q2 Q3 Q4 Q1 Q2
2020 2020 2020 2021 2021 2020 2020 2020 2021 2021 2020 2020 2020 2021 2021
Europe & Africa LNG
88 91 91 88 87 97 97 97 97 97
Proportional occupancy rate (in percent)
64.8 73.2 76.4 75.2 78.3 Reported EBITDA (in EUR million) excluding
9.4 10.2 10.4 10.4 7.8 exceptional items and including net result from
joint ventures and associates and currency
Q2 Q3 Q4 Q1 Q2 Q2 Q3 Q4 Q1 Q2 effects
2020 2020 2020 2021 2021 2020 2020 2020 2021 2021
HY1 2021 Roadshow Presentation 22Cash flow overview
Free cash flow before financing impacted by working capital movements and lack of cash flows
from portfolio effects
HY1 2021 HY1 2020
In EUR million In EUR million
407 401
311 6
45 266 351 56
232 132 151
34
269 238
259
147 77
85
146
1
-60
CFFO Derivatives CFFO Tax & other CFFO Sustaining, FCF Growth Other FCF CFFO Derivatives CFFO Tax & CFFO Sustaining, FCF Divest- Growth Other FCF
(excl. (gross) operating (net) service & IT before investments CFFI before (excl. (gross) other (net) service & IT before ments investments CFFI before
items investments incl. capital operating investments incl. capital
derivatives) growth financing derivatives) items
growth
repayments
financing
repayments
HY1 2021 Roadshow Presentation 23Investment phasing
Strategic investments aiming to capture growth
In 2021, growth investment is expected to be at the low end of the range
EUR 300-350 million. The allocation of these investments will be
Investments
through existing committed projects, new business development and
In EUR million
pre-FID (Final Investment Decision) feasibility studies in new energies
including hydrogen based on the assumption that the Aegis Vopak
transaction will close early 2022
New For the period 2020-2022, Vopak indicated to spend EUR 750-850
projects*
million for sustaining and service improvement capex, subject to
~525 additional discretionary decisions, policy changes and regulatory
~500 Growth
investments** environment. For 2021, Vopak expects to reach around EUR 290 million
~340 in sustaining and service capex, based on current views on exchange
~125 rates
~300 ~315 Other
~240 ~265 As part of the strategic direction for the period 2020-2022, Vopak
investments***
indicated to invest annually EUR 30-50 million in IT capex to complete
2017 2018 2019 2020 2021 Vopak’s digital terminal management system. For 2021, Vopak expects
to be at the high end of the range in IT capex and we expect this
program to be completed by the end of 2023
* For illustration purposes only, new announcements might increase future growth investments
** Growth capex at subsidiaries and equity injections for joint ventures and associates
*** Sustaining, service improvement and IT capex HY1 2021 Roadshow Presentation 24Robust balance sheet
Target leverage of 2.5 to 3.0 times senior net debt : EBITDA
Priorities for cash Senior net debt : EBITDA ratio Growth investment multiples
for covenant (frozen GAAP) Invested capital / normalized projected EBITDA*
Debt servicing
1 average interest rate 2020: 3.7% 10x
• Acquisitions
Growth opportunities • Greenfield
2 Value accretive growth development
2.5-3.0 ~7.0x
• Brownfield
Shareholder dividend expansions
3 Stable to rising cash dividend
4- 6x
2.73 2.49 2.75 2.52
2.04 2.02
Capital optimization
4 Efficient robust capital structure
2015 2016 2017 2018 2019 2020 Target Growth Range of
investment typical project
Maximum ratio under private placements programs and portfolio investment
syndicated revolving credit facility - ‘frozen GAAP’ 2017-2022 multiples
* Invested capital reflects growth capex at subsidiaries and equity injections for JV’s and associates
Normalized projected EBITDA reflects Vopak’s EBITDA contribution in normalized operating and market conditions HY1 2021 Roadshow Presentation 25Increase in shareholder returns
Continued rising cash dividend
Dividend and EPS* Dividend policy
In EUR
2.80 Dividend policy targets to pay an annual
2.55 2.56
2.25 2.27
2.42 stable to rising cash dividend in balance with
a management view on a payout ratio range
of 25-75% of the net profit excluding
1.10 1.15 1.20
1.00 1.05 1.05 exceptional items attributable to holders of
ordinary shares and subject to market
circumstances
2015 2016 2017 2018 2019 2020
39% 41% 47% 48% 41% 50% payout ratio
* Including net result from joint ventures and associates and excluding exceptional items HY1 2021 Roadshow Presentation 26Non-IFRS proportional information
Recently added JVs 2020 and 2021: China and United States
EBITDA Operating income Occupancy rate
In EUR million In EUR million In percent – subsidiaries only
IFRS BASED
202 200 189 200 206 299 302 314 306 312 88 91 90 88 87
Q2 Q3 Q4 Q1 Q2 Q2 Q3 Q4 Q1 Q2 Q2 Q3 Q4 Q1 Q2
2020 2020 2020 2021 2021 2020 2020 2020 2021 2021 2020 2020 2020 2021 2021
EBITDA Operating income Occupancy rate
PROPORTIONAL
In EUR million In EUR million In percent
NON-IFRS
246 244 246 250 423 427 430 92
241 412 413 90 91 89 88
Q2 Q3 Q4 Q1 Q2 Q2 Q3 Q4 Q1 Q2 Q2 Q3 Q4 Q1 Q2
2020 2020 2020 2021 2021 2020 2020 2020 2021 2021 2020 2020 2020 2021 2021
Operating income consists of revenues and other operating income (among others IFRS 16 lease income and management fees) HY1 2021 Roadshow Presentation 27Proportional EBITDA
Performance of joint ventures and associates is becoming more important
Proportional EBITDA
In EUR million
+9% CAGR Proportional EBITDA has grown at a CAGR
972 of 9% from 2018 to 2020
Proportional consolidated information
822 provides transparency considering increase
joint venture contribution relative to
subsidiaries
2018 2020
HY1 2021 Roadshow Presentation 28Summary financial performance
EBITDA of EUR 407 million in HY1 2021. Adjusted for EUR 15 million negative currency
translation effects, EBITDA increased by EUR 19 million (5%)
Growth project contribution for the first half 2021 is driving positive EBITDA performance in soft
business conditions
Earnings per share (EPS) of EUR 1.19
Continued capital allocation to growth investments with attractive investment multiples in line
with financial framework
The senior net debt to EBITDA ratio is 2.86 at the end of HY1 2021
HY1 2021 Roadshow Presentation 29Looking ahead
In 2021, reported EBITDA contributions from 2020 and 2021 growth projects are expected to be
at the higher end of the EUR 30 million to EUR 50 million range, subject to market conditions
and currency exchange movements
In 2023, reported EBITDA contribution from 2020 and currently approved growth projects is
expected to be in the range of EUR 110 million to EUR 125 million, subject to market
conditions and currency exchange movements. Additional projects will further contribute to
reported EBITDA
Cost management continues and we expect to manage the 2021 cost base including additional
cost for new growth projects below EUR 615 million, subject to currency exchange movements
HY1 2021 Roadshow Presentation 30Storing vital products with care 1H 2021 Roadshow Presentation Appendix
Americas developments
Storage capacity                                             Proportional occupancy rate                         Revenues*
In million cbm                                               In percent                                          In EUR million

          0.5                Total Q2 2021                      93         94        93        90          89      79.5                 81.1
                                                                                                                             78.3               77.6    79.2
                            5.3 million cbm
    0.9

                             Subsidiaries
                 3.9
                             Joint ventures & associates
                             Operatorships
                                                               Q2          Q3       Q4         Q1          Q2       Q2        Q3         Q4      Q1      Q2
                                                              2020        2020     2020       2021        2021     2020      2020       2020    2021    2021

          23 Terminals (6 countries)
                                                             EBITDA**                                            EBIT**
                                                             In EUR million                                      In EUR million

                                                               48.7                47.2                   46.3
                                                                          44.9                42.4
                                                                                                                  33.7                  32.0
                                                                                                                             29.4                        29.9
                                                                                                                                                26.6

                                                                Q2         Q3       Q4        Q1           Q2      Q2         Q3         Q4      Q1      Q2
                                                               2020       2020     2020      2021         2021    2020       2020       2020    2021    2021

  * Subsidiaries only
  ** EBIT(DA) - including net result from joint ventures and associates and excluding exceptional items
                                                                                                                                    HY1 2021 Roadshow Presentation 32
Asia & Middle East developments
Storage capacity Proportional occupancy rate Revenues*
In million cbm In percent In EUR million
Total Q2 2021 92 92 90 88 88 73.0 70.3 71.1 69.9 70.7
3.3 4.2 15.5 million cbm
Subsidiaries
Joint ventures & associates
8.0
Operatorships
Q2 Q3 Q4 Q1 Q2 Q2 Q3 Q4 Q1 Q2
2020 2020 2020 2021 2021 2020 2020 2020 2021 2021
19 Terminals (9 countries)
EBITDA** EBIT**
In EUR million In EUR million
77.1
70.0 69.5 68.0
61.8
51.5 53.6 53.0 51.4
35.5
Q2 Q3 Q4 Q1 Q2 Q2 Q3 Q4 Q1 Q2
2020 2020 2020 2021 2021 2020 2020 2020 2021 2021
* Subsidiaries only
** EBIT(DA) - including net result from joint ventures and associates and excluding exceptional items
HY1 2021 Roadshow Presentation 33China & North Asia developments
Storage capacity Proportional occupancy rate Revenues*
In million cbm In percent In EUR million
Total Q2 2021 89 92 90 87 86
0.8 3.1 million cbm
10.4 10.6 11.2 10.7 10.9
Subsidiaries
2.3
Joint ventures & associates
Operatorships
Q2 Q3 Q4 Q1 Q2 Q2 Q3 Q4 Q1 Q2
2020 2020 2020 2021 2021 2020 2020 2020 2021 2021
9 Terminals (3 countries)
EBITDA** EBIT**
In EUR million In EUR million
15.5 15.2 15.6
13.7 13.9
12.5 12.4 12.7
10.8 11.3
Q2 Q3 Q4 Q1 Q2 Q2 Q3 Q4 Q1 Q2
2020 2020 2020 2021 2021 2020 2020 2020 2021 2021
* Subsidiaries only
** EBIT(DA) - including net result from joint ventures and associates and excluding exceptional items
HY1 2021 Roadshow Presentation 34Europe & Africa developments
Storage capacity Proportional occupancy rate Revenues*
In million cbm In percent In EUR million
1.3
Total Q2 2021 88 91 91 88 87 136.2 141.8 140.8 141.2
128.1
10.7 million cbm
Subsidiaries
9.4 Joint ventures & associates
Operatorships
Q2 Q3 Q4 Q1 Q2 Q2 Q3 Q4 Q1 Q2
2020 2020 2020 2021 2021 2020 2020 2020 2021 2021
16 Terminals (4 countries)
EBITDA** EBIT**
In EUR million In EUR million
73.2 76.4 75.2 78.3
64.8
38.1 35.3 35.6 37.4
29.5
Q2 Q3 Q4 Q1 Q2 Q2 Q3 Q4 Q1 Q2
2020 2020 2020 2021 2021 2020 2020 2020 2021 2021
* Subsidiaries only
** EBIT(DA) - including net result from joint ventures and associates and excluding exceptional items
HY1 2021 Roadshow Presentation 35JVs & associates developments
Net result JVs and associates* Americas* Asia & Middle East*
In EUR million In EUR million In EUR million
45.9 43.4 43.4 42.5
24.1
25.8 20.6 19.6 19.0
4.0
3.0 3.1
2.1 2.1
0.7
Q2 Q3 Q4 Q1 Q2 Q2 Q3 Q4 Q1 Q2 Q2 Q3 Q4 Q1 Q2
2020 2020 2020 2021 2021 2020 2020 2020 2021 2021 2020 2020 2020 2021 2021
China & North Asia* Europe & Africa* LNG*
In EUR million In EUR million In EUR million
9.7 9.0
8.1 8.8
10.9 11.5 11.6 11.8
7.1 9.5
0.9 1.0 0.8 1.1 1.0
Q2 Q3 Q4 Q1 Q2 Q2 Q3 Q4 Q1 Q2 Q2 Q3 Q4 Q1 Q2
2020 2020 2020 2021 2021 2020 2020 2020 2021 2021 2020 2020 2020 2021 2021
* Excluding exceptional items
HY1 2021 Roadshow Presentation 36Q2 2021 vs Q1 2021 EBITDA
EBITDA growth driven by positive performance in Europe & Africa and
Americas
0.4
1.5 206.2
3.6
2.5 2.4
2.9
200.9
200.4
0.5
Q1 2021 FX-effect Adjusted Europe & Americas China & Asia & LNG Global Q2 2021
Q1 2021 Africa North Asia Middle East functions,
corporate
activities
and others
Figures in EUR million, excluding exceptional items including net result from joint ventures and associates HY1 2021 Roadshow Presentation 37Occupancy rate developments
Lower occupancy rate in first half of 2021 due to soft business conditions
Subsidiary occupancy rate and out-of-service capacity
In percent
90-95%
85-90%
91 90
84 88 88 87
2011 2012 2013 2014 2015 2016 2017 2018 2019 Q1 Q2 Q3 Q4 Q1 Q2
2020 2021
0.6 0.8 1.0 1.6 1.6 1.4 1.1 1.1 1.2 1.0 Out-of-service capacity
Occupancy rate (in percent) for subsidiaries only
Out-of-service capacity (in million cbm) for subsidiaries only, not corrected for divestments HY1 2021 Roadshow Presentation 38Project timelines
Vopak’s Capacity
Country Terminal ownership Products (cbm) 2018 2019 2020 2021 2022 2023 2024
Growth projects
Existing terminals
United States Deer Park 100% Chemicals 33,000
Netherlands Rotterdam - Botlek 100% Chemicals 15,000
Australia Sydney 100% Oil products 105,000
Belgium Antwerp - Linkeroever 100% Chemicals 42,500
Mexico Altamira 100% Chemicals 40,000
China Shanghai - Caojing Terminal 50% Industrial terminal 65,000
Netherlands Vlaardingen 100% Renewable feedstocks 64,000
Brazil Alemoa 100% Chemicals 20,000
Acquisitions
India Kandla, Pipavav, Mangalore, Kochi, Haldia 49% LPG & Chemicals 738,000
New terminals
United States Vopak Moda Houston 50% Chemical gases 44,000
United States Corpus Christi 100% Industrial terminal 130,000
start construction
expected to be commissioned
Indicative overview, timing may change due to delays of projects under construction among others relating to Covid-19 pandemic HY1 2021 Roadshow Presentation 39You can also read