Stirling City Centre Land Development Advice - Final
←
→
Page content transcription
If your browser does not render page correctly, please read the page content below
Stirling City Centre

Land Development Advice
                   Final

        December 2013
© MacroPlan Australia Pty Ltd All Rights Reserved. No part of this document may
be reproduced, transmitted, stored in a retrieval system, or translated into any
language in any form by any means without the written permission of MacroPlan
Australia Pty Ltd. All Rights Reserved. All methods, processes, commercial
proposals and other contents described in this document are the confidential
intellectual property of MacroPlan Australia Pty Ltd and may not be used or
disclosed to any party without the written permission of MacroPlan Australia Pty
Ltd.

Quality Assurance

Report Stage     Author(s)        Date              Review           Date
                                                    Jenaya
Draft Report     Grace Taylor     20 Dec 2013       Shepherd         20 Dec 2013
                                                    Jenaya
Final Report     Grace Taylor     23 Jan 2014       Shepherd         23 Jan 2014

Prepared for: Stirling Alliance

Client Representatives: Nanette Garland and Victor Popescu
Executive Summary

    The Stirling Alliance Public Private Community Partnership has completed a
    significant volume of work leveraging off a range of specialists to inform the
    creation of a Sustainable 21 Century City. The draft Structure Plan boundary
    comprises of six precincts:
         −   Station, Southern and Osborne Park comprising largely of mixed and
             industrial uses; and
         −   Innaloo, Woodlands and Northern containing predominantly the centre’s
             residential hinterland.

    MacroPlan Dimasi has been commissioned by the Stirling Alliance to provide Land
    Development Advice around the release and timing of land in the draft Structure
    Plan boundary. The scope of this work was to prepare a Development Scenario,
    Development Strategy and Financial Feasibility model around Concept Scenario 1
    (Rev H) focusing on the stage 1 area i.e. vacant State Government land south of
    the Mitchell Freeway road reserve (see Figure 1).

    Station, Southern and Osborne Park carry the greatest development potential
    attributed to larger lots with fewer land owners and the opportunity to change to
    a higher yielding use. The Station and Southern Precincts in particular contain a
    considerable    amount     of   state   owned   land   albeit   constrained   by   future
    infrastructure planning or contamination. Here the potential for state land sales to
    offset the cost of necessary public infrastructure depends largely on the space
    requirements (and cost) of regional infrastructure.

    Stirling City Centre is not a financially viable proposition if strategic infrastructure
    is included as a project cost. Leveraging revenue from the sale of state land to
    offset the planned infrastructure costs is out weighed 2:11. There is a need to
    induce a level of demand in the short term to activate the centre and bring
    forward investment and infrastructure. The challenge is to manage infrastructure
    delivery in step with a strategy to optimise release of state land.

    1
        Landcorp Programed Business Case 2012

i
Figurre 1   Conc
               cept Scena
                        ario 1 revi sion (H)

                                               ii
There are a number of actions the City of Stirling and State Government may take
in relation to public land holdings within Stirling City Centre. MacroPlan Dimasi
has used the following approach in preparing the Land Development Advice:
− Decouple strategic infrastructure costs from expenditure required to ready
State land for development.
− Define prerequisites to major infrastructure and development.
− Set criteria to determine the release strategy best suited for each State
land parcel.
− Pursue a balance between capital infrastructure expenditure and
development staging over time.
− Leverage off private development i.e. Developer Contribution Schemes and
levies.
− Identify a staging pattern that continues to gain momentum.
− Options to start i.e. lighter, quicker, cheaper.
In accordance with the project brief development and infrastructure delivery has
been considered in three time horizons:
Short term 5-15 years
Medium term 15-30 years
Long term 30-45 years
Strategic infrastructure
The vision for Stirling City Centre is heavily intertwined with achieving broader
strategic infrastructure outcomes. In many cases development cannot occur on
State land without the strategic infrastructure being in place. This relationship
causes an impediment to achieving a commercial outcome within the short term.
Achieving improved long term transport outcomes within the centre cannot be
contingent upon developing State land. There is a Metropolitan-wide benefit to
these initiatives. Therefore the Alliance should consider a commercial
development strategy that decouples the long term transport infrastructure costs
from its short-term development objectives. This approach has been taken in
many redevelopment areas including New Northbridge and Perth City link.
iiiUtility upgrades addressing State Planning Policy and 50 per cent increase on
current infill targets should be factored into capital works and maintenance
programs of the main utility providers2.
Land and property uses
Yield assumptions used are taken from the Hames Sharley September 2013 built
form study. These have been adjusted against the Alliance Stirling City Centre
September 2013 yields i.e. accounting for parking at a rate of 250 bays per
hectare for the State land parcels. The following yields are given for the 45 year
time horizon (to 2056) set by the Stirling Alliance.
Under Concept Scenario 1 Osborne Park will see the biggest use transition from
industrial (presently) to mixed use. Woodlands, Innaloo and Northern precincts
will maintain a residential focus with the Northern and Innaloo precincts doubling
in size and Woodlands almost tripling. Station and Southern will see land use
diversification with the introduction of major residential and office components
(from the existing retail dominance).
Total Floorspace (GLA)
Precinct Existing Concept Scenario 1
Station 89,647 706,136 93,750*
Southern 91,882 357,721 111,250*
Osborne Park 294,444 585,662 -
Northern 83,578 161,008 -
Innaloo 112,400 239,400 -
Woodlands 54,722 140,588 -
TOTAL 726,673 2,190,514 205,000
*SCCA2013 yields for State land south of the freeway applying 250 parking bays per Ha
The Metropolitan Land Use Forecast Survey (MLUFs) projects population to 2041
based on current zoning allocations. A comparison of the current zoning forecasts
for Stirling City Centre against Concept Scenario 1 follows. This gives the annual
average growth rate to 2041 and shows an overall increase in growth under
2
GHD Utilities Infrastructure Strategy 2013
ivConcept Scenario 1. As expected the established residential precincts attract
comparatively low growth, while due to rezoning Osborne Park attracts the
highest. There is a significant shift in the growth for the Station and Southern
precincts, which can be attributed to the introduction of a denser housing offer
i.e. apartments.
Annual Average Growth Summary
2011-2041 (%)
MLUFs Concept Scenario 1
Precinct population dwellings population dwellings
Innaloo 5% 4% 3% 2%
Northern 6% 6% 4% 4%
Osborne Park 27% 25% 33% 28%
Southern 3% 3% 10% 10%
Station 4% 4% 10% 10%
Woodlands 3% 3% 3% 3%
TOTAL 5% 5% 6% 6%
Source: MLUFs and MPD adjusted
Existing latent capacity i.e. without need for major planning intervention or capital
funding for dwelling increase within the residential precincts has been calculated.
There is a realistic unconstrained redevelopment potential today for 490 new
homes based on current R-Codes.
Note for the residential precincts:
− The Innaloo precinct has greatest existing capacity for increased dwelling
numbers in the short to medium term under the current planning
framework.
− Up-zoning the Northern and Woodlands Precinct over the medium term
should provide some impetus for greater density within the existing
residential allocation.
− Adopting a planning policy to encourage lot amalgamation coupled with
developer incentives to encourage policy take up will help drive greater
densities to reach residential targets over the longer term.
vOver the 45 year time horizon there is theoretically the potential for development
to regenerate (and intensify) twice i.e. 30 year build life. However, GIS mapping
illustrates this capacity is constrained as a number of residential lots have
reached capacity under current codes and have been strata titled.
Car parking
Government plays an important ongoing role in providing (and enforcing)
appropriate levels of car parking in activity centres. Public car parking is generally
preferred over private tenant parking to encourage reciprocal use and more
efficient space / resource management.
Stirling’s emerging parking strategy mirrors the Perth Parking Policy, which
provides for a lot area parking rate for non-residential uses. The key difference in
the Perth CBD is the accessibility of (fee-based) public car parks to offset on-site
constraints.
The Alliance should consider a commercial approach to addressing car parking
requirements within the centre. Emphasis should be given to centralising public
bays and constraining private supply. Government owned public car parks present
an option for ongoing public revenue for the centre, and would be required up
front.
This presents an opportunity to hold the asset in order to generate value over
time while capturing revenue from parking fees. Costs could be recouped through
cash in lieu payments (at structured car park rates) from benefiting development.
Over time, as access by non-car modes improves the multi-storey car parks can
be redeveloped to help realise mode shift and yields targets.
The proposed car parking standards of 250 bays per hectare for non-residential
plus 1.25 bays per dwelling is commercially constrained. Consideration should be
given to providing a regional car parking solution on the basis of broader TOD
principles.
How maximum levels of supply relate to land use and local travel behaviours is
important. A balance between desired development activities and long-term
visustainable access and parking requirements is needed. Rates around 1.5 bays
per dwelling, 1.5 bays per 100m2 (commercial) and 2.5 bays per 100m2 (retail)
are more appropriate in the short term. These can reduce over time as non-car
modes improve.
State land with potential for short to medium term car parking use include sites
adjacent to IKEA in the Station precinct and the site adjacent to the sub-station in
the Southern precinct. In addition the LGA site opposite IKEA on Ellen Stirling
Boulevard provides another opportunity for a publicly owned public car parking
asset.
Market assessment
The 2011 Census recorded 1,535 dwellings in the Stirling City Centre area and
shows the following market characteristics when compared to the broader Stirling
LGA:
− Higher proportion of residents in white collar employment (61 per cent)
compared with Stirling (C) LGA at 54 per cent.
− Higher personal (around 20 per cent) and household (around 46 per cent)
incomes.
− Smaller household sizes.
− More than half the number of traditional families (16 per cent) and a
higher share of lone person households (36 per cent).
− Still large dominance of separate houses (49 per cent) but a higher
proportion of medium density product (47 per cent) i.e. town houses.
− Higher level of home ownership and lower share of renters
The mix of uses and the timing of investment within the City Centre will be
important. While encouraging mixed use in key locations will aid the provision of a
critical mass populous and spread hours of activation further across the day and
night, it is not necessarily suitable for every development site. Comment on the
current and future general market conditions have been summarised in the
following table.
viiSector Current Position Forecast Outlook Likely Timing Implications
Residential • Diversification in housing • Apartment‐style dwellings • Short‐term market focus
products towards higher represent the most on apartments / high
density feasible form of density dwellings
• Strong growth in sales residential development • Market potential for 75‐
prices resulting in for consideration by Local 100 apartments per year
decreased affordability Government due to the on State land.
and increased intensity of built form and
attractiveness of higher the associated land take
density products
Commercial • Strong CBD market • Reasonably high levels of • Given the current infancy
underpinned by resource white collar workers of the Stirling City Centre,
related activities makes Stirling City a and possible incubation
• Sub‐regional office logical location for period of sub‐regional
markets becoming commercial office space office market, the further
increasingly attractive provision of commercial
space is suggested to be
appropriately phased
• Yield at 72,000sqm
provide 15‐20% of the
total floorspace required
Retail • Four major competitors • Significant population • Potential additional
within 5‐10km MTA with growth and potential 50,000sqm of core shop
retail GLA of 38,000‐ mixed use development in retail floors over the next
68,000sqm the Stirling City Centre 20 years
• Relatively high residents expect to boost retail
income in the MTA (Main trade volume drawn from
Trade Area) capturing beyond the trade area
higher retail expenditure • Strong opportunity for
specialty, DDS and food
catering at the Stirling City
Centre
Tourist • Significant rise in • Potential opportunity for • Serviced apartments to
Accommodation international tourist nights apartment style products address current demand
in Stirling, with education to enter the Stirling for multi‐night stays could
and visiting friends and tourism market and be delivered as part of
relatives being major capitalise on the large early land release.
drivers number of international
• Strong preference away visitors
from hotels, motels and • Additional requirement
resorts for international for tourist
visitors accommodation will be
tested by the feasibility
model
viiiSttate land yields
In
n providing strategic advice
a on a
appropriate yields and take-up fo
or state lan
nd, the
tw
wo latest yield
y assum
mptions w ere assess
sed i.e. ‘high’ yield scenario Hames
H
Sh
harley (Se
ept 2013) and ‘low
w’ yield sc
cenario Alliance SCC
C (Sept 2013).
2
Fu
undamentally the sta
ate does no
ot own a significant portion off land with
hin the
m
mixed-use precincts making itt difficult to levera
age value off state
e land
sa
ales/develo
opment. It is thereforre important the statte look to active stra
ategic,
investible lan
nd parcels in the shorrt term whiilst safegua
arding long er term strrategic
infrastructurre goals/nee
eds.
mploymentt self-conta
Em ainment is a current issue
i for Stirling City Centre, which
w if
im
mproved will have kno
ock-on bene
efits of reduced traffic
c and generrate critical mass
to
o support business
b ac
ctivation da
ay and nigh
ht. The loca
al market ccontext ind
dicates
m
market demand for apa
artment acccommodattion in the central city
y area is lik
kely to
be
e relatively strong.
Sttirling City
y Centre should ttherefore focus on providing
g a resid
dential
ac
ccommodattion to cre
eate a susstainable ‘c
centre’ pop
pulation ca
apable of driving
d
de
emand for employmen
e nt and anch
hor retail te
enancies.
here is stro
Th ong potenttial for the market to
o absorb up
p to 1,500 units i.e. 15-20
ye
ears supply
y on State land holdiings. This equates to
o a take-up
p rate of 75-100
7
un
nits per ann
num.
he Alliance (SCC Septt 2013) allo
Th ocates Statte land to provide onlly 900 dwe
ellings,
de
espite resid
dential use
es having a high retu
urn. The Hames Sharrley (Sept 2013)
yield assum
mptions pro
ovide for 1
1,456 dwelllings, whic
ch are mo
ore approp
priately
aligned with market potential.
ote: State land has th
No he potentia
al to accoun
nt for aroun
nd 80-100%
% of the fo
orecast
20
0 year aparrtment sup
pply for Stirrling City Centre. Meaning the ce
entre will need to
‘grow the pie’
p rather than simp
ply absorb net dema
and from e
elsewhere in the
mmediate catchment.
im
ixThere
e is currently little supply of ccommerciall floor space in the Stirling City
Centre
e. Introduc
cing comme
ercial floor space has the combined effect of improving
local employme
ent sustain
nability wh
hile reducing the anticipated car parking
requirrement. As
s a high activity
a gen
nerator, ho
owever, th
he provisio
on should be
realisttic and catter to a ra
ange of an
nchor tenan
ncies and smaller
s com ary
mplementa
tenancy types prroviding forr a mix of w
white-collarr workers.
It is n
necessary to
t constrain
n commerc ial floor space in the centre as a mechanis
sm
for re
educing carr trips. The
ere is capa 0m2 GFA off commerc
acity of up to 90,000 cial
floorspace on Sttate land holdings.
h T
This equate nd 6,000m22 per annu
es to aroun um
over 1
15 years.
The S
Stirling Allia
ance (SCC Sept 2013
3) allocates
s State lan
nd to provid m2
de 90,000m
GFA o
of commerc
cial, while Hames Sha
arley (June
e 2013) yie
eld assumpttions provide
for 165,559m2. This imp
plies the Alliances’ revised co
ommercial floor spa
ace
ates more appropriattely align with the market
estima m and
d balance policy nee
eds
relatin
ng to mode
e shift/parking and bro
oader mark
ket signals.
The ffocus for retail
r inves
stment on State land
d should aim
a to con
nsolidate the
existin
ng retail hierarchy an
nd create a
activity linkages betw
ween the re
retail ancho
ors
and o
other areas within the
e precinct. It is imporrtant to cluster retail in two nod
des
within
n the mixe
ed use precincts. Thi s avoids dispersed
d or
o un-comm
mercial rettail
outcomes and pushes
p com
mmercial va
alue and risk back to
o Westfield (as a majjor
or).
ancho
e is capacity for 5,000
There 00m2 NLA of
0 to 10,00 o retail floor space o
on State land
holdin
ngs. This should be clustered
c in
n key locattions fronting Scarbo
orough Beach
Road and Stephe
enson Aven
nue to leve
erage value out of stra
ategic sitess and conne
ect
to existing privatte sector su
upply i.e. W
Westfield.
The S
Stirling Allia
ance (SCC Sept 2013
3) allocates
s State lan
nd to provid m2
de 20,000m
NLA o
of retail, while
w Hame
es Sharley (June 201
13) yield assumptionss provide for
f
00m2. This implies bo
27,50 oth Hames Sharley and
a the Stirling Allian
nce’s revised
retail yields are not neces
ssarily well focused commercially. Both arre considerred
high a
and will com
mpete with private lan
nd holdings
s.
xD
Development scena
ario
De
evelopment staging will
w be diffferent for each
e of the
e precinctss. The resid
dential
prrecincts willl develop organically in response to the residential
r demand an
nd the
de
evelopmentt potential allowed by plannin
ng controls
s. Whereass the mixe
ed-use
prrecincts have significa
ant constra
aints, as re
etail and bu
usiness lan d uses are
e more
lik
kely to require infra
astructure investmen
nt which will
w delay commence
ement.
Sm
maller scale retail an
nd businesss developm
ments should still be v
viable with
hin the
ex
xisting deve
elopment capacity,
c ho
owever.
D
Development strate
egy
Th
he development strate
egy is set w
within the context
c of the
t study sscope to foc
cus on
go
overnment land holdin
ngs south o
of the freew
way reserve
e. This has been reflec
cted in
th
he short, medium and long term time horizo
ons.
he staged release off State lan
Th ated againsst key transport
nd has been nomina
infrastructurre required to gain acccess, and the option for Westfie
eld to deliv
ver the
prroject vision on the central
c land
d parcels under their expansion plan. It is noted
th
he regional road requiirements th
hrough Stirrling City Centre are sstill under review
an
nd thereforre the stag
ging is sub
bject to cha
ange. On the
t other h
hand if a deal
d is
sttruck with Westfield
W th
here will be
e on opporrtunity for governmen
g nt to optimise the
land release strategy as
a the deve
elopment im
mpetus will be driven from the private
p
ector.
se
xi2
3
4
5
6
7
8
Sho
ort term
Ama
algamate
Sew
wer Connection
n
xiix xiii
Active land banking

Despite long lead times for capital infrastructure projects there are opportunities
to make use of vacant government land in the short to medium term. This
involves exploring options for a low-cost, high-impact incremental framework for
improving the amenity or infrastructure in short order. ‘Light development’
strategies can makeover underutilised spaces and attract more partners for long-
term transformation.

The Alliance should consider temporary ‘main street’ functions and activities along
Ellen Stirling Boulevard to engage the local community and set the scene for the
long term vision. Temporary car park on state land, which is less amenable to
comprehensive redevelopment in the short term, has the potential to create
longer-term income streams as well. These may be on-sold to take out parties
and levied over time.

Financial Feasibility

The long term redevelopment vision for Stirling City Centre will require significant
infrastructure investment totalling up to $1b over the life of the project (45
years). This infrastructure will be funded in varying degrees by State and Local
government, utilities providers, land owners, and developers. This presents a
challenge as the specific mix and timing of funding and infrastructure is uncertain
at this stage of the project.

To assess the specific costs related to developing State land the Alliance assisted
in splitting out costs for strategic infrastructure, development contributions, and
land development. This has provided a real cost assessment of developing land
within Stirling City Centre.

The Stirling Alliance indicated the developer contribution area includes the three
mixed-use precincts (Station, Southern and Osborne Park) only. Distributing the
developer contribution costs to the target yields in these precincts equated a rate
of $30 per m2. This rate is slightly higher than the $18-20 per m2 rate MacroPlan
Dimasi has previously worked with in central Sydney and Melbourne, where land
values are higher.

                                                                                       xiv
The Stirling Alliance may wish to consider separating Westfield into its own
developer contribution area. Westfield has the potential to expand on their current
site. This will intensify use on their existing land which will directly impact the
capacity of existing infrastructure networks without the need for forward works.
For State land MacroPlan Dimasi has prepared a discounted cash-flow (DCF)
analysis which provides a level of transparency and the opportunity to review
model assumptions. The value capture scenarios examined in this analysis
include:
− Disposal of public land involving sale in a single line;
− Disposal of public land in stages as per the development strategy; and
− A share of revenue streams generated through joint ventures /
development partnerships.
There are a number of additional cost recovery mechanisms, such as a special
area rates and/or various forms of developer contributions which may be applied
to fund infrastructure and services within Stirling City Centre.
Key findings from testing the feasibility of different value capture scenarios
include:
− Revenue from the disposal of State land in a single line would generate
$43.9m (net of sales costs and GST).
− Discounted revenue from the staged disposal of State land would generate
$55.1m (net of sales costs and GST) and $31.2m through ground leases.
− Discounted revenue generated through joint ventures range $8.9m -
$15.6m (net of sales costs and GST) and $31.2m through ground leases.
− While ground leases may generate an ongoing annuity stream and flexible
redevelopment options they produce a lower overall financial return.
− Poor performance of ground leases reflects the costs of providing
infrastructure and services to leasehold land and the impacts of
discounting for future costs and market risks.
− Creation of public assets, i.e. car parks, has the potential to generate
annuity income as well as value through future asset disposal.
xv− Municipal rates and charges range from $52.8m - $92.3m though the
timing of this value capture mechanism will depend on development mix,
yields and staging.
The Stirling Alliance is encouraged to consider the disposal of high value/high
exposure State land in the short term as a means of generating funds required to
deliver important urban infrastructure improvements. This will attract private
investment, unlock long term property values, and drive long term value capture
opportunities through municipal cost recovery mechanisms as required. It will also
help set a price benchmark early in the project lifecycle.
Governance
The Western Australian Planning Commission has the power to make an
improvement plan and create improvement schemes over the plan. Improvement
schemes are only short-term instruments used to facilitate immediate
development. As such a longer term governance mechanism needs to also be
identified for Stirling City Centre to address the 45 year vision time horizon.
Landcorp and the Metropolitan Redevelopment Authority present viable options
for medium term land development and management of Stirling City Centre.
Landcorp powers relate to dealing with land and development on that land i.e.
plan, undertake, promote and coordinate the development of land. The MRA
powers relate to targeted land acquisition, resumption powers, development,
sales conditions, and development performance standards.
Findings
1. Lone person households dominate the Stirling City Centre area (36 per
cent) indicating potential demand for smaller dwellings.
2. Strata development occurring in the established residential precincts will
make future comprehensive redevelopment difficult.
3. The central mixed use precincts carry the greatest development potential
and options to diversify land use.
4. Achieving strategic transport initiatives cannot be contingent upon
developing State land within the City Centre.
xvi5. The Stirling Alliance should consider a commercial approach to
addressing car parking requirements within the centre i.e. front end
delivery of public car parks supported by a comprehensive parking
strategy.
6. Station, Southern and Osborne Park precincts have significant
constraints which will delay development commencement.
7. The developer contribution rate of $30 per m2 is slightly higher than the
$18-20 per m2 rate MacroPlan Dimasi has previously worked with in
central Sydney and Melbourne.
8. Based purely on revenue returned there is a prima facie case for the
straight disposal of State land (generating $90.9m) under the feasibility
assumptions tested.
9. There are opportunities to make use of vacant government land in the
short to medium term through active land banking.
xviiTable of contents
Executive Summary ................................................................................. i
Introduction ........................................................................................... 1
Background 1
Study Scope 3
Report Structure 3
Our Approach 4
Limitations 5
Assumptions 5
Section 1: Development Scenario .............................................................. 7
1.1 Framework 7
1.2 Demographic Profile 7
1.3 Land and Property Uses 9
Concept Scenario 1 Growth Rate 11
Additional Dwelling Potential 13
1.4 Car Parking 15
Regulation 15
1.5 Market Assessment 15
Residential Market 16
Commercial Office Market 19
Retail Market 21
Tourist Accommodation 21
Inter-relationships 23
1.6 Infrastructure delivery 24
1.7 State Land Yields 25
Residential Yields 25
Commercial Yields 25
Retail Yields 26
1.8 Active Land Banking 27
1.9 Development Scenario 27
xvii
i1.10 Funding Options 29
Specified Area Rate 29
Planning Agreements 30
Local Infrastructure Contributions 30
Metropolitan Infrastructure Contributions 30
Section 2: Development Strategy............................................................ 31
2.1 Framework 31
2.2 Land Development Options 31
Land Development 31
Land Release 32
2.3 Car parking 32
Investment 32
Revenue 33
Redevelopment of public car parks 34
2.4 Development Strategy 35
Enabling Policy 35
Enabling Infrastructure 36
Enabling Precincts 36
Staging 37
2.5 Governance 41
Planning and Development Act 41
Local Government Act 41
Landcorp and the Metropolitan Redevelopment Authority 41
Contract of Sale 42
Land Amalgamation 42
Leasehold 42
Expressions of Interest 42
Public Private Partnerships 43
Section 3: Development Financials .......................................................... 44
3.1 Framework 44
3.1 Value Capture Opportunities 44
3.2 The Challenge 45
3.3 Net Value Capture 46
xix3.4 General remarks 47
3.5 Key Findings 48
Appendix 1: References ......................................................................... 50
xxTHIS PAGE IS BLANK INTENTIONALLY xxi
Introduction

    Background

    The Stirling Alliance Public Private Community Partnership (the Alliance) has
    completed a significant volume of work leveraging off a range of specialists to
    inform the creation of a ‘Sustainable 21 Century City’. Stirling City Centre (SCC)
    is allocated as a strategic metropolitan centre under Directions 2031 with a
    defined role to support and complement Perth central area.

    The SCC draft Structure Plan boundary comprises of six precincts (see Figure 2).
    Woodlands, Innaloo and Northern precincts comprise the existing residential
    hinterland. Growth in these precincts has occurred of late in accordance with
    existing planning framework and state infill targets (50%)3. GIS mapping
    illustrates a number of lots in these precincts have already reached capacity and
    have been strata titled.

    The mixed use precincts (Station, Southern and Osborne Park) carry the greatest
    development potential. This is attributed to larger lots with fewer land owners and
    the opportunity to change to a higher yielding use. The Station and Southern
    precincts contain State government land holdings, albeit this land is constrained
    by infrastructure planning and contamination.

    Leveraging revenue from the sale of government land to offset the planned
    infrastructure costs is currently out weighed 2:1 bringing into question the overall
    viability of the project4. The challenge therefore is to manage infrastructure
    delivery in step with a strategy to optimise government return through release of
    land.

    3
        Department of Planning Directions 2031
    4
        Landcorp Program Business Case 2012

1
Figurre 2 Stirliing City Ce
entre Prec
cincts
2Study Scope
MacroPlan Dimasi (MPD) has been commissioned by the Alliance to provide advice
relating to the land development aspects of the SCC. This advice is based on the
conceptual plan prepared and compiled by the Alliance through a team of
consultants (referred to as Concept Scenario 1) with a key focus on the Stage 1
area, i.e. vacant State Government land south of the Mitchell Freeway road
reserve.
In preparing the land development advice, MPD was required to deliver three
work packages:
1. Development Scenario that considers the planning objectives
represented in Concept Scenario 1 and provides advice and
recommendations with respect to achieving its development potential;
2. Development Strategy that provides advice and recommendations with
respect to identifying practicable options and mechanisms for development
structuring and staging under an Improvement Scheme; and
3. Financial Feasibility that assesses the potential revenue options from
the vacant state government land.
This report is the culmination of completing the scoped work packages and
incorporates all of the work undertaken for the Development Scenario,
Development Strategy and Development Financial Feasibility.
Report Structure
There are four sections following this introduction providing a summary of:
Section 1 Development Scenario market assessment and recommendations
on key land and property uses.
Section 2 Development Strategy what (and where) development and/or
redevelopment can occur.
Section 3 Financial Feasibility model customised to the local conditions,
expenditures and returns on vacant state government land.
Section 4 Findings and Actions relating to the three work packages and
overall market view.
3Our Approac
ch
•Refine the sco
ope of works
•Agree date for key meetings annd workshops
•Refine the pro
ogam and reportiing schedules
1. Project •Define key sta
akeholders and m
modes of engagem
ment
In
nception
• Work with thhe specialist engiineering consultaants appointed to o this project to ddevelop an agreed
d
scenario for the long‐term deevelopment of th he Stirling City Centre.
• Assess the market
m and providde recommendattions for:
m distribution and yields for key land/ property uses (residential , commercial and
• Type, mix, d
retail);;
2. Deevelopment • Infrasttructure necessarry to implement the t developmentt scenario; and
sscenario • Matrixx of precincts, lannd uses and infrasstructure requirements covering hhow these will
change e over the 45‐yeaar life of the Stirliing City Centre prroject.
• Using the Devvelopment Scenaario as a basis, pro ovide a coherent strategy for the staged
developmentt of land and infraastructure that will
w enable constru uction of the resiidential,
commercial anda retail componnents of the Stirliing City Centre.
• Allow for flexxibility to ensure tthat contingency plans (“plan B... C...”) are built intto the Strategy in
n
3. Deevelopment order to deco onstrain the projeect should some component of inffrastructure or innvestment decisio on
be delayed orr changed througghout the projectt life‐cycle.
sstrategy
• The project will
w need to evolvve over time, whilst responding to changing econom mic/property cyccles
as well as cha
anging demograpphics and businesss conditions. These will determinne the changes in n
demand overr time which will dictate the form, function and ratte of developmennt of the Stirling
City Centre. The Developmennt Financial Feasibility will therefore be a plan thatt both guides and
d
4. Financial responds to the
t developmentt evolution of the e SCC.
feeasibility
• Deliver a fina
al report which inncorporates all staages of the project
• Provide succinct findings and recommendation ns that are directtly supported by tthe research and
evidence gathered during thee research process.
5. Finaal report and • Prepare and deliver two preseentations for the Stirling Alliance meetings
m in Deceember 2013
presentations
4Limitations
There are a number of limitations to this paper which impact on the overall rigor
of the Land Development Advice which can be provided. These relate (largely) to
consultant work being completed in parallel that would otherwise be the basis of
any feasibility testing including:
1. The SCC project vision 45 year time horizon sits outside the existing
planning and funding framework and mechanisms currently available to
the State Government, Stirling Council and the Alliance.
2. Yield assumptions derived to date are form based and have varied
based on assumptions of land available for development, currently
assumed 9.7Ha, and assumed car parking provision.
3. Yield assumptions used for utility and transport infrastructure cost
analysis are different resulting in incomparable cost projection.
4. Few studies consider the Structure Plan area as a whole. Many focusing
on government landholdings or even more micro sub-sets making it
difficult to compile a full and current picture of the entire study area.
5. The approach to car parking is yet to be agreed with the Alliance
stakeholders.
6. Yield assumptions are currently being revised and refined i.e. impact of
the car parking on yields is yet to be fully factored.
7. Ongoing testing of the road network capacity and a lack of agreed
direction for strategic road infrastructure means there is a lack of
certainty over government land available for development.
8. Delivering strategic infrastructure up front will most certainly impede a
successful commercial outcome over the initial 5-10years.
Assumptions
Given the project limitations and requirements, MPD has had to make a series of
assumptions in order to prepare the Development Scenario including:
1. Land Development Advice looks in detail at government land as defined
in Concept Scenario 1 rev H providing context advice only for the
balance of the structure plan area.
52. Estimated yields taken from Hames Sharley September 2013
assumptions and SCC September 2013 assumptions that applied
parking to State government land only.
3. Infrastructure costs taken from the Program Investment Options
(Landcorp 2012) supplemented by the draft Utilities Infrastructure
Strategy costs (GHD 2013).
Note: the draft Utilities Infrastructure Strategy uses Hassell 2011 yields
4. Regional and strategic infrastructure has been decoupled from
infrastructure requirements for land development.
5. The Urban Stream can be delivered in parts provided hydraulic capacity
is maintained.
6. The Western Power sub-station on Scarborough Beach Road will remain
in-situ for 5-10 years.
7. Government land south of Stirling Station is locked up until freeway
access is resolved.
8. Scenario Development is based on the Metropolitan Land Use Forecast
Survey (MLUFS).
6Section 1: Development Scenario
1.1 Framework
A 45 year time horizon (to 2056) set by the Alliance is the basis of the scenario
testing. MPD has used the following approach in preparing the Development
Scenario:
− Decouple strategic infrastructure spend from infrastructure spend required
to release state government land
− Define prerequisites to major infrastructure and development
− Pursue a balance between capital infrastructure expenditure and
development staging over time
− Leverage off private development i.e. Developer Contribution Schemes and
levies
− Identify a staging pattern that continues to gain momentum
− Options to start i.e. lighter, quicker, cheaper
1.2 Demographic Profile
The socio-economic profile of the SCC area was derived from ABS Census 2011
data. Data has been assessed at the Statistical Area 1 level, which is the finest
grain data level provided by the ABS.
The 2011 Census recorded 1,535 dwellings in the SCC area. Market
characteristics when compared to the broader Stirling Local Government Area
(LGA) include:
− Higher personal (around 25 per cent) and household (around 41 per cent)
incomes
− Smaller household sizes
− More than half the number of traditional families (16 per cent) and a
higher share of lone person households (36 per cent)
− Still large dominance of separate houses (49 per cent) but a higher
proportion of medium density product (47 per cent) i.e. town houses
7− Higher level of home ownership and lower share of renters
Table 1: Key Socio-Economic Characteristics
Stirling Stirling Stirling Stirling
2011 SCC Area WA
Coastal Central SE LGA
Population and Households
Persons 3,717 67,945 110,971 16,787 195,702 2,239,170
Households 1,535 26,396 44,494 6,428 77,318 794,159
Average Household Size 2.0 2.4 2.3 2.4 2.4 2.6
Income and Wealth
Median Personal Income $43,122 $41,401 $31,755 $39,681 $35,353 $34,623
Variation from WA 24.5% 19.6% ‐8.3% 14.6% 2.1% ‐
Median Household Income $103,225 $87,809 $61,737 $88,278 $70,393 $73,261
Variation from WA 40.9% 19.9% ‐15.7% 20.5% ‐3.9% ‐
Occupation
Managers & Administrators 12% 15% 10% 16% 12% 12%
Professionals 26% 32% 22% 35% 27% 20%
Technicians & Tradespersons 16% 13% 15% 9% 14% 17%
Community & Personal Services 8% 9% 10% 9% 9% 10%
Clerical & Administrative 18% 15% 16% 14% 15% 15%
Sales 9% 9% 10% 9% 9% 9%
Machinery Operators & Drivers 4% 3% 6% 3% 5% 8%
Labourers & Related 8% 6% 10% 5% 8% 10%
Occupation by Sector
White Collar 61% 61% 48% 65% 54% 47%
Blue Collar 30% 22% 32% 17% 27% 34%
Service Sector 9% 17% 20% 18% 19% 18%
Age Distribution
0‐14 13% 17% 17% 16% 17% 20%
15‐19 5% 6% 5% 7% 6% 7%
20‐29 15% 15% 18% 16% 17% 15%
30‐39 14% 15% 16% 13% 16% 14%
40‐49 12% 14% 13% 15% 14% 15%
50‐59 10% 12% 11% 13% 12% 13%
60+ 31% 20% 19% 20% 20% 18%
Median Age 42.0 37.0 35.0 38.0 36.0 36.0
Birthplace
8Australia 59% 68% 57% 69% 62% 67%
Overseas 41% 32% 43% 31% 38% 33%
Family Type
Couple with dependent children 16% 45% 39% 47% 42% 46%
Couple with non‐dependent children 9% 6% 7% 6% 6% 7%
Couple without children 29% 25% 24% 23% 24% 24%
One parent with dependent children 3% 7% 9% 5% 8% 9%
One parent with non‐dependent children 6% 3% 4% 2% 4% 3%
Other family 1% 1% 2% 2% 2% 1%
Lone person 36% 12% 15% 15% 14% 10%
Tenure Type
Privately Owned 40% 34% 30% 32% 32% 30%
Being Purchased 27% 34% 32% 33% 33% 39%
Private Rental 28% 27% 31% 30% 30% 26%
State Housing Authority Rental 0% 4% 5% 1% 5% 4%
Other 5% 1% 1% 4% 1% 1%
Dwelling Type
Separate House 49% 57% 52% 55% 54% 71%
Semi‐detached House, Townhouse 47% 23% 27% 14% 25% 9%
Flat, Unit or Apartment 3% 10% 12% 22% 12% 7%
Other 0% 0% 0% 0% 0% 1%
Source: ABS, Census 2011
1.3 Land and Property Uses
Land use categories are based on the Western Australian Standard Planning Land
Use Classification.
Yield assumptions used are taken from the Hames Sharley September 2013 built
form study. These have been adjusted against SCC September 2013 i.e.
accounting for parking at a rate of 250 bays per hectare for the State government
land parcels. The below yields are given for the 45 year time horizon set by the
Alliance.
9Table 2: Total Floor space under existing and proposed frameworks by
precinct and land use
Total Floor space (NLA)
Precinct Land Use Existing Concept Scenario 1
Residential** 34,200 254,000
Office 20,000 278,470
Community 1,000 4,091
Station
Retail 20,000 58,426
Entertainment 1,000 -
Industrial - -
Total (NLA) 76,200 600,148
Residential** 6,100 127,500
Office 5,000 40,910
Community 2,000 2,980
Southern
Retail 60,000 119,30
Entertainment 5,000 7,680
Industrial - -
Total (NLA) 78,100 298,500
Residential** - 202,800
Office - 101,130
Osborne Park
Community - 5,460
Retail - 184,810
Entertainment - -
Industrial 265,000 -
Total (NLA) 265,000 494,200
Residential** 55,220 97,350
Office 5,000 16,350
Community 15,000 27,515
Northern
Retail - 500
Entertainment - -
Industrial - -
Total (NLA) 75,220 141,715
Residential** 110,160 212,400
Office - -
Community - 2,660
Innaloo
Retail - 400
Entertainment - -
Industrial - -
Total (NLA) 110,160 215,460
Residential** 38,700 95,400
Office - 12,670
Community - 2,015
Woodlands
Retail - 13,065
Entertainment 10,550 -
Industrial - -
Total (NLA) 49,250 123,150
*SCCA2013 yields for State land south of the freeway applying 250 parking bays per Ha
** Number of units
10Under Concept Scenario 1 Osborne Park will see the biggest transition from
industrial (presently) to mixed use. Woodlands, Innaloo and Northern precincts
will maintain a residential focus with the Northern and Innaloo precincts doubling
in size and Woodlands almost tripling. Station and Southern will see land use
diversification with the introduction of major residential and office components
(from the existing retail dominance).
The Station, Southern and Osborne Park precincts will be mixed use precincts.
Station will have an emphasis on offices, Southern will have an emphasis on retail
and Osborne Park will have an emphasis on both retail and offices.
The precinct north of the former landfill will remain as primarily a hospital and
residential area. Innaloo Precinct is largely residential and planned to remain as
such under the draft Activity Centre Structure Plan. Woodlands Precinct will be a
medium to high density residential area, with few mixed use developments.
Concept Scenario 1 Growth Rate
Concept Scenario 1 target yields for the SCC are on average higher than those
proposed by current zoning.
The impact of applying select MLUF development curves to the precinct yields set
by Concept Scenario 1 over the 45 year time horizon (to 2056) is shown in
Figures 3 and 4 below. Rezoning of Osborne Park to mixed use results in this
precinct carrying much higher population and dwelling capacity than current
projections. The proposed denser housing offer i.e. apartments in the Station
precinct results in higher capacities in this location also.
Comparing MLUFs to Concept Scenario 1 population projections shows an increase
of one point to six per cent annual average 2011 to 2041. Osborne Park still
attracts the highest precinct growth and is up six points to 33 per cent. Station
and Southern also increase, from four and three per cent respectively to ten per
cent. This is likely due to the denser housing offer being proposed.
Figure 3: Population Projections by Precinct 2011-2071
11Source
e: MPD using
g MLUFs
Conce
ept Scenario 1 dwellin
ng projectio
ons give ris
se to a similar story. Overall the
ere
is an increase off one point to six per cent annual average 2011 to 20
041 from the
s base. Os
MLUFs sborne Park
k, Station and Southern precinc
cts attract the greate
est
growtth shift, increasing to three, six a
and seven points
p respectively.
Figurre 4: Dwelling Projections by Precinct 2011-2071
2 1
Source
e: MPD using
g MLUFs
12Additional Dwelling Potential
Taking into account build life, lot size and vacant land within the study area, the
additional dwelling potential can be calculated.
Table 3: Dwelling Age profile - No. of dwellings as at 2012
Build Innaloo Northern Southern Station Woodlands Grand
Period Precinct Precinct Precinct Precinct Precinct Total
Pre 1960 82 2 2 4 90
1960s 152 69 8 4 49 282
1970s 58 39 5 36 58 196
1980s 24 3 11 68 28 134
1990s 149 6 4 8 13 180
C21 399 97 13 69 26 604
unknown 119 38 2 10 252 421
Total 983 254 45 195 430 1907
Source: Integrated Land Information Database
Build life is taken as 30 years meaning, unless individual houses are considered of
heritage significance, dwellings built pre-1980 are considered ripe for
redevelopment.
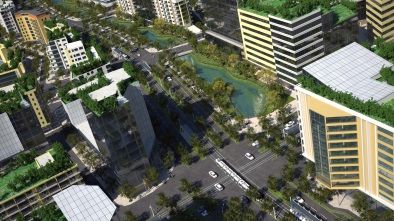
Looking more closely at the existing residential precincts, densities are generally
higher in the Innaloo and Woodland precincts currently at around R40-60 than in
the Northern precinct, which is currently only around R20. The additional
development potential in these locations show Woodlands and the Northern
Precinct are mostly built out to capacity (see Figure 5).
Over the 45 year time horizon, however, there is theoretically the potential for all
three residential precincts to regenerate twice.
13Figurre 5: Stirlin
ng City Ce
entre Addittional Dwelling Pote
ential
141.4 Car Parking
Regulation
There are two regulatory mechanisms commonly used to ensure the level of
parking provided remains at specified levels:
• Maximum level of supply
• Maximum and minimum parking ratios
Stirling’s emerging parking strategy sets maximum parking standards based on
the number of cars permitted on a hectare of land for non-residential uses. This is
set at 250 bays per hectare across the entire structure plan area. Residential
provision has been set at 1.25 bays per dwelling including visitor parking. The
proposed car parking standards of 250 bays per hectare for non-residential plus
1.25 bays per dwelling is commercially constrained. This blanket approach mirrors
the Perth Parking Policy and does not relate to patterns of use.
Maximum and minimum parking thresholds are based on the scale of
development. Thresholds for residential parking should account for local average
household size, car ownership levels and quality of public transport. Thresholds
for commercial parking account for the employment density of the centre and
access to public transport. Thresholds for retail parking are influenced by the
prevailing retail hierarchy. This typically reflects the role and function of the
centre.
1.5 Market Assessment
This section looks at a series of high level market assessments of current and
forecast market situation for a number of segments in the SCC and surrounding
areas.
15Table 4: Indicative Uses for Stirling City Centre
Sector Current Position Forecast Outlook Likely Timing Implications
Residential • Diversification in housing • Apartment‐style dwellings • Short‐term market focus on
products towards higher represent the most feasible apartments / high density
density form of residential dwellings
• Strong growth in sales prices development for • Market potential for 75‐100
resulting in decreased consideration by Local apartments per year on State
affordability and increased Government due to the land.
attractiveness of higher intensity of built form and the
density products associated land take
Commercial • Strong CBD market • Reasonably high levels of • Given the current infancy of
underpinned by resource white collar workers make the SCC, and possible
related activities Stirling City a logical location incubation period of sub‐
• Sub‐regional office markets for commercial office space regional office market, the
becoming increasingly further provision of
attractive commercial space is
suggested to be appropriately
phased
• Yield at 72,000sqm provide
15‐20% of the total floor
space required
Retail • Four major competitors • Significant population growth • Potential additional
within 5‐10km MTA with and potential mixed use 50,000sqm of core shop retail
retail GLA of 38,000‐ development in the SCC floors over the next 20 years
68,000sqm expect to boost retail trade
• Relatively high residents volume drawn from beyond
income in the MTA (Main the trade area
Trade Area) capturing higher • Strong opportunity for
retail expenditure specialty, DDS and food
catering at the SCC
Tourist • Significant rise in • Potential opportunity for • Serviced apartments to
Accommodation international tourist nights in apartment style products to address current demand for
Stirling, with education and enter the Stirling tourism multi‐night stays could be
visiting friends and relatives market and capitalise on the delivered as part of early land
being major drivers large number of international release.
• Strong preference away from visitors
hotels, motels and resorts for • Additional requirement for
international visitors tourist accommodation will
be tested by the feasibility
model
Residential Market
Overall population growth in Stirling LGA has increased significantly since 2006,
with an average annual growth rate of 2.6 per cent during the period 2006-2011.
16Fiigure 6: Es
stimated Resident
R P
Population
n and Annu
ual Growtth
So
ource: ABS 3235
3
he time serries to asse
Th ess growth exists at a higher statistical leve
el i.e. Stirling (C)
– Central. The
T growth shown in Table 5 represents
r 6,129 dwe
ellings or 15
1 per
ce
ent over the
e 10 year period
p from
m 2001-2011.
eparate housing stock
Se k showed a relatively slow increase. This ssuggests th
hat the
diversificatio
on in housing stock has seen a progress
sive shift ttowards medium
m
ather than high
ra h density dwellingss.
ousing Stock by Typ e, Stirling
able 5: Ho
Ta g (C) – Cen
ntral
No. Growth % Growth
D
Dwelling Type 2001 20
006 2011
2001‐2011 2001‐2011
SSeparate house 24,370 660% 25,305 59% 26,507 56% 2,137 8.8%
SSemi‐detached,, row or
11,594 228% 11,930 28% 14,123 30% 2,529 21.8%
terrace house, townhouse
t
FFlat, unit or apaartment 4,635 111% 5,752 13% 6,347 14% 1,712 36.9%
O
Other dwelling 13 0% 31 0% 15 0% 2 15.4%
N
Not stated 266 1% 63 0% 15 0% ‐251 ‐94.4%
TTotal 40,878 1000% 43,081 100% 47,,007 100% 6,129 15.0%
So
ource: ABS Census
C 2011
1
17Building approva
als in Stirling LGA hav
ve seen a notable shift away fro
rom detached
es towards a more den
house nse residen
ntial building form durring the passt decade i.e.
townh
houses, unit, flats and
d apartmentts.
Apartment-style dwellings
s represen
nt a high
hly feasible
e form o
of residenttial
opment forr SCC due to the inte
develo ensity of built
b form and
a the asssociated land
take.
ncreased diversificatio
The in on of hous ing stock in Stirling (C) – Centtral has been
the re
esult of a combinatio
on of incre
eased median house prices (low
wer levels of
afford
dability) and
d consisten
nt levels of apartment demand.
Price growth, faster than that
t omes, has resulted in decreased
of inco d affordability
herefore in
and th ncreased th
he attractiv eness of to
ownhouses, apartmen
nts and oth
her
types of higher density
d dwe
ellings to p rospective buyers.
Figurre 7: Resid
dential Salles and Me
edian Price
es, Stirling
g (C), 200
00-2013YT
TD
Source
e: RP Data
18Commercial Office Market
Demand for mineral commodities has driven capital investment in the state,
underpinning economic activity. The strength of this investment has in turn driven
a strong requirement for commercial office space in Perth. The Perth commercial
office market has been one of the strongest CBD markets through the 2000s.
The supply of commercial space in Perth has increased steadily over this period,
with the greatest supply occurring over the last few years.
Table 6: Current Office Development Activity, Perth, Sep 2013
Property Precinct NLA (sqm) Type Status Completion Major Tenant
Perth CBD
1006 Hay St West CBD 3,104 New UC Sep‐13
WorkZone ‐ 202 Pier St CBD Fringe 27,910 New UC Sep‐13 Leighton
Veil 253 ‐ 253 St Georges Tce West CBD 3,577 Mooted DA Jul‐14
Cloisters ‐ 863 Hay St Mid CBD 10,947 New UC Dec‐14 Aurecon
999 Hay St West CBD 10,800 New UC Mar‐15 GHD
May Holman Centre ‐ 32 St
Mid CBD 14,895 Refurb UC Mar‐15 Legal Aid
Georges Tce
Treasury Building ‐ Cnr
Mid CBD 30,219 Mooted DA Jun‐15 Public (state)
Barrack & St Georges Tce
Kings Square 1 ‐ Wellington St West CBD 23,000 New UC Jun‐15
Kings Square 2 ‐ Wellington St West CBD 19,000 New UC Jun‐15 Shell
Kings Square 3 ‐ Wellington St West CBD 8,000 New UC Jun‐15 Leighton
Kings Square 4 ‐ Wellington St West CBD 13,000 New UC Jun‐15 HBF
123 St Georges Tce West CBD 30,000 New UC Mar‐16 Brookfield
Bishops See II ‐ 239 St
West CBD 46,000 Mooted DA Dec‐16
Georges Tce
Elizabeth Quay Site 4 Mid CBD 52,355 Mooted EP Jul‐17
Total 292,807
West Perth
11‐13 Lucknow Place West Perth 765 Refurb UC 2013
1 Ord Street West Perth 3,448 New UC 2013
1160 Hay Street West Perth 1,500 New UC 2013
1101 Hay Street West Perth 2,264 New UC 2013
959 Wellington Street West Perth 1,414 New DA Mooted
Total 9,391
Source: Savills Research
19Note: UC = under construction; DA = development approval; EP = early planning
Sub-regional office markets are becoming increasingly attractive options for
potential tenants. Stirling LGA stands to benefit from any shift away from the
Perth CBD.
Table 7: Key Market Indicators, Perth CBD & West Perth, Jun 2013
Perth CBD West Perth
Key Indicators Premium A Grade B Grade A Grade B Grade
Low High Low High Low High Low High Low High
Rental ‐ Gross
858 995 653 843 508 663 601 705 503 597
Face ($/sqm)
Rental ‐ Net Face
775 905 595 775 450 595 500 575 425 495
($/sqm)
Rental ‐ Net
698 815 513 668 388 513 456 525 388 452
Effective ($/sqm)
Outgoings ‐
Operating 115 120 95 115 75 90 80 90 50 55
($/sqm)
Outgoings ‐
45 60 45 60 45 60 65 90 65 90
Statutory ($/sqm)
Outgoings ‐ Total
160 180 140 175 120 150 145 180 115 145
($/sqm)
Typical Lease
7 10 5 7 5 7 5 7 5 7
Term
Yield ‐ Market (%
7.00% 7.75% 7.50% 8.75% 9.00% 10.00% 7.75% 8.75% 8.50% 10.00%
Net Face Rental)
IRR (%) 9.00% 9.50% 9.00% 10.25% 9.75% 11.00% 9.00% 9.75% 9.00% 11.25%
Cars Permanent
750 800 700 750 550 685 350 375 300 350
Reserved ($/pcm)
Cars Permanent
700 765 600 700 500 600 350 375 300 350
($/pcm)
Capital Values
9,000 10,000 6,500 9,000 4,500 6,600 5,700 7,400 4,250 5,800
($/sqm)
Source: Savills Research, June 2013
20Th
he central location of the SC
CC in rela
ation to th
he Perth C
CBD (and State
Pa
arliament) and the Mitchell
M Free
eway has the potenttial to mak
ke this centre an
atttractive op
ption for the
e relocation
n of govern
nment office
es.
CC has a higher
SC h prop
portion of p
professiona
als (61 per cent) with
hin its occupation
m
mix than the
e broader LGA
L area ((54 per cen
nt), indicatiing a high rate of res
sidents
em
mployed in occupation
ns requiring
g office floo
or space.
R
Retail Marrket
Allthough SC
CC is classified as a strategic centre with
h attractorrs like IKEA
A, the
ce
entre is co
onsidered to have a metropolitan-wide draw. How
wever, We
estfield
In
nnaloo itself contains discount d epartment stores like
e Target, w
which has a more
lo
ocalised dra
aw. For the
e purposes of analysis
s the main trade area (MTA) has
s been
efined gene
de erally as co
omprising a
an area within a 5-7km radius of existing
g retail
prrovisions att Westfield Innaloo.
esidents living within the MTA
Re A have hiigher hous
sehold disp
posable incomes
re
elative to th
he rest of Perth.
P Thiss means the
e SCC has strong pottential to capture
hiigher relative volumes of expen
nditure than
n similar sized retail centres in other,
less affluent areas of th
he metropo
olitan area.
able 8: Tra
Ta ade Area Competitiv
C ve Regional and Sub
b-regionall Supply
So
ource: PCA (2010)
( and MPD
M
To
ourist Ac
ccommoda
ation
Th
he number of visitors to Stirling (C) has sh
hown a grow
wing trend with fluctu
uations
du
uring the period from financial ye
ear 2000-0
01 to 2012-13.
21You can also read