State of the County 2020 Focus on East Sussex

Page created by Kathryn Price
 
CONTINUE READING
State of the County 2020 Focus on East Sussex
State of the County 2020
                                    Focus on East Sussex

Chalk Farm Willingdon and Polegate Wind Turbines
State of the County 2020 Focus on East Sussex
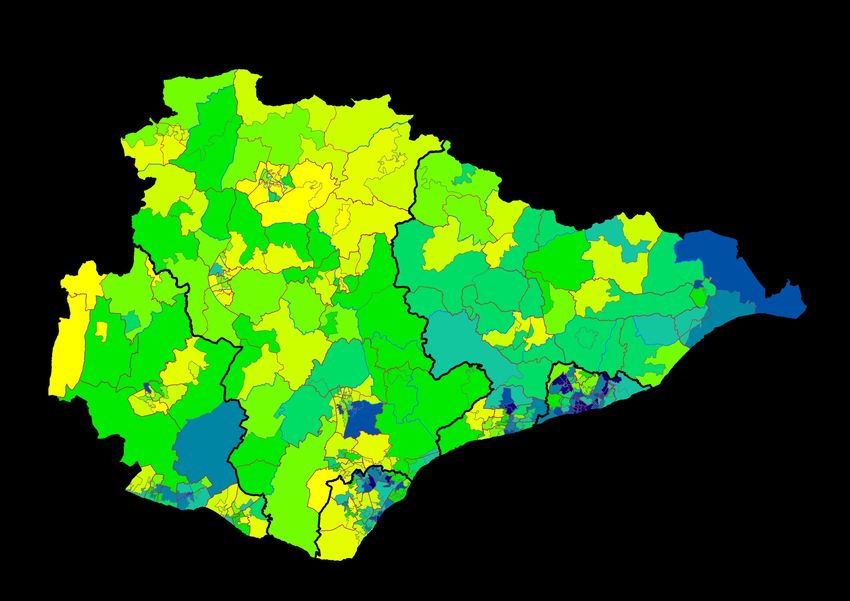
State of the County 2020: Contents                                                                                          2

 Population                          559,409                              Population 2020                              3
 Housing                             246,700                  Dwellings in the county 2018                             6

 Deprivation                         22        Small areas in 10% most deprived in England                             9
                                                                                               Most            Least

 Health                              1,476              Total cases of COVID-19 30/06/20
                                                                                                      A & E
                                                                                                                       10

 Environment                         13%              Required reduction in CO2 emissions                              13
                                                                                                         £

 Economy                             68%           Businesses furloughing staff due to Covid
                                                                                                                       14

 Civil Society                       50                         Mutual Aid Groups created                              21

 Schools                             500            More secondary school places planned
                                                                                                      School
                                                                                                                       22
 Children                            601                Looked after Children March 2020                               24

 Adults                              9,533 Adults receiving long term support 2019/20                                  27

 Data                                32                             Key outcome measures                               32
State of the County 2020 Focus on East Sussex
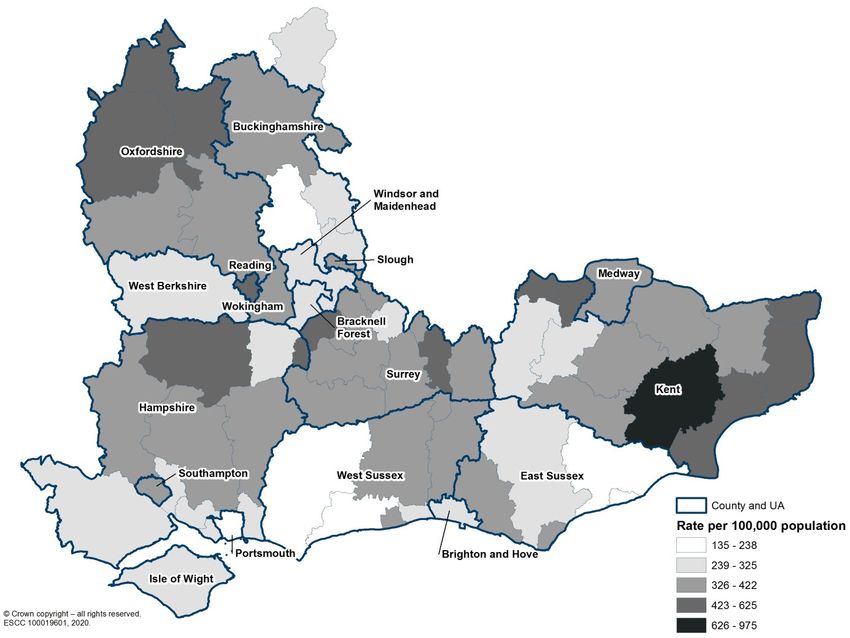
State of the County 2020: Population                                                                                                                                                                          3

                                                                                                                                                                                    Population 2024
 Population 2020                Births                       Deaths                   Migration in                                  Migration out

  559,409          +           20,136           -          25,944              +      144,961                       -               120,129                          =                578.433
                                                                                                                                                                                    +19,024 (3.4%)

Population change 2020-2024: compared to 2020, by 2024 there will be:

                                                                                                       Projected population by age 2020-2024
                       19,024 more people living in East Sussex (+3.4%)                 350,000
                                                                                                                                           Up 1.4%                                                  2020
                                                                                        300,000                                                                                                     2024
                       An increase of 2.2% (2,366 people) in the number of children     250,000
                       and young people
                                                                                        200,000

                                                                                        150,000                                                                     Up 8.0%
                                                                                                                  Up 2.2%
                       An increase of 1.4% (4,407 people) in the working age
                                                                                        100,000
                       population
                                                                                         50,000                                                                                             Up 10.4%
                                                                                                  0
                       8.3% (12,252)        more people aged 65 and over                                         0-17                      18-64                      65-84                       85+

                       In East Sussex 4.3% of people will be aged 85+, a greater                Age band                                 2020                         2024                       Change
                       proportion than England, 2.7%. Ranked 2nd in England for the
                       highest proportion of population 85+, (ONS estimate 2019)         0-17                                             107,350                       109,720                           2,370

                                 Population 2024                                         18-64                                            305,090                       309,500                           4,410
  East Sussex                                                          England
                                          East                                           65-84                                            124,570                       134,500                           9,930
                       Age Range                    England
                                         Sussex
                       0-17                 19.0%       21.2%                            85+                                                 22,390                       24,710                          2,320
                       18-64                53.5%       59.4%
                                                                                         All people                                       559,410                       578,430                        19,020
                       65-84                23.3%       16.8%

                       85+                   4.3%         2.7%                          Source: ESCC population projections (dwelling led) April 2020. All figures round to nearest 10, therefore totals may not sum.
                                                                                                ONS trend-based population projections England May 2019
State of the County 2020 Focus on East Sussex
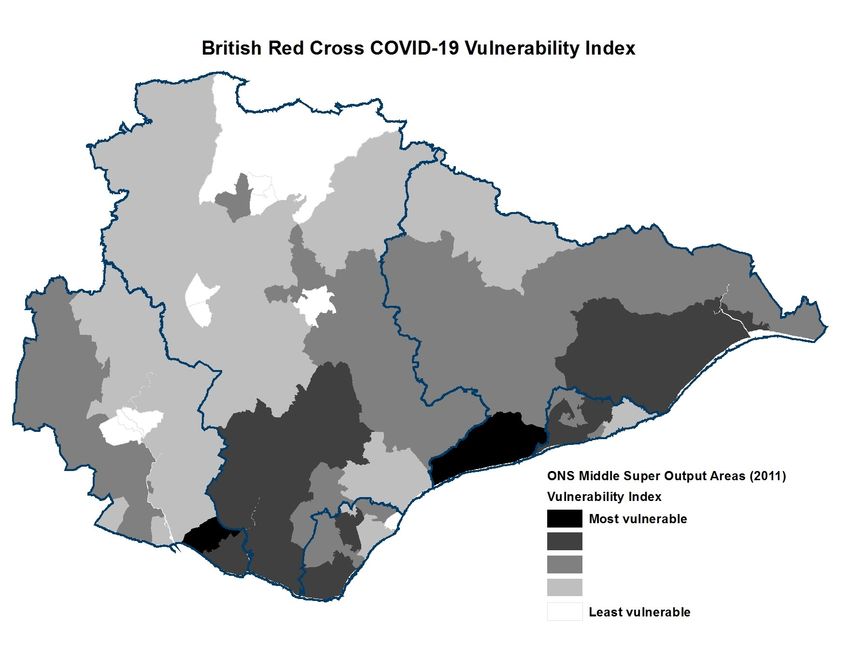
State of the County 2020: Population                                                                                                                                               4
                                                                                           Districts population change: by 2024 there will be
      Age band
                                        East Sussex population
                                                                                  • An increase of 14.1% (870) more people aged 85+ in Wealden; the smallest
     0-17                                 change 2020 - 2024                        increase will be in Hastings, 8.4% (220)
                                                                                  • 10.1% (3,720) more people aged 65-84 in Wealden, and 8.4% (1,380) more
     18-64                                                                          people in Hastings, Lewes will see a 6.4% (1,450) increase                          10,000

     65-84                                                                        • Wealden will also see the largest increase in the working age population (18-64),    9,500
                                                                                       of 4.2% (3,680)
                                                                                                                                                                         9,000
     85+                                                                                     • Eastbourne will see a 1.3% (730) fall in the working age population
                                                                                                                                                                         8,500
                                                                4,000                                                                                                    8,000
                                                                3,500             2,000                                                                                  7,500
                                                                3,000             1,500                                                                                  7,000
                                                                2,500             1,000                                                                                  6,500
                                                                2,000               500                                                                                  6,000
                2,000
                                                                1,500                 0                                                                                  5,500
                1,500
                                                                1,000              -500                                                                                  5,000
                1,000                                                                        Rother
                                                                 500                                                                                                     4,500
                   500
                                                                   0                                                                                                     4,000
                       0                                                Wealden                                      1,500
                                   Lewes                                                                                                                                 3,500
                                                                                                                     1,000
                                                                                                                                                                         3,000
                                                                                                                       500
                                                                                  2,000
                                                                                                                                                                         2,500
                                                                                  1,500                                  0
                                                                                                                               Hastings                                  2,000
                                                                                  1,000
                                                                                                                                                                         1,500
                                                                                    500
                                                                                                                                                                         1,000
                                                                                      0
                                                                                                                                                                          500
Source: ESCC population projections (dwelling led) April 2020                      -500
All figures round to nearest 10, therefore totals may not sum                                                                                                               0
                                                                                  -1,000                                                                                         East Sussex
                                                                                           Eastbourne
State of the County 2020 Focus on East Sussex
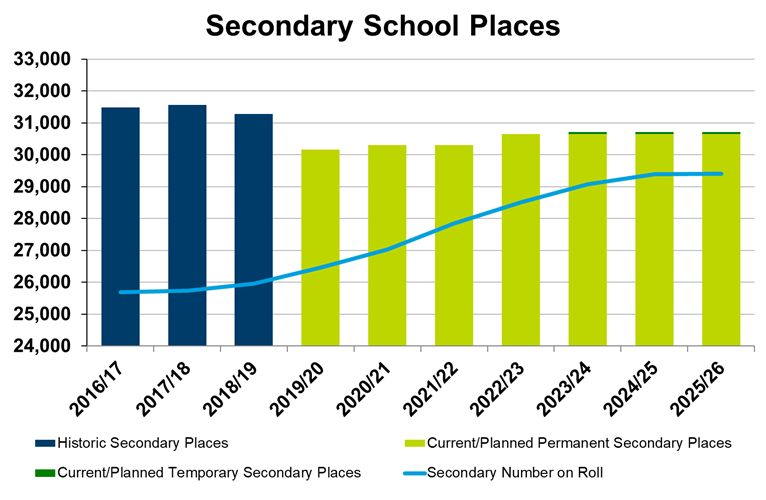
State of the County 2020: Population                                                                                                                                                                                      5

 Older people moving in and out of East Sussex 2015 - 18

 •   11,656 people aged 65+ moved into East Sussex from elsewhere in England between 2015 - 2018. 7,652 moved out of the county, making the net increase 4,004
 • The largest net inflow of people arrived from Kent, Brighton & Hove, Croydon and Surrey

 • The largest net outflow of people aged 65+ was to Devon, with   70 more people moving there than coming to East Sussex; second was Somerset with a total of 47
 •   2,659 people aged 65+ moved to East Sussex from London, with only 570
     people moving into London
 • Households of people aged 60+ have the highest average levels of disposable
   income, when compared to all other households
 • The average life expectancy at 65 for people in East Sussex is a further   20.8 years

 Areas with highest net inflow of Areas with highest net outflow of internal migration
      internal migration 65+                              65+
            2015 - 2018                               2015 - 2018
Area               In    Out Net Area                                    In Out Net
Kent            1,961 1,246 715 Devon                                    163 233 -70
Brighton and                      Somerset                                93 140 -47
                   977    469 508
Hove                              Isle of Wight                           57 95 -38
Croydon            432     70 362      Gloucestershire                           63    96 -33
Surrey             786    427 359      Dorset, Bournemouth, Christchurch
                                                                                192 216 -25
                                       and Poole
Bromley            368    113 255
                                       Nottinghamshire                           30    53 -23
West Sussex      1,375   1,179   196
                                       Cheshire East                             13 34 -21
Bexley             152      35   117
                                       Suffolk                                  125 138 -13
Hertfordshire      236     123   113
                                       Leicestershire                            41 54 -13
Merton             127      14   113
Sutton             155      42   112
Lewisham           105     14    91        Main net flows 2015 - 2018 65+
Greenwich           96     13    83
                                                        Net movements in
Essex              252    171    81
Lambeth             86      7    79                     Net movements out
Wandsworth          92     14    78

                                                                                                 Sources: ONS ‘Internal migration: detailed estimates by origin and destination local authorities, age and sex’, and ENRICH and the
                                                                                                 National Institute for Health Research (NIHR)
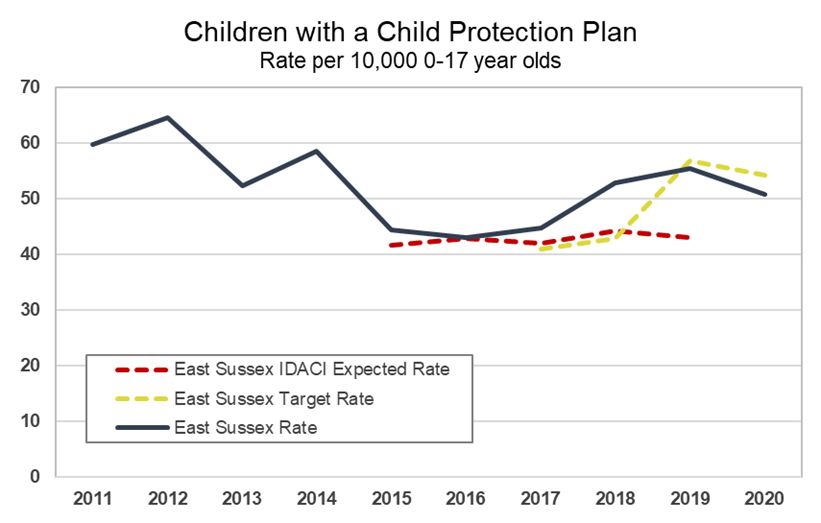
State of the County 2020 Focus on East Sussex
20                                                                                                                                                                         63,000

         State of the County 2020: Housing                                                                                                                                                                                                                    6
                              2020                                                                        2024                                          Households percentage by tenure type 2011
                                                                                                                                         100
15                                                                                                                                                  256,000
                                                                                                                                                       15                      16                    13                     12                  10
                                                                                                                                          90
                           246,700                                                                      259,400                                                                                                             14                  11
                                                             Households                                                                   80                                                          15
                                                                                                                                                         23                    29
                                                               +5.1%                                                                      70
                                                                                                                                          60
                                                                                                                                          50
                              58,800           Households with Children                                                                   40
                                                                                                                                                                                                      73
                                                63,000                                                     59,200                                       62                    55                                            74                  79
10                                                     +0.7%                                                                   64,000     30
                                                                                                                                          20
                    Source: ESCC household projections by type, dwelling led, April 2020
                                                                                                                                          10
                                                                                                                                           0
                                                                                                                                                 Eastbourne Hastings                             Lewes                 Rother               Wealden
                     2018
                                                                                                                                                         Social rented, Shared ownership, Rent free                          Source: ONS KS402, Census 2011
              253,070  dwellings
                   256,000                                                                            6.6% of
 5                                                                                                   248,000                                             Private rented
          17,010 Registered provider                                                              households had
               (social landlord)                                                                   too few rooms
                                                                                                                                                         Owned
            9,590 Council houses                                                                                                          Notes
                6,962 Vacant                                                                                                              •    A dwelling is a self-contained unit of accommodation used by one or more households as a home,
                                                                                                                                               e.g. a house, apartment, mobile home, houseboat. A single dwelling will be considered to contain
                                                                                                                                               multiple households if either meals or living space are not shared
                                                                                           South East                England
                                                                                             7.5%                     8.7%                •    A household consists of one or more people who live in the same dwelling and also share meals or
 0        Sources: Census 2011, MHCLG live tables on dwelling stock including vacants
                                                                                                                                               living accommodation, and may consist of a single family or some other grouping of people
                                                                                                                                         •
          Note: Affordable housing includes housing for social rent, shared ownership, low cost home ownership and sub-market rent
     0                          0.5                 1                                                   1.5                     2                         2.5includes council houses and
                                                                                                                                               Social rented                          3 registered providers such as Housing Associations or
                        Local Plans (adoption date)                                                 Number of dwellings over plan period       not-for-profit housing providers approved and regulated by Government. They provide homes for
                                                                                                                                               people in housing need and many also run shared ownership schemes to help people who cannot
 Eastbourne: Core Strategy Local Plan (February 2013)                                                   5,022 (2006-2027) 239 per year         afford to buy their home outright

 Hastings: The Hastings Planning Strategy (February 2014)                                               3,400 (2011-2028) 200 per year                                       Completed new dwellings
 Lewes: Joint Core Strategy (June 2016)                                                                 6,900 (2010-2030) 345 per year         1,800

 Rother: Core Strategy (September 2014)                                                                 5,700 (2011-2028) 335 per year         1,500
                                                                                                                                               1,200                                                                                                   Market
 Wealden: Core Strategy (February 2013)                                                                 9,440 (2006-2027) 450 per year
                                                                                                                                                                                                                                        1,439          dwellings
                                                                                                                                                 900            943              1,201             1,164
 Local Plans produced by district and borough councils and the South Downs National Park Authority                                                                                                                   1,090                             Affordable
 show the level and distribution of growth across the County. Currently around 2,000 new homes are                                               600                                                                                                   dwellings
 proposed per year alongside additional employment workspace.
                                                                                                                                                 300
  Local Plans are being reviewed and have to consider higher housing targets to meet the assessed                                                               415               308               281                                  295
                                                                                                                                                                                                                       226
2 need. For example,2.5
                      the Wealden Local Plan3 Submission Document January 2019 provided 950                                                         0
  dwellings a year, however ,this plan was withdrawn in January 2020. A new strategy is being                                                                2014/15           2015/16           2016/17            2017/18           2018/19
  developed and according to the standard methodology set out in the National Planning Framework,                                                  Source: ESCC Housing Monitoring Database, Lewes District Council housing monitoring system
  the minimum annual housing need figure that Wealden will have to consider is 1,231 homes.
State of the County 2020 Focus on East Sussex
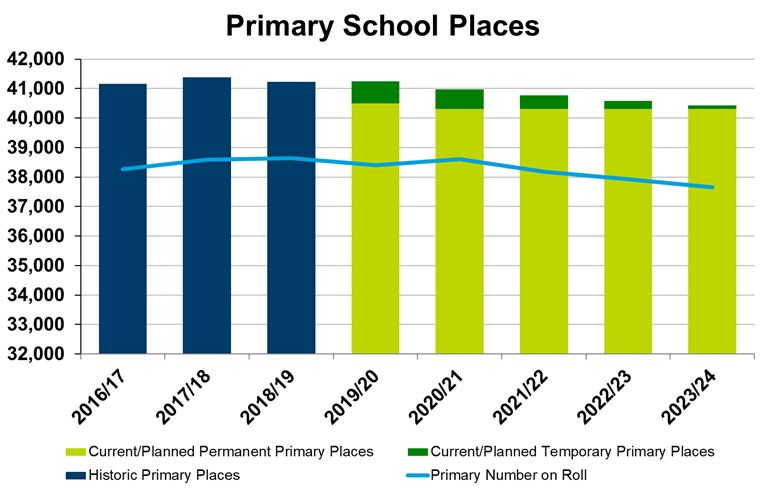
State of the County 2020: Housing                                                                                                                                                                                                                            7
                                                Housing affordability 2019
                                                                                                                                                                     Housing affordability - renting
       Median average - house prices : residence-based annual earnings
                   £                                                                                                                                               Average rent £ per week 2018/19
                                                                 East Sussex                                      £                 250
                                                                                                                                    225
                                             £280,000 9.5 x earnings £29,345                                                        200
                                                                      England                                                       175
                                                                                                                                    150
                         9.5x                £240,000 7.8 x earnings £30,661                                          7.8x          125
                                                                                                                                    100
                                                                                              Ratio: lower quartile                  75
              Ratio: median earnings to
              median house prices 2019                                                      earnings to lower quartile               50
                                                                                               house prices 2019                     25
        12                                                                         12
                                                                                                                                      0
        10                                                                         10                                                         Eastbourne                Hastings                   Lewes                   Rother                 Wealden
          8                                                                          8
                                                                                                                                                             Local Authority                     Registered Provider                             Private
          6                                                                          6

          4                                                                          4                                                    South East average not published, Hastings and Rother don’t have any LA housing stock
                                                                                                                                          Source: Gov.uk Private rental market summary statistics, Gov.uk Live tables on rents, lettings and tenancies
          2                                                                          2
          0                                                                          0

                                                                                                                                           Number of households in temporary accommodation
                    Ratio of median earnings to median house prices
10                                                                                                                           550                                                    516
                                                                                                                                                                                                                              2016/17 2017/18 2018/19
                                                                                                                             500
 8                                                                                                                           450                           395                                        Eastbourne                  60            114            201
                                                                                                                             400
                                                                                                                             350                                                                      Hastings                    74             92            145
 6                                                                                                                                  270
                                                                                                                             300                                                                      Lewes                       66             80            96
 4                                                                                                                           250
                                                                                                                             200                                                                      Rother                      33             69            56
 2                                                                                                                           150
                                                                                                                             100                                                                      Wealden                     37             40            18
 0                                                                                                                            50
       2009        2010        2011        2012        2013        2014       2015           2016   2017   2018   2019         0                                                                                  Source: Gov.uk live tables on homelessness

                                                                                                                                   2016/17              2017/18                 2018/19
                                 England                   South East                       East Sussex
Sources: ONS ratio of house price to residence-based earnings (lower quartile and median)
State of the County 2020 Focus on East Sussex
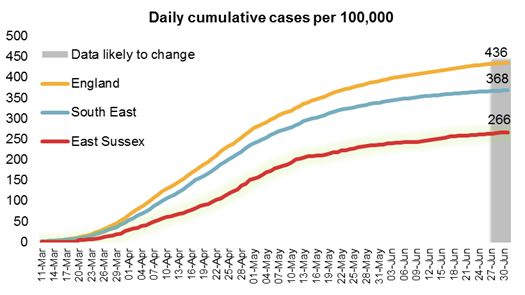
State of the County 2020: Housing                                                                                                                                                                                                       8
                                                                                                        The Benefit Cap
                                                                                                                                                     Households subject to the benefit cap,
            Households subject to the benefit cap, housing benefit                                                                           housing benefit and universal credit total February 2020
                         and universal credit total                                                                      180
                                                                                                                                      5
700                                                                                                                      160
           Lower cap from Nov 2016                                                                          647                                      39
                                                                                                 605                     140         38
600                                                                   557
                                                            541                                                          120
                     Eastbourne
500                                                                                                                      100                                                               29    Single, no child dependant
                     Hastings                                                        434                                                                             30
                     Lewes                                                                                                80                                                          5
400                                                                                                                                                                                              Couple, with child dependant(s)
                     Rother                                                                                               60        123             128
300                  Wealden                                                                                              40                                         80                    89    Single, with child dependant(s)
                                                                                                                                                                                      69
200                                                                                                                       20
             163             149                                                                                                                                                                Note: Numbers differ from the table due
                                             122                                                                           0                                                                    to small numbers being suppressed

100

   0
           Feb-14         Feb-15          Feb-16 Dec-16 Feb-17                      Feb-18    Feb-19    Feb-20

                                                                                                                                           The Benefit Cap, Housing Benefit and Universal Credit
                                                                                                                               • A limit on the total amount of benefit most people aged 16 -64 can get, it is applied
       Households subject to the benefit cap, housing benefit and                                                                through Housing Benefit or Universal Credit. Intended as an incentive to work,
                     universal credit by district                                                                                increase fairness, and make savings

                          Feb 14         Feb 15        Feb 16     Dec 16    Feb 17        Feb 18   Feb 19    Feb 20            • When introduced the cap was £26,000 p.a. for couples and parents with children,
                                                                                                                                 £18,200 for single people without dependant children. Reduced to £20,000 and
Eastbourne                        43             28         17       104            100      114       125        164            £13,400 in November 2016 and remain at that for 2020
Hastings                          56             51         52       166            177      167       162        171          • 77% (489) of capped households in East Sussex are single-parent families; England
                                                                                                                                 71%
Lewes                             31             37         22       102            108    Sup         125        110*
Rother                            15             12           9       70            70        72       88          87                                              Intentionally homeless families
Wealden                           18             21         22        99            102       81       105        115          • Where a family is considered to be intentionally homeless by a local housing authority
                                                                                                                                 (district or borough council) Children’s Social Care must ensure that a child is not
East Sussex                     163           149           122      541            557      434       605        647            destitute. This may require provision of temporary housing
Sources: Department for Works and Pensions, Small numbers may be suppressed (Sup)                                              • These families cannot claim Housing Benefit or Universal Credit to help with their
*Universal credit only, housing benefit figure suppressed                                                                        housing costs, so the full cost is met by the County Council. East Sussex Children’s
                                                                                                                                 Services spent £430,000 on 42 such families in 2019/20
                                                                                                                                 Sources: East Sussex County Council Children’s Services
State of the County 2020 Focus on East Sussex
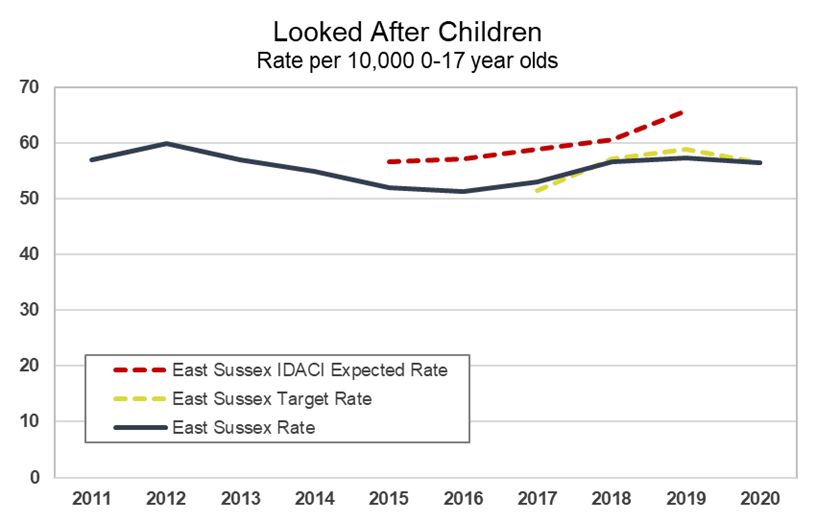
State of the County 2020: Deprivation                                                                                                                                                                                    9
                                      Index of Multiple Deprivation (IMD) 2019                                                                                     0% 10% 20% 30% 40% 50% 60% 70% 80% 90% 100%

IMD is the official measure of relative deprivation for people living in small                                                                          England
areas in England called Lower-layer Super Output Areas (LSOA).
There are 32,844 LSOA averaging 1,500 residents each ranked from 1                                                                                   East Sussex
(most deprived) to 32,844 (least deprived). IMD are weighted toward
income/employment deprivation.                                                                                                                                       Most                                              Least
                                                                                                                                                                   deprived                                           deprived
LSOA deprivation is shown by decile i.e. dividing the 32,844 areas into 10
equal groups from most deprived 10% to least deprived 10%. As it is a
relative measure there will always be this even range across England.
In East Sussex there are 329 LSOAs, of which 22 are in the most
deprived 10% nationally, 16 of these are in Hastings, 4
Eastbourne, and 2 Rother. 21 LSOA are in the least deprived
10% nationally, of these 13 are in Wealden, 6 Lewes, and 2
Eastbourne. Overall East Sussex has become relatively more
deprived compared to IMD 2015.
People that are more deprived may produce higher demand
for County Council and other public services, particularly
where they are in clusters of deprived LSOA. They are
characterised by poorer health and disability, lower skills,
educational disadvantage, higher crime and drug misuse.
Further information is available at eastsussexinfigures.org.uk.
                                                                                                                                                           Source: Ministry of Housing, Communities & Local Government
                                        IMD and housing tenure                                                                                             (MHCLG) IMD 2019
                                                                                                                                                           Office for National Statistics (ONS) Census 2011 housing tenure
                                                                               100
                                                                                                                                                           Map (c) Crown copyright—All rights reserved. 100019601, 2019

                         30,000                                                90

                                                                               80
                         25,000
                                                                               70                                                           Deprivation and Housing
                                                                                    IMD 2019 national decile
IMD 2019 national rank

                         20,000                                                60                              Areas of high deprivation correlate with rented housing that is meeting a need for low cost
                                                                                                               housing. This includes concentrations of social rented tenures (up to 70%) and private
                                                                               50                              rented tenures (up to 68%), and both (up to 81%). Measures of deprivation include the
                         15,000                                                                                indoor living environment and in these areas more properties (excluding social housing)
                                                                               40                              may be in poor condition or without central heating, leading to higher heating costs and
                                                                                                               other negative outcomes.
                         10,000                                                30
                                                                                                               The relationship with housing tenure type means that the areas of high deprivation may
                                                                               20                              not change IMD decile quickly unless there are significant housing developments or a
                          5,000                                                                                process of gentrification. Where household income increases people are likely to move to
                                                                               10                              other areas and be replaced by people with greater need for low cost housing. In the least
                                                                                                               deprived LSOA home ownership is highest, up to 95.2%. However, deprived people may
                             0                                                 0                               be found in all areas, and not all people in a deprived area will be deprived, as suggested
                                  0        20         40        60        80
                                                                                                               by the more even mix of tenure types across middle level deprivation areas.
                                        % rented (social and private ) 2011
State of the County 2020 Focus on East Sussex
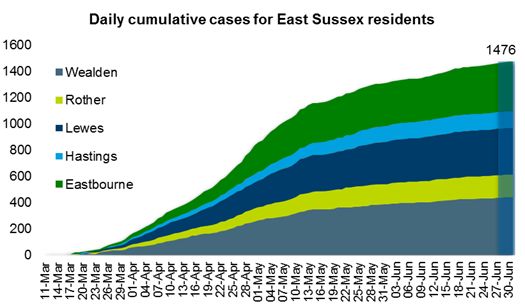
State of the County 2020: Health                                                                                                                                                                                                                                                                     10
 Estimated number of people with                                                           Adults overweight or obese                                                                                         Hospital activity 2019/20 provisional data
two or more long term conditions in                                                                 2018/19
    East Sussex (all ages)
                                                                                               63%                                                               62%
                 Women                                32.4%                          61%                    63%                                     61%                    63%                               A&E
                 +5.2%                                95,900                                                                                                                                                                    38%
                                                                               60%                                     64%                                                         64%
                  4,700                                                                                                                           60%
                                                                                                                                                                                                     16%     12%                                                Outpatient first attendances
31.9%
                                                         2023
91,200                                                                                                                                                                                                             564,000                                      A&E/Minor Injury Unit
                                                                                                                                                                                                               Attendances                                      first attendances
                                                                                                                                                                                                                    or
 2019                                                                                                                                                                                                          admissions                                       Elective admissions

                     +6.4%                             26.9%
                                                                                                                                                                                                       33%                                                      Emergency admissions
                     4,500                             75,100
                                                                                   East Sussex                                                           England                                                   A & E
26.2%                 Men
70,600
                                                                             66%                     61%                       59%                   63%                         63%
 Current smokers age 18+, 2018                                                                                                                                                                                                   Source: Hospital Episode Statistics accessed via DAE. NHS Digital
                                                                       56%               62%   56%               62%     56%               62%     56%               62%   56%               62%
                                               Source: Public                55%   63%               55%   63%                 55%   63%                 55%   63%               55%   63%
                                               Health Outcomes
           East Sussex 14%                     Framework, Public
                                               Health England                                                                                                                                      Physical activity amongst adults in East Sussex, 2017/18
                                                                      Eastbourne Hastings                                    Lewes                   Rother                Wealden
            England         14%
                                                                      People with high blood pressure
           Eastbourne 14%
                                                                          (hypertension) 2016/17
            Hastings        17%
                                                                                                 140
                                                                                                 90                            140
            Lewes          11%                                                                                                                                                                23% do less                       77% do 30 minutes or more a week
                                                                                                                               90
                                                                                                                                                                                               than 30       Source: Public Health Outcomes Framework, Public Health England

            Rother         17%                                                                                                                                                                minutes a
                                                                                                13%                                              Undiagnosed                                     week
            Wealden
                                                                                                                             12% hypertension
                            12%
                                                                                                                                                                                                                     Estimated
                                                                                                                                                                                                                     prevalence
    Adult                                                                                                                                                                                                             of people
                                                                                                23%                                                                                                                 with a mental
 drinkers in                                                                                                                 21% Diagnosed                                                                                                                         1 in 6
East Sussex                                                                                                                                      hypertension                                                          health
                                                                                                                                                                                                                    condition at
who drink at                                                                                                                                                                                                        any one time
  high risk,                                                                                    East                    England
    2016             Source: Local Alcohol Consumption Survey undertaken by Ipsos-
                     MORI on behalf of Public Health England, 2016
                                                                                               Sussex
More information available from Picture East Sussex – The Annual Report of the Director of Public Health 2018/19 www.eastsussexjsna.org.uk/publichealthreports
State of the County 2020: Health - COVID-19 Impacts                                                                                                                                                                                                     11
  East Sussex                       January                                    February                                        March                                      April                                             May
  UK context                                              uu       u                                            u     u uu u u          u    u     u                                              u                       u                         u
  International context

      30/01/20           31/01/20         06/02/20      05/03/20    11/03/20        11/03/20     12/03/20      16/03/20         17/03/20            20/03/20        23/03/20        As at 31/03/20  As at 30/04/20           13/05/20     As at 31/05/20
   WHO declare      First 2 confirmed First confirmed   First UK     WHO        First confirmed UK move to Public advised    First death at         Last day     UK wide partial    145 confirmed   594 confirmed             Step 1      729 confirmed
   Public Health    COVID-19 cases COVID-19 case in      death      declare     COVID-19 cases    'delay'    against non-     East Sussex           schools        lockdown        COVID-19 cases, COVID-19 cases,          recovery     COVID-19 cases,
   Emergency of     diagnosed in UK    Brighton and                pandemic      diagnosed in     phase    essential travel Healthcare Trust         open         announced           12 deaths      175 deaths            plan starts     326 deaths
   International                            Hove                                East Sussex (3             and contact with
     Concern                                                                         cases)                     others

                                                                                                                                                                National findings on risk factors
                                                                                                                                                               associated with poorer outcomes
                                                             The COVID-19 vulnerability index combines multiple
                                                             sources of data to identify vulnerable areas and groups
                                                             within Local Authorities and neighbourhoods. The Index
                                                             currently maps clinical, demographic and social
                                                             vulnerabilities as well as health inequalities.

                                                                                                                                              Studies looking at outcomes of patients with COVID-19 and analysis of
                                                                                                                                              death certificates suggests that there is an increased risk of an
       Numbers of people identified by the NHS as needing to shield                                                                           adverse outcome for patients with the following:
       and the percentage registered for help (as at 25th June)

                                                                                                                                                                         Source: Disparities in the risk and outcomes of COIVD-19, Public Health England, June 2020
                                                                                     Source: Ministry of Housing, Communities & Local Government
State of the County 2020: Health - COVID-19 Impacts                                                                                                                                12
     NOTE: the latest data is available from Public Health England
                                                                                                                                                   Confirmed COVID-19 cases per
                                                                                                                                                   100,000 population (crude rates)
                                                                                                                                                     across South East England

                                                                                                Source: Public Health England. Data as at 03/07/2020
Source: Public Health England. Data in shaded area may increase with subsequent data releases

                                                                                                         Source: ONS. Data as published 30/06/20
      Source: Public Health England
State of the County 2020: Environment                                                                                                                                                        13
    CO2e Emissions by sector 2005 - 2017 in East Sussex                                                       Overall status of surface water bodies in East Sussex

                                                                                                                                                                Source: Environment Agency

                                                                                                         Overall ecological status of Groundwater bodies in East Sussex
      Source: Source: Department for Business, Energy & Industrial Strategy 2019

Cumulative CO2e Emissions budget for East Sussex from 2018 - 2100
                                          • CO2 emissions in East Sussex fell by 27% between 2005 and
                                            2016, while the population grew by about 8%. This excludes
                                            emissions that occur outside the area due to demand for goods
                                            and services that are consumed in the county
                                          • This reduction is similar to the national reduction, and driven by
                                            the same changes, e.g. the switch from coal to gas and
                                            renewables to generate electricity
                                          • For East Sussex to contribute to keeping the increase in global
                                            average temperature below 1.5°C above pre-industrial levels
                                            requires cutting emissions across East Sussex by an average
                                                                                                                   Source: Environment Agency
                                            of about 13% per year, which roughly equates to cutting total
                                            emissions in half every 5 years                                      • Water pollution is mostly caused by land management practices (e.g.
                                                                                                                   agricultural run-off), wastewater treatment plants, and urban and
                                                                                                                   highway run-off
                                                                                                                 • The quality of waterbodies has deteriorated in recent years. The
                                                                                                                   quality of some ground waters, which provide about 70% of drinking
                                                                                                                   water, have deteriorated due to rising nitrate levels, mostly due to
                                                                                                                   historic farming practices

   Source: Source: Tyndall Centre for Climate Change, 2020
State of the County 2020: Economy                                                                                                                                                                                14
                                                       GVA per hour                                                                                                           Employment
• Gross Value Added (GVA) per hour measures the value of goods or services                                                 • 73.6% of working age population (age 16-64) in employment 2018/19 (down from 74.6% in
  produced in an area per hour worked in that area. Note that revised GVA data                                               2017/18), England 75.6%, South East 78.4%
  was released in December 2019 which substantially changes the GVA attributed
  to East Sussex                                                                                                           • County employment remains below the pre-recession level of 75.5% in 2007/08
                                                                                                                           • Employment in Lewes fell by 14.6% in 2018/19
                                                       GVA per hour
                                                                                                                           • Employment levels in Hastings recovered in 2009/10, since then they had been fluctuating
    £40                                                                                                           40%
                                                                                                                             downwards, however in 2018/19 they increased to 72.0%
    £35                                                                                                           35%      • Employment in Eastbourne fluctuated after the recession; currently below the 2007/08 rate
                                                                                                                           Sources: ONS Annual Population Survey

    £30                                                                                                           30%
                                                                                                                                                   Percentage of working age population in employment
    £25                                                                                                           25%
                                                                                                                                  85%
    £20                                                                                                           20%
                                                                                                                                  80%
    £15                                                                                                           15%
                                                                                                                                  75%
    £10                                                                                                           10%             70%

     £5                                                                                                           5%              65%

     £0                                                                                                           0%              60%
           2007 2008 2009 2010 2011 2012 2013 2014 2015 2016 2017 2018
                    England £                 East Sussex £                    East Sussex to England % gap
                                                                                                                                  55%

    Source: ONS Subregional productivity: labour productivity indices by UK NUTS2 and NUTS3 subregions                            50%
    Unemployment rate: percentage of adult and youth population
8
7                                                                                                                                            2014/15               2015/16   2016/17   2017/18   2018/19   2007/08

6
                                                                                                         Hastings Youth                                                      Unemployment
5
                                                                                                         Hastings All      • The Alternative Claimant Count records the number of people claiming any unemployment
4                                                                                                                            related benefit e.g. Universal Credit (seeking work), Job Seekers Allowance etc. At
                                                                                                         East Sussex
3                                                                                                        Youth               February 2020, East Sussex 3%, England 3.2%

2                                                                                                        East Sussex All   • Youth (18-24) unemployment is higher, 4.4%, and impacted more by economic shocks
                                                                                                                             (e.g. rapid change in GVA) than the general adult rate; this is an international trend
1                                                                                                        England Youth       explained by issues around finding a first job and labour market policies e.g. differential
0                                                                                                                            employment protection, minimum wages, targeted support (e.g. apprenticeships and
                                                                                                         England All         vocational training for disadvantaged youth). In East Sussex it is most keenly seen in
            2017                   2018                   2019                    2020
                                                                                                                             Hastings, 7.3%
Sources: DWP alternative claimant count experimental statistics, ONS population statistics
State of the County 2020: Economy                                                                                                                                                                                          15
 Earnings
                                           Average (median) full time earnings                                                                                                     Average full-time earnings
          £
                           Workplace-based                                                         Residence-based                                     £30,000
                                                               % Change                                              % Change                          £25,000

                                                                                                                                     Annual earnings
                            2010               2019                                     2010              2019
                                                                2010/19                                               2010/19
                                                                                                                                                       £20,000
 Eastbourne                 £25,120            £30,001                  19.4%           £25,598           £29,287        14.4%
                                                                                                                                                       £15,000
 Hastings                   £21,700            £24,050                  10.8%           £21,711           £24,655        13.6%
                                                                                                                                                       £10,000
 Lewes                      £23,931            £28,516                  19.2%           £27,898           £32,786        17.5%
                                                                                                                                                              £5,000
 Rother                     £21,371            £23,516                  10.0%           £29,024           £28,718        10.4%
                                                                                                                                                                  £0
 Wealden                    £23,341            £27,046                  15.9%           £30,792           £31,786         3.2%
                                                                                                                                                                        2010 2011 2012 2013 2014 2015 2016 2017 2018 2019

          £                               Average (median) part time earnings
                           Workplace-based                                                         Residence-based                                                                 Average part-time earnings
                                                                % Change                                             % Change                                 £10,000
                             2010              2019                                     2010              2019
                                                                 2010/19                                              2010/19
                                                                                                                                                               £8,000

                                                                                                                                            Annual earnings
 Eastbourne                   £8,735           £10,386                  18.9%             £7,867          £10,870        38.2%
 Hastings                     £8,010             £9,519                 18.8%             £7,404           £9,773        32.0%                                 £6,000
 Lewes                        £9,281             £9,738                   4.9%            £9,570           £9,753         1.9%                                 £4,000
 Rother                       £6,372           £10,817                  69.8%             £7,678           £8,655        12.7%
                                                                                                                                                               £2,000
 Wealden                      £7,513             £9,229                 22.8%             £8,212           £9,385        14.3%
                                                                                                                                                                  £0
Data for annual earnings are not available for some areas. For these areas annualised weekly earnings are used and
are recorded in bold grey italics. Annualised weekly earnings are not produced on an identical basis to annual
                                                                                                                                                                        2010 2011 2012 2013 2014 2015 2016 2017 2018 2019
earnings and are therefore not directly comparable.
                                                                                                                                                                        East Sussex - residence      East Sussex - workplace
Sources: Annual Survey of Hours and Earnings (ASHE), ONS Business Register and Employment Survey (BRES)                                                                 South East                   England
                                                                                                                                                            £11,000
 Percentage of people who work full time and part time
                                                                                                                                                            £10,000
       England                                                                                                                                                                                             Full time
                                                                                                                                          Annual earnings

  South East                                                                                                                                                  £9,000                                       Part time
East Sussex

                      0                  10                  20                  30                 40              50          60                            £8,000
                                                                                                                                                                 70           80           90     100
State of the County 2020: Economy                                                                                                                                                                                  16
                                                                                                                                                                  2018: 2,230 business starts,
                                       Employment by industry
                                                                                                                                                                    2,235 business closures,
                                                                                                        Active Businesses:
   England        9%       25%             9%     15%        5% 7% 5%          16%           8%                                                                   a reduction of 7.3% from 2017
                                                                                                        2017: 24,170
                                                                                                                                                         New business registration rate per 10,000 people:
 South East       8%       26%             9%         16%        5% 7% 6%         18%        6%         2018: 23,985
                                                                                                                                                  East Sussex rate fell by 8.0% between 2017 and 2018 to 48.5
                                                                                                           Source: ESCC Business
East Sussex       6%        31%             5%        17%        5% 10% 7%         14%        6%           demography, districts, ESCC
                                                                                                           New business registration
                                                                                                                                                                Highest in Wealden 52.0
                                                                                                           rate, districts

Eastbourne        5%         38%                 6%         20%      3% 10% 5% 10% 4%                                                                                  Lowest in Hastings 44.3

                                                                                                                    New business rate per                                  Active business rate per
   Hastings       4%         39%                 5%     15%        5% 9% 5% 9%               9%                                                                               10,000 population
                                                                                                                      10,000 population                             500
     Lewes        6%            32%             5%     16%        3% 7% 6%        18%         6%                                                                    480
                                                                                                        80
                                                                                                                                                                    460
     Rother    5%         27%         5%        13%         8%     13%    7%       17%        5%                                                                    440
                                                                                                        60                                                          420
   Wealden        8%      23%         6%        17%     3% 9%        9%        19%           7%                                                                     400
                                                                                                        40                                                          380
              0            20              40                60              80                 100            2012 2013 2014 2015 2016 2017 2018                          2012 2013 2014 2015 2016 2017 2018
   Professional, scientific and technical         Public admin, education and health         Source: ONS Business Demography data.                                                             Source: ONS Business
                                                                                             Nomis mid-year estimate population data East Sussex   South East  England                         Demography tables
   Admin and   support services
           Professional,            Public admin, Retail and motor vehicles
                                                                 Admin and
           scientific and           education and
   Finance, insurance                                         support services
             technical and real estate health Accommodation and food                                                                            East Sussex Business                           births - deaths
   Construction                                   Other                        Other includes: Arts, entertainment and
         Retail, wholesale,
                                       Finance,
                                                              Accommodation recreation; Other service activities;                                600    555 555 460
   Manufacturing
              motors
                                    insurance and
                                                                  and food
                                      real estate                              Agriculture, fishing, mining and utilities;                       400
                                                                               Transportation and storage; Information and
           Construction                 Other                  Manufacturing communication.                                                      200
                                                                                        Source: Business Register and Employment Survey (BRES) 2018                                               5
                                                                                                                                                                       0
  eSussex Broadband                                                                                                                                                                                         -5        Source: ONS
                                                                                                                                                                   -200                                                  Business
                                                                                                                                                                                                                      Demography
  • The eSussex project, led by the Council, is delivering internet connectivity for homes and businesses in the county by                                                                                                  tables

    investing in fibre infrastructure
                                                                                                                                                                             2013 2014 2015 2016 2017 2018
  • Three contracts, worth over £32m in total, have been connecting premises which are not considered commercially                                             Eastbourne      75   95 115    60    0    5
    viable by private providers
                                                                                                                                                               Hastings        70   95 130    60   10   10
  • The third contract began delivering at pace in March 2020 and will deliver full fibre (fibre to the premises) to over 5,500                                Lewes          160 155    70 110    25    5
    premises by December 2021
                                                                                                                                                               Rother         135   55   10   70    0    5
  • Superfast coverage, in spring 2020 is 97%                                                                                   Source: ESCC Broadband team    Wealden         105   155    230       160        -30      -30
State of the County 2020: Economy                                                                                                                                                                                                       17
                                           Meeting business needs                                                                                    Qualifications of working age population 2019
 • Innovative firms employ a higher share of Science, Technology, Engineering, Art and                                           • Qualification levels are broadly in line with England and South East averages
   Maths (STEAM) graduates                                                                                                       • Lewes and Wealden have a significantly higher proportion of better qualified
                                                                                                                                   people compared with other districts in the county
• There are six Skills East Sussex (SES)
  business-led sector task groups for:
        engineering;
                                                                   1,000
                                                    Students visited 34 businesses between
                                                                                                                                                          Qualifications of working age population 2019
                                                                                                                                                                  None          Level 1           Level 2           Level 3 Level 4+        Other
                                                    October and December 2019 as part of
        land-based;                                                                                                             England                             7.5%            10.1%             17.2%                18.5%   40.0%        6.7%
                                                    the ‘Open Doors’ project to learn about the
        construction;                              range of jobs available in industries                                        South East                          5.8%              9.7%            17.0%                18.7%   43.4%        5.4%
        creative and digital industries;           including web design, event management,
                                                    engineering, construction and hospitality                                    East Sussex                         6.2%            13.0%             20.4%                17.7%   35.6%        7.1%
        visitor economy; and                       among others.
        health and social care                     Source: ESCC Economic Development                                            Eastbourne                          5.4%            16.7%             24.4%                12.2%   32.7%        8.7%
                                                                                                                                 Hastings                          12.2%             10.7%             20.6%                9.3%    38.4%        8.8%
                                                                                                                                 Lewes                               8.5%              7.1%            20.1%                21.5%   39.7%        3.1%
 •     21 Industry Champions were recruited in 2019/20 to act as ambassadors for their
       sectors and promote careers to young people                                                                               Rother                              3.0%            14.9%             23.4%                26.1%   24.8%        7.8%
     Source: ESCC Economic Development
                                                                                                                                 Wealden                             3.4%            14.5%             16.2%                19.6%   39.3%        7.0%
                                                                                                                               Note: Survey data, confidence intervals apply e.g. up to +/- 3.8% for East Sussex, with potentially much
                                                                                                                               larger confidence intervals for District and Borough areas. Therefore care should be taken when reading
                              East Sussex apprenticeship starts                                                                these results.
2,500                                                                                                                          None: No academic or professional qualifications
                                                                                                                               Source: ONS Nomis Annual Population Survey: Qualifications of working age population, 2019

2,000
                                                                                                                                                                             Apprenticeship rates

1,500                                                                                                          2018/19
                                                                                                                                                                                             Apprenticeship Levy East Sussex County
                                                                                                                                                                                             Council

                                                                                                                                                                                                                                    4       th
                                                                                  Intermediate level             1,130                                      Apprenticeship
1,000

                                                                                  Advanced level                 1,380
                                                                                                                                      6%                    starts in East
                                                                                                                                                            Sussex in 2018/19
                                                                                                                                                                                             December 2019:

                                                                                                                                                                                             1.8% of staff
 500                                                                                                                                                                                         apprentices, against the
                                                                                  Higher level                     460                                                                       2.3% target
       0
                                                                                                                                     44%                    Higher level
                                                                                                                                                            apprenticeship
                                                                                                                                                            starts in 2018/19
                                                                                                                                                                                             Placing us joint fourth
                                                                                                                                                                                             highest nationally                     highest
                                                                                                                                                                                             amongst county councils                nationally

                                                                         Source: Department for Education (DfE) further education data library, apprenticeships
State of the County 2020: Economy                                                                                                                                                                                           18
  The maps on the following two pages highlight programmes and schemes which will contribute towards the
  East Sussex Growth Strategy from 2014 until 2020.
                                                                                                                                               Countywide funding and Investments, including leveraged funds
  Skills and Business: This map focuses on projects which will help boost skills and support businesses.
                                                                                                                                                East Sussex Invest                  £15m Locate East Sussex                  £1.26m
Key to mapped funding                                                                                                                           Growing Places Fund               £20.4m Local Growth Fund                    £216m
                                                                                                                                                Low Carbon Across the                     Business East Sussex and
Local Growth Fund                                                                                                                                                                   £3.6m                                     £1.8m
                                                                                                                                                South East                                South East Business Boost
Skills Revenue and Capital                                                                                                                      Housing Infrastructure Fund       £16.7m Coastal Communities Fund             £6.3m
Funds
                                     Forest Row                                                                                                 Bexhill Hastings Link Road
Other funds                                                                                                                                                                          £1bn E-Sussex Broadband                 £28.5m
                                                                                                                                                (Combe Valley Way)

                                                                                     Wadhurst                                                                                               Skills Revenue and Capital
                                                                                                                                                Active Access for Growth          £1.82m                                      £10m+
                                                                                                                                                                                            Funds
                                                                Crowborough
                                                  Pine Grove Enterprise Centre £0.5m

                                                                                                                              Roberstbridge

                                                                                   Heathfield
                                                  Uckfield                                                                                                                                 Rye

                                                              Countywide
                                                              Investment in careers advice and
        Plumpton                                              guidance in schools £0.8m                                          Battle
        Plumpton College - science and                        East Sussex strategic growth
        engineering apprenticeships and                       package - development of new
        training £0.5m                                        commercial and office sites
        Plumpton college - Centre of                          countywide £22m
        Excellence for Agrifood £2.9m
                         Lewes                                                                                                                      Hastings
                                                                                    Hailsham
                                                                                                                                                    Hastings Fisheries Local Action Group (FLAG) £1.7m

                           Charleston                                                                                                               University Centre Hastings £0.3m
                                                                                                                                                    Connecting Hastings and Rother Together (CHART) £8.1m
                           Charleston House £0.5m
                                                                                                               Bexhill                              Sidney Little Road Business Incubator Hub £0.5m
                                                                                                               Bexhill creative workspace           Queensway Gateway Road - new employment space £12m
                                                                                                               £0.96m
                                 Newhaven
                                                                                   Eastbourne
                                                                                                                                          Funding sources: Local Growth Fund (LGF), Growing Places Fund (GPF), Highways England,
              Newhaven                              Seaford                        Eastbourne Fishermen’s Quay £1.2m                      Department for Transport, Department for Work and Pensions Work and Health Programme,
                                                                                                                                          Ministry of Housing, Communities and Local Government, East Sussex County Council, District
              Newhaven Enterprise Zone                                             East Sussex College - support to the                   and Borough Councils, Network Rail, Skills Capital, European Regional Development Fund
                                                                                   new further education provider                         (ERDF), European Social Fund (ESF), European Maritime Fisheries Fund, European Rural
              Newhaven Eastside South -                                                                                                   Development Programme for England, Big Lottery, The Careers and Enterprise Company and
              new commercial units £7.8m                                                                                                  the Higher Education Funding Council for England.
State of the County 2020: Economy                                                                                                                                                                                19
Infrastructure: This map focuses on projects which will improve the infrastructure in East Sussex.

                                                                                                                                                                                       Key to mapped funding
                                                                                                                                                                                       Local Growth Fund
                                                                                                                                                                                       Housing Infrastructure Fund
                                                               Countywide
                                                                                                                                                                                       Other funds
                                             Infrastructure at business sites £1.7m
                             Forest Row
                                             Walking and cycling improvements £20.7m

                                                                               Wadhurst

                                                         Crowborough

                                                                                                                         Roberstbridge

                                                                             Heathfield
                                          Uckfield                                                                                                                               Rye
                                              Uckfield                                                                                                          Rye Harbour Nature Reserve
                                                                                                                                                                Discovery Centre £0.9m
                                              Bus station improvements £0.5m
                                              Potential Movement and Access                                                Battle
                                              Corridor improvements £0.8m
                                                                                                                   Blackfriars - road
                                                                                                                   infrastructure £3.2m
            Lewes North    £180m
                                                                 Potential A22 junction                                                             Hastings
            Street Quarter £10m
                                                                 improvement package                                                                Potential HS1 rail extension (also to Bexhill
                  Lewes                                                                                                                             and Eastbourne)
                                                                               Hailsham
                                                                                                         Bexhill                                    Bexhill and Hastings Movement and Access
                     Lewes - Newhaven                                                                                                               Package £9m
                                                                                                         North Bexhill Access Road £18.6m
                   Rail signalling                                                                                                                  Combe Valley Sports Village -
                   improvements £18m                 A27 improvements £75m                               Bexhill Enterprise Park North £1.9m        complementing housing development £2.2m
                                                     Potential A27 offline solution                      High Weald House £7m
                                                                                                                                                                       Funding sources: Local Growth Fund (LGF), Growing
                                                                                                                                                                       Places Fund (GPF), Highways England, Department
                          Newhaven                                              Eastbourne                                                                             for Transport, Department for Work and Pensions
                                                                                                                                                                       Work and Health Programme, Ministry of Housing,
                                                                                Eastbourne Town Centre Movement and Access Package (Terminus Road) £11.3m              Communities and Local Government, East Sussex
                                                                                                                                                                       County Council, District and Borough Councils,
              Newhaven                      Seaford                             Eastbourne and South Wealden walking and cycling package £6.6m                         Network Rail, Skills Capital, European Regional
   Newhaven Flood Defences £19.5m                                                                                                                                      Development Fund (ERDF), European Social Fund
                                                                                Hailsham, Polegate and Eastbourne Movement and Access Corridor £2.1m                   (ESF), European Maritime Fisheries Fund, European
   Newhaven Port Access Road £23m                                                                                                                                      Rural Development Programme for England, Big
                                                                                Devonshire Park - redevelopment to maximise conference and tourist markets £54m        Lottery, The Careers and Enterprise Company and the
                                                                                Bedfordwell Road - site preparation for housing development £1.2m                      Higher Education Funding Council for England.
State of the County 2020: Economy - COVID-19 Impacts                                                                                                                                                    20
                  Unemployment
• There was a sharp increase in people claiming
  Jobseekers allowance and Universal Credit (and
  searching for work) in May 2020 (Note this is
  slightly different to the Alternative Claimant Count
  which records the number of people claiming any
  unemployment related benefit)
• Across East Sussex the number of people claiming
  increased by 11,640 to 20,775 between March and
  May 2020, the figures for the district are:

  Unemployment 2020         March            May         Increase
  Eastbourne                   2,245         4,735            2,490
  Hastings                     2,780         5,185            2,405
  Lewes                        1,410         3,515            2,105
  Rother                       1,380         3,100            1,720
  Wealden                      1,315         4,245            2,930                                                                  Number of employments
                                                                                                                                      furloughed May 2020
                                                                                                                         20,000                                           17,700
Business and employment
                                                                                                                                                                                       In East Sussex for the
• 68% of businesses in East Sussex are furloughing staff, and 30% have                                                   15,000                                                        period up to 31/05/2020
                                                                                                                                    11,500                                             there were estimated:
  accessed loans, grants and or business rates relief                                                                                                   10,600
                                                                                                                                               9,700              9,300
                                                                                                                         10,000                                                        • 58,900 employments
• The COVID-19 pandemic has had a significant impact on almost all sectors of                                                                                                            furloughed
  the East Sussex economy, with the visitor, retail and the creative and digital                                                                                                      • 26,200 claims to the
                                                                                                                          5,000
  sectors particularly hit                                                                                                                                                              Self-employment
                                                                                                                                                                                        income support
• Businesses in the construction sector have continued to operate at non-                                                    0
  domestic sites where possible, implementing social distancing and using PPE                                           Number of employments furloughed June                      2020 scheme    (SEISS) with
                                                                                                                                                                                        a total value of
                                                                                                                            Self-employement income support                             £79.1m
• The engineering sector has continued to operate, but has experienced supply                                             20,000 scheme claims May 2020 17,700
  chain challenges and have an older average employee age than other sectors                                             10,000
  which has led to labour challenges due to some staff self-isolating or shielding                                         15,000                                         8,100             Eastbourne
                                                                                                                          8,000       11,500
• In the land based sector, many East Sussex farms have participated in a                                                                                10,600
                                                                                                                                                9,700             9,300                     Hastings
  national campaign to recruit local seasonal workers, to replace those who                                                10,000
                                                                                                                          6,000                         5,000                               Lewes
                                                                                                                                               4,700              4,400
  normally arrive from the EU                                                                                                        4,100
                                                                                                                            5,000
                                                                                                                          4,000                                                             Rother
• Health and social care is one of the few sectors which needs new and                                                                                                                      Wealden
  additional staff                                                                                                        2,000 0
                        Source: ESCC Claimant Count including JSA and Universal Credit by age, 2018-2020 - districts,
                        and ESCC Economic Development Team, HM Revenue and Customs
                                                                                                                              0
State of the County 2020: Civil Society                                                                                                                                    21

                                 Voluntary, Community and Social Enterprise sector work and responding to COVID-19
The Voluntary, Community and Social Enterprise (VCSE) sector provides a wide range of services in East Sussex.   46% of people volunteered for a group or organisation in
2019, with over a quarter (27%) doing so at least once a month.

VCSE organisations have responded rapidly to the outbreak of Covid-19 in East Sussex. Many have adapted their services from face to face to online support, and developed
teams of trained volunteers who can continue to assist people during the pandemic. Just a few examples are given here.

                                                                                                          Community Hubs - CH
                                                                                Since March 2020 Community Hubs have been established in each of the
                                                                                district and boroughs in East Sussex. Community Hubs work with emergency
                                                                                services, the NHS, local businesses and the Council to adapt and develop
                                                                                support systems to help local communities
                                       Wealden
                                        CH: 1                                                                                          Mutual Aid Groups - MAG
                                       MAG: 18
                                        FB: 3                                                                                   The VCSE sector has been working with the
                                                                                                                                public sector to support the creation of Mutual
                                   Mayfacs: helping people                                                                                    Aid Groups, which enable people
                                   who are self-isolating with
                                                                               Rother
                                                                                                                                                who want to help others to
                                   their shopping, prescription                 CH: 1                        Rye Mutual Aid
                                                                               MAG: 5                        Group: working                         become volunteers, and
        Lewes                      collection, delivering local                                                                                     assist people in the
                                   ready meals or making
                                                                                FB: 3                        across 20 areas/
        CH: 1                                                                                                parishes in and                        community who require
       MAG: 14                     phone calls to people who                                                                                        food, social contact or
                                   are lonely                                                                around Rye
        FB: 11                                                                                                                                     support at home
       Lewes coronavirus
       volunteers: civic                                                                                                                        Foodbanks - FB
       response group which                                                                                                      Foodbanks have continued to offer a lifeline to
       links those who would                                                                    Hastings                         families experiencing financial hardship during
       like help and support                                                                      CH: 1                          the pandemic
       with those who are able                                                                   MAG: 8
       to help                                                                                   FB: 1
                                                                                                           HEART Hastings: Hastings Emergency
                                                                                                           Action Response team is a group of
                                                                                                           volunteers who assist people who may
                                                       Eastbourne                                          require support but can’t get out because
                                                                        Eastbourne Foodbank:
                                                            CH: 1                                          of COVID-19. They can help with
                                                           MAG: 5       offering food help which is
                                                                                                           shopping, deliveries, medication etc
                                                            FB: 1       delivered to the door
State of the County 2020: Schools                                                                                                                                                               22
                       Early Years
                       Early Years (age
                                   (age 00-5)
                                          - 5)                                     Key
                                                                                    KeyStage
                                                                                        stage 22 Expected Standard
                                                                                                 Expected Standard                                                Key Stage 2 Expected Standard
           Children with a good level of development                                                                                                                  disadvantaged pupils
                 Good Level     of Development
                           in learning
                                                                                                  (age 7-11)
 90%                                                 • Early Years Good                                                               • At Key Stage 2     60%
                                                                                 70%    64%66%65%
                  76.5%                                  Level of Development                                    63%66%65%              the percentage              49% 47% 51%                      51%
 80%
                           71.5%
                                       76.0%
                                                                                 60%                                                                       50%                         46% 48%
                                                 71.8%   is achieving the                                                               of pupils
 70%
                                                         expected standard       50%                                                    reaching the       40%
 60%                                                     for: communication                                                             expected
 50%                                                                             40%                                                                       30%
                                                         and language;                                                                  standard in
 40%                                                     physical development;   30%                                                    reading, writing   20%
 30%                                                     personal, social and    20%                                                    and maths          10%
 20%                                                     emotional                                                                      combined
                                                                                 10%                                                                       0%
 10%                                                     development; literacy
                                                                                 0%                                                                                    2017/18               2018/19
  0%                                                     and mathematics
                                                                                            2017/18                 2018/19
                        2018               2019                                                                                                                     GCSE 2018/19 (age 14 - 16)
                                                                                                                                                            Pupils acheiving a pass in English and maths
Key Stage 4 - Attainment 8 / Progress 8                                                                                                                    80%
• Attainment 8 is the students’ average achievement across eight subjects: English, mathematics, three English Baccalaureate          70%                          63.5% 67.5% 64.9%
  (EBacc) subjects (from sciences, computer science, geography, history and languages), and three further subjects, from the range of
                                                                                                                                      60%
  EBacc subjects, or any other GCSE or approved, high-value arts, academic, or vocational qualifications                                                                                     46.5%
                                                                                                                                                           50%
• Progress 8 is a measure of students’ progress across the Attainment 8 subjects from the end of primary school (Key Stage 2) to the                                                 41.7%           43.4%
  end of secondary school (Key Stage 4). Scores for East Sussex are below national                                                                         40%
                                                                                                                           Progress 8                      30%
                      Attainment 8 Score                          Attainment 8 score for                         Average score (age 14 - 16)
                  (Age 14 - 16)                                   disadvantaged pupils                    0.03                                             20%
              47.8 46.6          48.0 46.8               40                                               0.02
50       45.2                                                        36.8 34.4   33.5 36.8 34.4                       0.01                                 10%
                            45.3                              33.2                                        0.01
40                                                       30                                                                                                 0%
                                                                                                          0.00
                                                                                                                                                                      Grades 9-4         Grades 9-5
                                                                                                         -0.01
30
                                                         20                                              -0.02                             -0.01                    A Level (age 16 - 18)
20                                                                                                       -0.03                -0.02                         Average point score per entry best three
                                                         10                                                        -0.03                       -0.03        40
                                                                                                         -0.04                                                                            33.3332.89
10                                                                                                       -0.05                                                        32.7 32.5
                                                                                                                                                                                    30.00
                                                          0                                              -0.06                                              30    28.4
 0                                                                2017/18           2018/19              -0.07                          -0.06
               2017/18                2018/19
                                                                                                                      2017/18             2018/19           20

• Following the cancellation of all assessments, tests and exams in England (from Early Years through to Post 16), Ofqual has
                                                                                                                                                            10
  determined a process where students’ work (up until March 2020) is assessed to enable them to receive grades for GCSEs,
  AS and A levels in time to progress.
                                                                                           East Sussex           South East              England              0
Source for all: DfE
                                                                                                                                                                       2017/18             2018/19
State of the County 2020: Schools                                                                                                                                     23

 Source: ESCC Pupil Forecasting Model 16th July 2019

                              Primary school places                                                                        Secondary school places
• Total numbers of pupils in primary schools have now plateaued
  and are forecast to fall from around 2021/22
                                                                                     School               • Secondary pupil numbers are expected to continue to increase
                                                                                                            and peak around 2025/26
• There will be a net reduction in capacity of 819 places, between                                        • 500 additional permanent places will be added between 2019/20
  2019/20 and 2023/24, as previous temporary capacity will be                                               and 2025/26 to meet forecast demand in local areas
  removed when no longer required

                                                                         Projected change in youth population                                                   Source: ESCC
                                                                                                                                                                population projec-
                                                                                  % change                                                         % change     tions by age and
                                         2020          2021     2022     2023                 2024     2025       2026       2027        2028                   gender (dwelling
                                                                                  2020-2023                                                        2024-2028    led) April 2020,
                                                                                                                                                                numbers rounded
                      0-3               21,100         21,070   21,140   21,220     +0.6%     21,250   21,400    21,510      21,610     21,660       +1.9%      to 10

                      4-10              43,060         42,710   42,200   41,940     -2.6%     41,760   41,780    41,580      41,370     41,270       -1.2%
                     11-15              31,290         32,100   32,700   33,290     +6.4%     33,530   33,620    33,580      33,250     32,830       -2.1%
                     16-17              11,900         12,050   12,450   12,950     +8.8%     13,190   13,440    13,670      13,990     14,120       +7.1%
State of the County 2020: Children                                                                                                                                                                       24

                                                                Troubled Families results                                                          Child Protection (CP) Plans
                       • The national Troubled Families programme (TF2) runs from                                                  • At the end of March 2020, the number of CP plans was                 542, a
                         2015 to 2021
                       • Troubled Families promotes whole family working which is now                                              rate of 50.9 per 10,000 children
                          a core element of Children’s Services delivery                                                           • This is above the expected rate benchmarked for child
                       • Payment by Results outcomes are achieved when families reach                                                deprivation; the Income Deprivation Affecting Children Index
                         significant and sustained progress thresholds in six key areas                                (IDACI) but is linked to the relatively low numbers of children who are in care
      • Successful family outcomes impact positively on all priority outcomes and reduce                               placements. The focus continues to be ensuring the right children are made
        demand for other services                                                                                      subject to plans for the right amount of time
      • By the end of 2019/20, 4,306 families had received or were receiving support and                             • Improved practice on Child Sexual Exploitation (CSE), domestic violence and
        2,504 had achieved Payment by Results outcomes
                                                                                                                       neglect have resulted in more children being identified who need to have a
                                                                                                                       CP plan
                                                             Troubled Families (TF) programme 2
                                        5000

                                        4500
         Number of families supported

                                        4000

                                        3500

                                        3000

                                        2500

                                        2000

                                        1500

d Families                              1000

                                         500

                                           0
                                                   2015         2016    2017      2018          2019   2020   2021
                                               TF 1 Target
                                               TF 1 Performance
                                               TF 2 Target
                                               TF 2 Engagement Performance
                                               TF 2 Payments by Results Performance
                                               TF 2 Engagement Performance Projected
                                               TF 2 Payments by Results Performance Projected                                                                              Source for all: ESCC Children’s Services
State of the County 2020: Children                                                                                                                  25

                                                                                   Looked After Children (LAC)
                                                                         • After reaching a low of 544 in 2016, LAC numbers increased to
                                                                         602 in 2018 and have since remained fairly consistent, with 601
                                                                         children looked after at the end of March 2020 (56.5 per 10,000
                                                                         children)
                                                                         • Our strategy of using Early Help and CP plans to keep children at
                                                                          home is connected to the rate of Looked After Children (LAC)

                                                                     Special Educational Need (SEN) and Disability
                                                                        • Council funded high cost placements at Independent and Non-
                                                                        Maintained Special Schools (INMSS) have increased significantly
                                                                        since 2015 but remain between 7% and 8% of the total number of
                                                                        Education, Health & Care Plans (EHCPs)
                                                                        • EHCPs of SEN maintained by the Council increased by 54% from
                                                                        2010 (2,280) to 2020 (3,510):

                                                                The vast majority of the increase since 2015 has been in the Key Stage 5
                                                                 and Post 19 groups
                         Upper age limit increased from         Numbers are currently forecast to rise to approximately 3,900 by 2022
                         19 to 25 September 2014
                                                                Over half of the number of newly issued EHCPs are, now, placed within
                                                                 special schools. This has been a shift since 2014 when the majority of
                                                                 children with EHCPs were placed in mainstream schools.
                                                                Due to increased demand, there has been an increase in the number of
                                                                 specialist placements. The county has secured agreement for four new free
                                                                 schools (three special schools and one alternative provision). The first, an
                                                                 alternative provision provider and a special free school for children with
                                                                 social, emotional and mental health needs and autism are planned to open
                                                                 in September 2020

                                                          • For 2020, East Sussex EHC Plans as a percentage of population aged 0-25
                                                            (2.37%) continues to be above that of England (2.23%)

                                                           Until Sep-14 a Statement of SEN could remain in place until the young person reached the age of 19.
                                                           Since the SEND reforms were introduced from Sep-14 EHC Plans can remain in place until the young
                                                           person reaches the age of 25
Source for all: ESCC Children’s Services
State of the County 2020: Children - COVID-19 Impacts                                                                                                                       26
                                                                      Early Help and Social Care
• 40% reduction (220 - 132) in contacts to our Single Point of Advice (SPOA) against the average for the 20 weeks before lockdown. Especially from schools and GPs, and
  around child and young people’s mental health
• Referrals to social care reduced by 24% (331-251) against the average for the 20 weeks before lockdown, with a 73% reduction in school referrals and a 3% increase from
  the Police
• There is a potential backlog of cases that may be referred once schools are open to more students. The most significant area of reduction is contacts from schools with
  outcomes relating to mental health
• The number of children with a child protection plan has increased from 542 (week commencing 9 March) to 586 (week commencing 15 June)
• The number of looked after children has reduced slightly from 605 (week commencing 9 March) to 602 (week commencing 25 May)

                                                                      Attainment and Attendance
• No assessments for Early Years Foundation Stage or Key Stage 2
• No GCSE or A levels exams will be taken this summer
• For academic year 2019/20 GCSE and A level awards, schools and colleges are being asked to provide centre assessment grades for their students.
• The DfE will not be publishing data on outcomes from academic year 2019/20, nor producing any league tables. The Council will only have limited access to school by
  school data which cannot be verified or used for accountability purposes
Schools have remained open for vulnerable children and children of key workers, with:
• 2,000 children attended school week commencing 18 May; two thirds are children of key workers and one third vulnerable children
• 1,187 laptops are being distributed to the most vulnerable Year 10 pupils. Working in partnership with Uni Connect and Hastings Opportunity Area we have ordered in
  excess of 200 additional devices to support our most vulnerable learners

All pupils: 13,102 attended school week commencing 22 June

The East Sussex Vulnerable Children’s Risk Assessment Process has been devised and implemented during COVID-19 to support LA services and schools to work together
on:
• Assessing and managing risk of vulnerable children and encouraging their attendance at school to mitigate these risks
• Developing improved systems of sharing information and utilising resources to monitor at-risk children during partial school closures
• Checking if there are barriers to attending school and working to resolve these
• Coordinating resources to support schools to widen provision

Exclusions: The reduced number of children in schools will deflate the number of exclusions issued this year. As schools did not use normal attendance monitoring systems,
there will be an impact on the recording and accuracy of exclusion data
State of the County 2020: Adults                                                                                                                                                                                                      27

                                                 Compared to 2020, by 2024 there will be:
                                                                                                                                                      Older people (age 65+) with a limiting long term
                                   • An increase in the population of working age people (age 18-64) of 4,407
                                   (1.4%)
                                                                                                                                                                    illness projections
                                  • A countywide increase in older people (age 65+) of   12,251 (8.3%) from                                                              Limited a little     Limited a lot
                                  146,962 to 159,213                                                                                  45,000                                                                                    41,060
                                                                                                                                                                                         39,080             40,120
                                                                                                                                      40,000         37,200            38,020
                                  → Eastbourne: 1,952 more (up 7.4%) biggest increase in age 75-84 (21.0%)
                                                                                                                                      35,000                                                                         30,750                31,500
                  → Hastings: 1,596 more (up 8.4%), a decrease in 65-74 (-1.5%), but 8.4% in 85+ and                                                                            28,980            29,870
                                                                                                                                      30,000                  28,310
                         26.6% in 75-84
                                                                                                                                      25,000
                  → Lewes: 1,848 more (up 6.8%) biggest increase in age 75-84 (20.2%)                                                 20,000
                  → Rother: 2,265 more (up 7.2%), small decrease in 65-74 (-3.1%), 21.9%                                              15,000
                    rise in 75-84                                                                                                     10,000
                              → Wealden: 4,590 more (up 10.6%), 25.0% rise in 75-84 and 14.1% rise in                                  5,000
                              85+                                                                                                         0
                                                                                                                                                       2020              2021               2022              2023                   2024
                              •    41,060 older people (age 65+) projected to have a limiting long term illness                                                                                                Source: POPPI, www.poppi.org.uk

             whose day to day activities are limited a little (up 10.4%), 31,500 limited a lot (up 11.2%)

                              •    12,350 older people (65+) projected to have dementia (up 10.7%)
                              Increase in older people, 2020-2024                                                                                                            Older people (age 65+) with dementia
                                                                                                 Population % 85+ (mid 2019 est)                                                         projections
                                             65-74   75-84      85+
                                                                                                             England                   East Sussex                14,000
                        160                                                                                                                                                                                11,720      12,020          12,350
                                                                                Up                                                                                12,000        11,150      11,390
                        140                                                  10.4%       5      4.4                            4.1             4.8     4          10,000
                                                                                         4
   Population ('000s)

                        120                                                                                                                                        8,000
                                                                                Up       3                     2.8                                    2.5 3.7
                        100                                                  22.9%                                                                                 6,000
                                                                                         2
                                                                                                                                                                   4,000
                         80                                                              1
                                                                                                                                                                   2,000
                         60                                                              0                                                                             0
                                                                             Down                                                                                                2020        2021           2022         2023            2024
                         40                                                  1.6%
                         20
                          0                                                                                                                                                                                   Source: POPPI, www.poppi.org.uk

                                    2020      2021      2022          2023   2024            Source: ONS Population estimates -2019
Source: ESCC population projections (dwelling led) April 2020
State of the County 2020: Adults                                                                                                                                                                                     28
                                                     Long-term support needs met by admission to
                                                                                                                                                   Older people (65+) still at home 91 days after discharge
                                                             residential and nursing homes
                                                                                                                                                                        from hospital
                                                                   (Older people 65+)
                                          700         668.8                                                                     100%
                                                                     628.2          610.7                                                                                                                        92.8%
                                                                                                     585.6          580.0         90%
                                          600
             Per 100,000 population

                                                 545.5          542.6                                                                                                                                            82.4%
                                                                               521.5          503.3             502.9             80%
                                          500                                                                                     70%
                                          400                                                                                     60%
                                                                                                                                  50%
                                          300                                                                                     40%
                                          200                                                                                     30%
                                                                                                                                  20%
                                          100
                                                                                                                                  10%
                                            0                                                                                      0%
                                                   2014/15       2015/16         2016/17           2017/18       2018/19                    2011/12 2012/13 2013/14 2014/15 2015/16 2016/17 2017/18 2018/19
         Source: NHS Digital Adult Social Care Outcomes Framework data ASCOF 2A2                                                       Source: NHS Digital Adult Social Care Outcomes Framework ASCOF 2B1
         Note: New definition 2014/15 onwards, not comparable to previous years

                                                                                                                 East Sussex       England

                                                  Long-term support needs met by admission to
                                                       residential and nursing care homes
                                                           (Working age people 18-64)
                                                                                                                                                          Community care and promoting independence
                           20                                                                                                             • Permanent admissions of working age people (18-64) to long term residential
                                                                                            17.7                               18-64      care reduced in 2018/19 but are slightly above the national rate
                                                                                                                                          • Permanent admissions of older people (age 65+) reduced again 2018/19 and
Per 100,000 population

                                                13.914.2                                       14.0          14.413.9                     remain significantly below the rate for England
                           15
                                                              12.913.3       12.812.8
                                                                                                                                          • The proportion of older people (age 65+) still at home 91 days after discharge
                                                                                                                                65+       from hospital into reablement/rehabilitation services increased in 2018/19 to
                           10                                                                                                             92.8%, and remains significantly above the national figure of 82.4%
                                                                                                                                          • 92.2% of people who received short-term services
                                                                                                                                          during the year, required no ongoing support or support of a
                                      5
                                                                                                                                          lower level; significantly higher than the national average of
                                                                                                                                          7.6%

                                      0
                                                2014/15       2015/16        2016/17        2017/18          2018/19
                                                                                                                                       Source: NHS Digital Adult Social Care Outcomes Framework data
         Source: NHS Digital Adult Social Care Outcomes Framework data ASCOF 2A1
         Note: New definition 2014/15 onwards, not comparable to previous years
State of the County 2020: Adults                                                                                                                                                                                        29
                                     Integrating health and social care                                                     People receiving Long term support
• There is now a single East Sussex Clinical Commissioning Group (CCG), and 12 Primary                 7,000
  Care Networks, enabling the Council and the CCG to work together and explore taking                                           6,363                                               6,451                        6,438
                                                                                                                                                          6,138
  forward an integrated approach to commissioning health and social care outcomes                      6,000
• Our East Sussex Health and Social Care System partnership consists of the East Sussex
                                                                                                       5,000
  CCG, the Council, East Sussex Healthcare NHS Trust, Sussex Community NHS
  Foundation Trust and Sussex Partnership NHS Foundation Trust, working with our wider                 4,000
  system including Primary Care Networks, district and borough councils, Healthwatch and                                                              3,077                 3,093                      3,095
                                                                                                                        2,944
  the voluntary and community sector. The key aim is to improve the health, health                     3,000
  inequalities and the wellbeing of local people, and make the best use of our combined
  resources, through more integrated care and an enhanced focus on prevention and                      2,000
  reablement after episodes of ill-health
• Through our East Sussex Health and Social Care Plan we have set out the priority                     1,000
  developments we need to work on collectively to meet the health and care needs of our                       0
  population, over the next 3-5 years. This is also the East Sussex contribution to the wider
                                                                                                                          2016/17                      2017/18                2018/19                    2019/20
  Sussex Health and Care Partnership Strategy to help achieve NHS Long Term Plan
  ambitions. We will review our plans using learning from responding to COVID-19, and the                              Working age people (age 18-64) receiving long term support
  need to continue to manage existing and new challenges and requirements as they arise
  so that our response is coordinated and provides safe, effective care                                                Older people (age 65+) receiving long term support
• The Integrated Care Partnership (ICP) in East Sussex has begun to enable greater levels
  of collaboration across health and social care provision and commissioning. Together with       • The total number of clients receiving Long Term support has decreased by
  our integrated health and social care outcomes commissioning this will help us to deliver         0.1% in 2019/20 to 9,533
  improved outcomes and reduce health inequalities for our population
                                                                                                 Long Term support encompasses any service or support which is provided with the intention of
                                        Requests for support                                     maintaining quality of life for an individual on an ongoing basis, and which has been allocated on the
                                                                                                 basis of eligibility criteria/policies (i.e. an assessment of need has taken place) and is subject to regular
                                       Access contacts handled                                   review
                                                                                                 Source: East Sussex Health and Social Care Connect
 70,000
                                                                          • The Access                     Carers receiving support
 68,000                                                                   team in Health and
                                                                          Social Care Connect
 66,000                                                                   (HSCC) handled                                                                         • The total number of carers receiving
                                                                                                       7,500                   7,418
                                                                          67,218 contacts in                        7,158                             7,121        support has increased by 6.6% in
 64,000                                                                   2019/20, an increase         7,000                                                       2019/20
                                                                                                                                         6,677
                                                                          of 1,407 (2%)                                                                          • Carers receive support including
 62,000                                                                   compared to 2018/19          6,500                                                       Information, Advice and Other
                                                                                                       6,000                                                       Universal Services / Signposting
 60,000
                                                                                                       5,500                                                                                          THIS WAY
                                                                                                                                                                                                                 OTHER WAY

 58,000                                                                                                                                                                                                          CHOICE

                                                                                                       5,000
 56,000

 54,000                                                                                                                                                          Source: East Sussex Health and Social Care Connect

                      2017/18                         2018/19   2019/20
 Source: East Sussex Health and Social Care Connect
State of the County 2020: Adults                                                                                                                                            30
                                                   Delayed Transfers of Care (DTOC)
 14
                       DTOC due to Adult Social Care Services: average daily beds                      DTOC due to Council services only:
 12                                                                                                      average daily beds per month

                                                                                                      • Average daily DTOC beds is based on the
 10                                                                                                     number of delayed days divided by number of
                                                                                                        days in the month giving an average number
                                                                                                        of delays per day
  8
                                                                                                                • Delays attributable to Adult Social Care
                                                                                                                (ASC):
  6
                                                                                                                10.3, March 2019                  3.5,      February 2020

  4                                                                                                   The number of delays attributable to ASC has
                                                                                                      significantly reduced, and consistently met the target of
                                                                                                      11.5 or less
  2
                                                                                                      • The main reasons for ASC delays in February 2020
                                                                                                        were:
  0                                                                                                      → Awaiting residential home placements: average
                                                                                                           1.9 delays per day,         54%
                                                                                                                                      of delays
                                                                                                         → Awaiting care package in own home: 0.7 delays,
                   Completion of assessment
                   Residential home
                                                         Public funding
                                                         Nursing home
                                                                                                            20% of delays
                   Care package in home                  Patient/family choice
                   Disputes                              Other
                                              Adult Safeguarding                                                • There has been a decrease in the
                                                                                                                  percentage of safeguarding enquiries for
    Mental Capacity and advocate support                       Safeguarding enquiries: outcomes                   adults who lack capacity between 2017/18
80%
    for completed safeguarding enquiries                                   2018/19                                and 2018/19 (36% to 33%)
                                                       70%
                          2017/18    2018/19                        59%                                         • Of the adults who lacked
             58%                                       60%
60%    55%
                                                       50%
                                                                                                                    capacity,   99% were
                                                                                                                    supported by an advocate
                     36% 33%                           40%                         35%                              which was the same as
40%
                                                       30%                                                          2017/18
20%
                                      9% 8%
                                                       20%
                                                                                                 6%
                                                                                                                •   94% of safeguarding enquiries resulted
                                                       10%                                                          in the expressed outcomes being achieved
0%                                                      0%                                                          or partially achieved in 2018/19
       Adult has    Adult lacks      Not known                Fully achieved     Partially   Not achieved
       capacity      capacity                                                    achieved                              Source for all: East Sussex Adult Social Care and Health
You can also read