State of Tennessee Utility Data Management (UDM) - Facility Management Refresher Training January 27, 2021 - TN.gov
←
→
Page content transcription
If your browser does not render page correctly, please read the page content below

State of Tennessee
Utility Data
Management (UDM)
Facility Management Refresher
Training
January 27, 2021
About SFUM
The State Facility Utility Management (SFUM) section is part of the Office of Energy Programs (OEP) within TN
Department of Environment and Conservation (TDEC).

SFUM was formed January 1, 2017 in response to Executive Order 63 transferring to TDEC the building
management statutory responsibilities for State-owned and managed properties (Tenn. Code Ann. §§ 4-3-1012
and 4-3-1017-1019) previously held by the Department of General Services.

SFUM is responsible for several utility savings and building energy management initiatives, including the
following:

•   Development and maintenance of an online Utility Data Management (UDM) platform for State-owned and
    managed facilities.

•   Oversight of energy efficiency projects under the EmPower TN initiative, designed to reduce energy
    consumption and utility costs for participating State facilities through the implementation of energy efficient
    technologies and/or energy management systems.

•   Provision of no-cost technical assistance to State agencies and public higher education facilities to promote
    the implementation of energy management, energy efficiency, and/or renewable energy projects that meet
    the needs, budgets, and priorities of participating entities.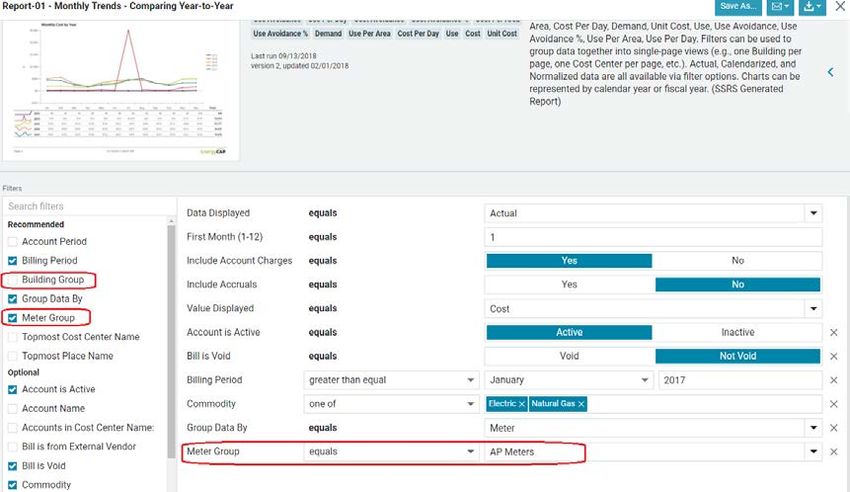
Meet the SFUM team
•   Jeremy McBride, Senior Data Analyst & Energy Consultant, Jeremy.McBride@tn.gov

•   Natalie Dallriva, Energy Analyst, Natalie.Dallriva@tn.gov

•   Greg Jones, Data Entry & Platform Maintenance Specialist, Greg.S.Jones@tn.gov

•   Ryan Stanton, Sr. Consultant for Strategic Energy Initiatives, Ryan.K.Stanton@tn.gov

•   Rick Kumar-Rathor, Energy Consultant, Rick.Kumar-Rathor@tn.gov

•   Russell Tedrow, Grants Analyst 2, Russell.V.Tedrow@tn.gov
UDM Platform Overview

The UDM platform data is captured and stored by the State’s third-party vendor
EnergyCAP, Inc. The platform stores data for utility costs and usage for
approximately 8,000 State-owned and managed facilities (approximately 105
million square feet). UDM is predominantly used for utility tracking, reporting,
benchmarking, and bill payment integration for General Government agencies.
UDM also stores historical data and provides ongoing data feeds for all known
and active State utility accounts.
EnergyCAP

INTRODUCTION

      John Pierce
      Assistant VP, Project Management Office
EnergyCAP

VALUE

            ©2021 EnergyCAP, Inc.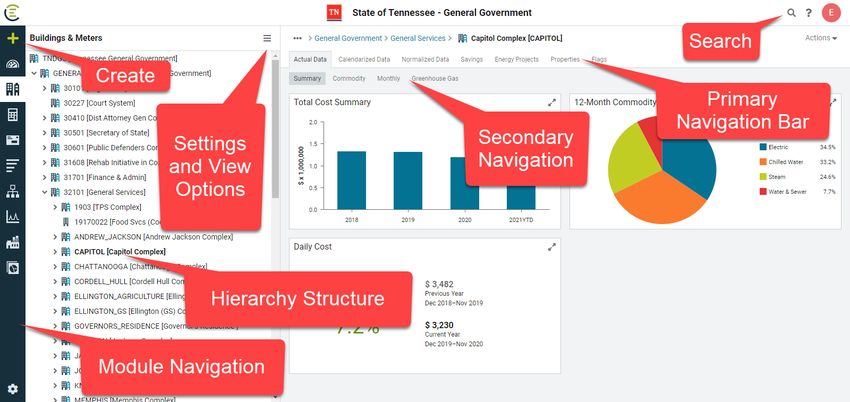
Value

                        3

©2021 EnergyCAP, Inc.
Value

                        4

©2021 EnergyCAP, Inc.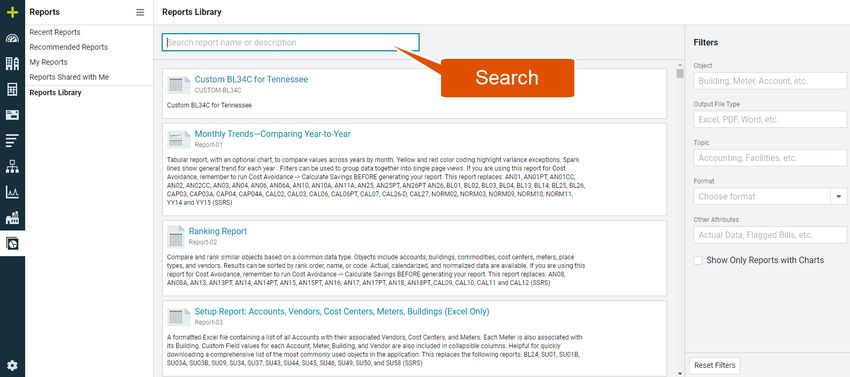
EnergyCAP

LOGIN

            ©2021 EnergyCAP, Inc.
Login

             Supported Internet
             Browsers:
                                   Chrome     Firefox   Edge

             Navigate to: https://my.energycap.com

             Enter Username (TN email address)

             Enter Password

             Enter Datasource of tennessee

             Check “Remember Me”

             Log In

©2021 EnergyCAP, Inc.
Display Preferences
1. Click the User Icon 2. Update your display preferences 3. Click Save
(top right corner)
Select “Display
Preferences”
7
©2021 EnergyCAP, Inc.EnergyCAP
NAVIGATION
©2021 EnergyCAP, Inc.Navigating EnergyCAP
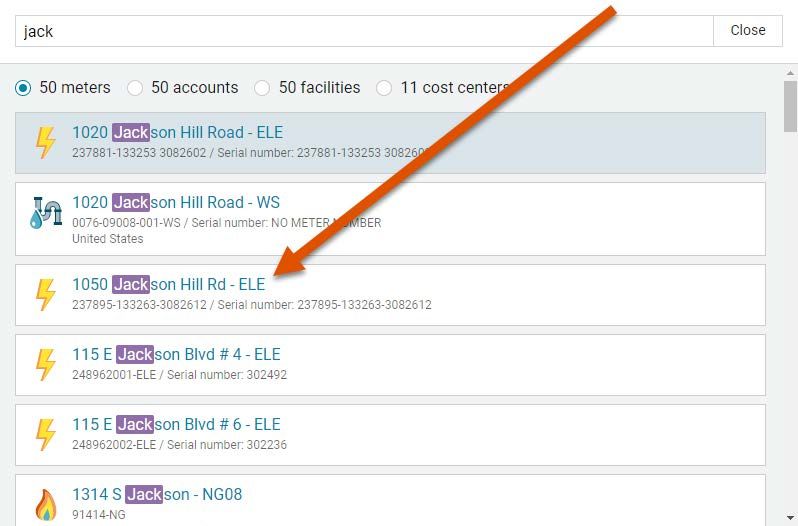
Search & Hyperlinks
Navigation Overview
Module Overview
EnergyCAP Object Properties
©2021 EnergyCAP, Inc.Search & Hyperlinks
1. Click the Search 2. Enter the search value. 3. Click hyperlink
Icon (top right corner)
10
©2021 EnergyCAP, Inc.Navigation Overview
11
©2021 EnergyCAP, Inc.Navigation Overview
12
©2021 EnergyCAP, Inc.Dashboard
Customizable overview of EnergyCAP data
13
©2021 EnergyCAP, Inc.Buildings & Meters
Facility Data
Data Organized by
Organization/Building
Meters Attached to Building or
Organization
14
©2021 EnergyCAP, Inc.Buildings & Meters - Building Properties
Includes:
Build Date
Floor Area
Primary Use
ENERGY STAR
Rating
Custom Fields 15
Place Group
Assignments
©2021 EnergyCAP, Inc.Buildings & Meters - Meter Properties
Includes:
Linked Account(s)
Linked Vendor
Units of Measure
GL Subcode Values
Custom Fields
Meter Group
Assignments
16
©2021 EnergyCAP, Inc.Buildings & Meters - Module Menu
Includes:
Cost Avoidance
Services and Tools
ENERGY STAR
Settings
Hierarchy
Manage Options
View Options
17
List Options
©2021 EnergyCAP, Inc.Buildings & Meters - Module Menu
Manage Buildings and Organizations
Edit, move, or delete buildings and
Organizations
Contact SFUM to suggest changes!
18
©2021 EnergyCAP, Inc.Accounts
Accounting Data
Data Organized by Cost Center
Accounts Attached to Cost Centers
19
©2021 EnergyCAP, Inc.Accounts – Account Properties
Includes:
Vendor Information
Linked Meter(s)
Assigned Rates
Custom Fields
20
©2021 EnergyCAP, Inc.Accounts – Module Menu
Includes:
Settings
Hierarchy
Manage Options
View Options
List Options
21
©2021 EnergyCAP, Inc.Bills/Bill Processing
Enter/Import Bills Share Bill Lists
Create Bill Lists Manage Batches
22
©2021 EnergyCAP, Inc.Groups & Benchmarks
Compare similar meters and buildings with default and customized groupings.
23
©2021 EnergyCAP, Inc.Vendors & Rates
Analyze spending by vendor or rate.
24
©2021 EnergyCAP, Inc.Vendors & Rates - Module Menu
Includes:
Settings
Hierarchy
List Options
View Options
25
©2021 EnergyCAP, Inc.Reports
26
©2021 EnergyCAP, Inc.EnergyCAP
REPORTS
©2021 EnergyCAP, Inc.Over 350 reports
help you analyze data from utility bills, setup
information, interval data and Cost Avoidance.
©2021 EnergyCAP, Inc.Users can:
Configure and save reports
Share reports with others
Anyone can update a shared report
If the owner is made inactive the shared report is still available
Email a report to a user or group
©2021 EnergyCAP, Inc.How do you find a report?
©2021 EnergyCAP, Inc.REPORT FOLDERS
©2021 EnergyCAP, Inc.Recent Reports
For quick access, your most recent reports are listed in this section,
most recent report shown first.
Recommended Reports
These reports are selected by your administrator and placed in this
group for easy access.
©2021 EnergyCAP, Inc.Search for a Report
Search by report name, or description. Filter reports being shown by Object,
Output File Type, Topic, Format, Other Attributes, or only ones with Charts.
©2021 EnergyCAP, Inc.Apply Report Filters
©2021 EnergyCAP, Inc.Download Options
Excel option is useful when you want to
sort and manipulate the data within the
report.
©2021 EnergyCAP, Inc.Save Report
©2021 EnergyCAP, Inc.My Reports
Configure and save frequently used reports:
Select the report.
Configure the filters.
Select Save
Change the name or description, this is especially helpful when
sharing the report with others.
©2021 EnergyCAP, Inc.Reports Shared with Me
Reports that have been configured, saved and shared with one, or
several user groups. Certain user roles have permission to share.
Filters are modifiable by the user.
©2021 EnergyCAP, Inc.Email options
©2021 EnergyCAP, Inc.Helpful reports
©2021 EnergyCAP, Inc.Executive Summary Reports
Search for "executive“, or Filter Format to “Executive Summary”, to see a list of
one page summary reports.
These reports often have a graph at the top with supporting details below.
©2021 EnergyCAP, Inc.REPORT-04 – Summary by Commodity
Provides an executive
summary of Commodity
consumption and costs.
Displays pie charts and a
table of results.
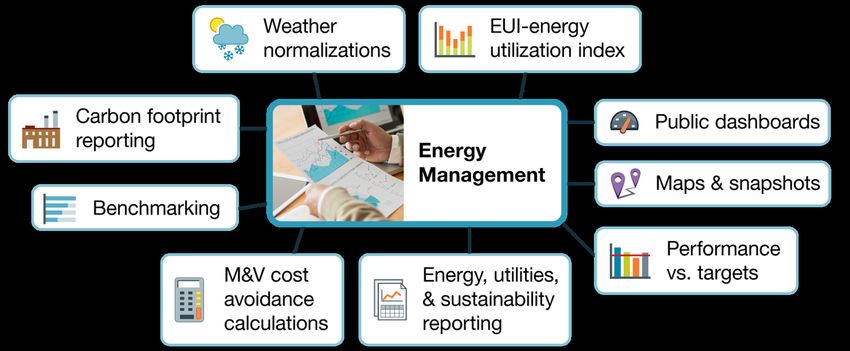
©2021 EnergyCAP, Inc.Energy Management Report Guide
14 recommended
Energy Management
reports and important
filters
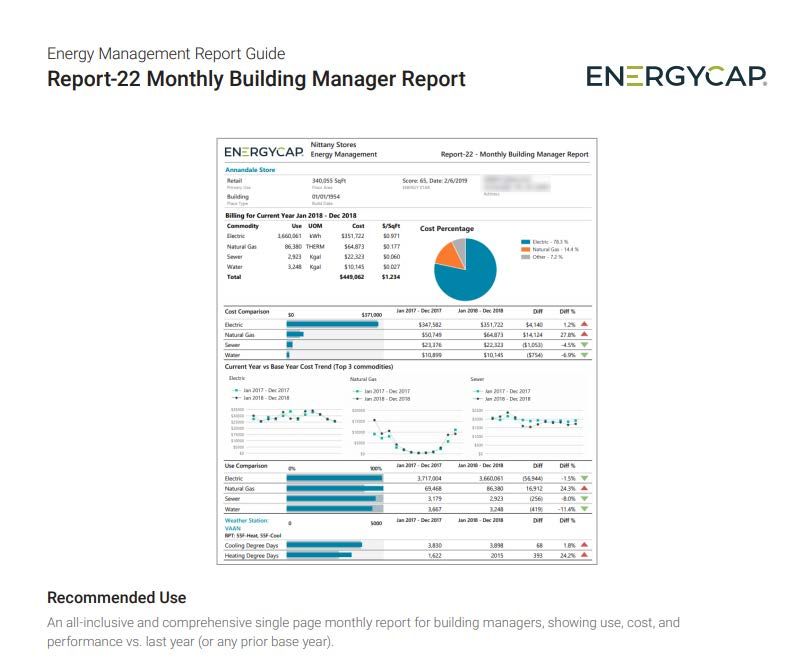
©2021 EnergyCAP, Inc.Energy Management Report Guide
https://helpcenter.energycap.com/assets/media/EnergyMgmtReportGuide.pdf
©2021 EnergyCAP, Inc.Energy Management Report Guide
Report-22 – Monthly Building Manager Report-14 – Cost Avoidance
Report
Report-01 – Monthly Trends Comparing Year-to-Year
Report-10 – Two Year Comparison
Report-02 – Ranking Report (by Building Cost/Area)
Report-04 – Summary by Commodity
Report-02 – Ranking Report (by Meter Unit Cost)
Report-13 – Bill Analysis
Report-21 – Monthly Comparison
Report-19 – Monthly Utility Use and
Cost Spreadsheet Report-06 – Year-over-Year Comparison
Report-26 – Use and Cost Summary Report-08 – Monthly Trends – One Page per Year
Report-23 – Energy Conservation
Program
©2021 EnergyCAP, Inc.Report Help
EnergyCAP Help for Reports:
https://helpcenter.energycap.com/#t=
Reports%2FHelpful_Reports.htm
©2021 EnergyCAP, Inc.EnergyCAP
DASHBOARDS
©2021 EnergyCAP, Inc.Dashboards
Create and customize
Can only edit content
in My Dashboards, or
My Maps
Maps plot buildings
based on Latitude and
Longitude, or the
address
48
©2021 EnergyCAP, Inc.Dashboards – Copy & Edit
Copy
Change Name
Unlock
49
©2021 EnergyCAP, Inc.Dashboards – Copy & Edit
Add/Move Widgets
Edit Filters
50
©2021 EnergyCAP, Inc.Dashboards – Lock & Use
51
©2021 EnergyCAP, Inc.Dashboards – Show, Hide, and Copy
52
©2021 EnergyCAP, Inc.EnergyCAP
GROUPS & BENCHMARKS
©2021 EnergyCAP, Inc.Access Groups and
Benchmarks
©2021 EnergyCAP, Inc.Two Divisions of Groups
Building Groups, made up of buildings.
Meter Groups, made up of meters.
©2021 EnergyCAP, Inc.Group Types
Manual Groups (gold) – members are
added, or removed, manually.
Automatic Groups (purple) – populated
and maintained automatically using a
comprehensive list of available filters.
©2021 EnergyCAP, Inc.Power of Automatic Groups
Let EnergyCAP keep your groups up-to-date.
When combined with Custom Fields, the possibilities are endless
EXAMPLES:
GL Subcode Groupings Construction Types
Similar Sized Buildings Similar HVAC Equipment
Geographical Regions Chargeback Meters
ENERGY STAR Ratings Facility Age
©2021 EnergyCAP, Inc.Types of Benchmark Charts
High to Low
Low to High
Scatter Plot: Visually identify outliers
Details: Several columns of data for each group member, each column is
sortable
©2021 EnergyCAP, Inc.Types of Benchmark Charts
The median Cost/Day is $774.42/day.
©2021 EnergyCAP, Inc.Filters
Data Type – Actual vs Calendarized
Billing Period Range
Commodity Displayed
Show Hidden Buildings/Meters
Show Buildings/Meters with Zero Averages
©2021 EnergyCAP, Inc.Hide/Show
Occasionally you may want to hide a Group Member from the benchmarks and
the calculations. A hidden member is not removed from the group. Its data is
simply not displayed or used in calculations for the associated benchmarking
charts.
1. Select the hide icon to exclude the member.
2. The benchmark calculations and median update automatically
3. To include the member again, on the Buildings, or Meters, tab, click the
Show icon.
©2021 EnergyCAP, Inc.Hide/Show
©2021 EnergyCAP, Inc.Benchmark Views
Meter Benchmark Views Place Benchmark Views
Cost/Day Rank Cost/Area Rank
Cost/Unit Rank Use/Area Rank
Use/Day Rank Demand/Area Rank
Cost/Day Rank
Use/Day Rank
©2021 EnergyCAP, Inc.Filter for Dashboards
©2021 EnergyCAP, Inc.Group Reports
AN13 through AN19 are
reports based off the charts
seen in Groups &
Benchmarks
New SSRS reports are also
built to use the Group filter
When running the report, be
sure to use the respective
Building or Meter Group
name as a filter in the reports.
©2021 EnergyCAP, Inc.Hierarchy for Quick Comparison
A little-known feature of
EnergyCAP is the ability to
change the view in Buildings &
Meters to display meters from a
specific Meter Group.
This allows you to quickly
compare the same chart for
multiple meters.
©2021 EnergyCAP, Inc.EnergyCAP
POWERVIEWS
©2021 EnergyCAP, Inc.PowerViews
Charts and Graphs displaying Cost and Use Data for selected Objects
©2021 EnergyCAP, Inc.PowerViews
Calendarized Monthly to view recent trends
©2021 EnergyCAP, Inc.EnergyCAP
ENERGY PROJECTS
©2021 EnergyCAP, Inc.Energy Projects - Overview
Summary data of projects that impact energy use
Not intended to be comprehensive project management tool
Results in an indicator on the EUI Chart for completed projects
Information is subtotaled at the Organization Level
©2021 EnergyCAP, Inc.Energy Projects - Add
Requires a unique Name
Requires a Short name
and Type
Enter other information,
as available
Energy Projects with
Completion Dates are
indicated on the EUI Charts
©2021 EnergyCAP, Inc.Energy Projects – EUI Charts
©2021 EnergyCAP, Inc.Thank you!
John Pierce
Assistant VP, Project Management OfficeYou can also read