Split-Flaps - a Way to Improve the Heel Stability of T-Foil Supported Craft
←
→
Page content transcription
If your browser does not render page correctly, please read the page content below
Journal of Sailing Technology 2022, volume 7, issue 1, pp. 1 – 30.
The Society of Naval Architects and Marine Engineers.

Split-Flaps – a Way to Improve the Heel Stability
of T-Foil Supported Craft
N.S.S. Prabahar
Ph.D. Student, Department of Marine Sciences, University of Gothenburg, Gothenburg, Sweden.
nimal.sudhan.saravana.prabahar@gu.se

A. Persson
Ph.D. Student, Chalmers University of Technology, Gothenburg, Sweden & Project Manager,
SSPA Sweden, Gothenburg, Sweden

L. Larsson

 Downloaded from http://onepetro.org/JST/article-pdf/7/01/1/2529231/sname-jst-2022-01.pdf by guest on 25 June 2022
Professor Emeritus, Department of Mechanics and Maritime Sciences, Chalmers University of
Technology, Gothenburg, Sweden

Manuscript received June 4, 2021; revision received November 1, 2021; accepted November 11, 2021.

Abstract. Horizontal T-foils allow for maximum lift generation within a given span. However, the lift
force on a T-foil acts on the symmetry plane of the hull, thereby producing no righting moment. It
results in a lack of transverse stability during foil-borne sailing. In this paper, we propose a system,
where the height-regulating flap on the trailing edge of the foil is split into a port and a starboard part,
whose deflection angles are adjusted to shift the centre of effort of the lift force. Similar to the ailerons
which help in steering aircraft, the split-flaps produce an additional righting moment for stabilizing
the boat. The improved stability comes, however, at a cost of additional induced resistance.
To investigate the performance of the split-flap system a new Dynamic Velocity Prediction Program
(DVPP) is developed. Since it is very important for the performance evaluation of the proposed
system it is described in some detail in the paper. A complicated effect to model in the DVPP is the
flow in the slot between the two flaps and the induced resistance due to the generated vorticity.
Therefore, a detailed CFD investigation is carried out to validate a model for the resistance due to
the slot effect.
Two applications of the split-flap system: an Automated Heel Stability System (AHSS) and a manual
offset system for performance increase are studied using a DVPP for a custom-made double-handed
skiff. It is shown that the AHSS system can assist the sailors while stabilizing the boat during
unsteady wind conditions.
The manual offset enables the sailors to adjust the difference between the deflection angles of the
two flaps while sailing, thus creating a righting moment whenever required. Such a system would be
an advantage whilst sailing with a windward heel. Due to the additional righting moment from the
manual offset system, the sails could be less depowered by the sailors resulting in a faster boat
despite the additional induced resistance.
It is shown in the paper that the control systems for the ride height and the heel stability need to be
decoupled. The paper ends with a description of a mechanical system that satisfies this requirement.

Keywords: Hydrofoil; Split-Flaps; Transverse Stability; DVPP.

 1
NOMENCLATURE

 Effective Aspect Ratio [-]
 Beam [m]
 , Induced drag coefficient [-]
 Lift coefficient [-]
 ,2 2-Dimensional lift Coefficient [-]
 ,3 3-Dimensional lift Coefficient [-]
 Force Residuals [N]
 Flap angle [deg]
 Optimal flap angle [deg]
 Portside flap angle [deg]
 Starboard flap angle [deg]
ℎ Ride height [m]
 Mass Moment of Inertia of the Boat [kg m2]
 Response coefficients of the sailor control system [-]

 Downloaded from http://onepetro.org/JST/article-pdf/7/01/1/2529231/sname-jst-2022-01.pdf by guest on 25 June 2022
 Moment Residuals [N m]
 Mass of the boat [kg]
 Roll rate [rad s-1]
 Linear boat velocity in x-direction [m s-1]
 Linear boat velocity [m s-1]
 ̇ Linear acceleration [m s-2]
 Linear boat velocity in z-direction [m s-1]

 Angle of attack [deg]
 Heel angle [deg]
 ̇ Heel rate [deg s-1]
 Pitch angle [deg]
 ̇ Pitch rate [deg s-1]
 Yaw angle [deg]
 ̇ Yaw rate [deg s-1]
 Density of water [kg m-3]
 Angular roll velocity [rad s-1]
 ̇ Angular acceleration [rad s-2]

AHSS Automated Heel Stability System
AR Aspect Ratio
CAD Computer-Aided Design
CE Centre of Effort
CFD Computational Fluid Dynamics
CG Centre of Gravity
DOF Degree of Freedom
DVPP Dynamic VPP
EOM Equations of Motion
GC Gain Coefficient
RANS Reynolds Averaged Navier-Stokes
RM Righting Moment [Nm]
TCG Transverse Centre of Gravity of the sailors
TE Trailing Edge
TWA True Wind Angle [deg]
TWS True Wind Speed [m s-1]
VPP Velocity Prediction Program

 2
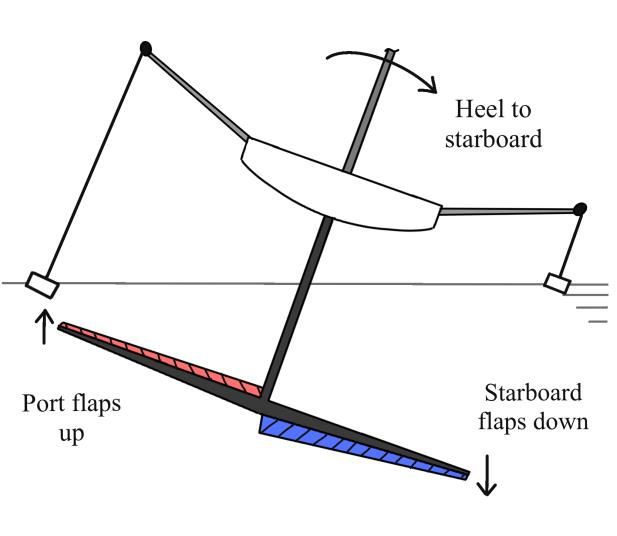
1. INTRODUCTION

One of the most common foil configurations for lighter dinghies is the T-foil. It is favoured for foiling
dinghies with high lift requirements and has better structural characteristics compared to cantilever
foils (Monsonnec and Waller, 2015). T-foil configurations usually consist of a single main horizontal
foil and a vertical centreboard connecting the horizontal foil to the hull such that the lift of the foil acts
in the centreplane of the boat. Such configurations also have a smaller horizontal foil attached to the
rudder board to stabilize the boat in pitch (Beaver and Zseleczky, 2009).

For larger foiling craft (AC50 and AC75 etc.), the layout contains separate leeward and windward
foils, where only the leeward foil is in the water, thereby generating a large righting moment. See
Larsson et al (2022). With a single T-foil foiling craft suffer from a lack of transverse stability. Thus,
the stability of the boat is crucially dependent on the sailor’s position, which complicates the handling,
particularly for double-handed skiffs. With righting moment from the hull lost while foiling, there is
little room for error whilst handling the boat. During wind disturbances and manoeuvring, the control
of the boat could become overwhelming for the average sailor.

 Downloaded from http://onepetro.org/JST/article-pdf/7/01/1/2529231/sname-jst-2022-01.pdf by guest on 25 June 2022
To ease the sailor's efforts in balancing the boat, a system to produce an additional righting moment
from the foils is studied in this paper. The Trailing Edge (TE) flap, used for T-foils to control the foiling
height of the boat, is split in the centreplane into a starboard and port flap. Deflecting the split-flaps
at different angles will shift the Centre of Effort (CE) producing a righting moment
However, the righting moment comes at a cost. There is a very complex flow between the split-flaps,
generating a trailing vortex, and the strength of the tip vortices may also be increased. So, there will
be an increase in induced resistance.

An explanation of the proposed system and its effect is presented in Section 2, followed, in Section
3, by a description of the test case, the double-handed skiff Linnea, designed for the very light winds
off Palermo in late September. In Section 4 a newly developed Dynamic Velocity Prediction Program
(DVPP) is introduced. Since this is very important for the evaluation of the performance of the
proposed system it is presented in some detail. In order to model the effect of the complicated flow
between the two flaps a systematic CFD investigation was carried out. It is presented in Section 5
and the result is used in the DVPP. Results from DVPP computations are reported in Section 6,
where the performance of the proposed system is analysed in detail. It is shown that for maximum
performance the ride height and heel stability control systems have to be independent, and a
mechanical system with this capability is introduced in Section 7. Finally, several conclusions are
presented.

2. SPLIT TRAILING EDGE FLAPS ON T-FOIL CONFIGURATIONS

Split trailing-edge flaps operate similar to aircraft ailerons: by deflecting the flap down, for instance
on the starboard side, and up on the port side, the lift force is increased on the starboard side and
reduced on the port side. The difference in lift force shifts the CE to starboard and the corresponding
moment tends to rotate the boat towards the port side. Figure 1 shows the split flaps on a horizontal
foil with the port flap (blue) deflected upwards and the starboard flap (red) deflected down.

Figure 1. Split flaps on a horizontal foil – Port flap (blue) and starboard flap (red)

 3
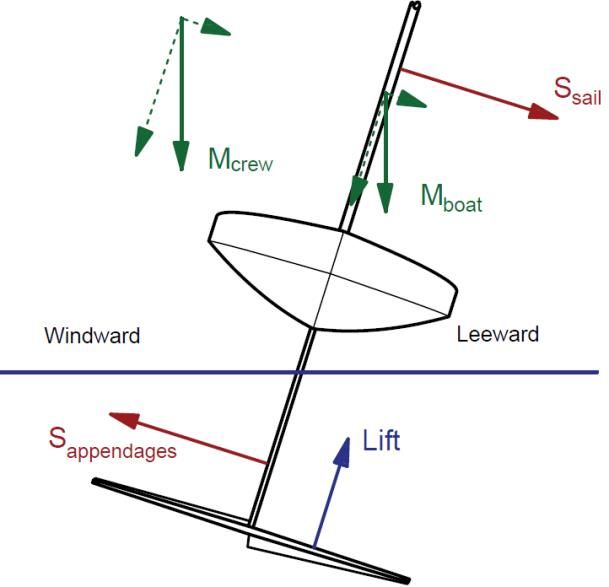
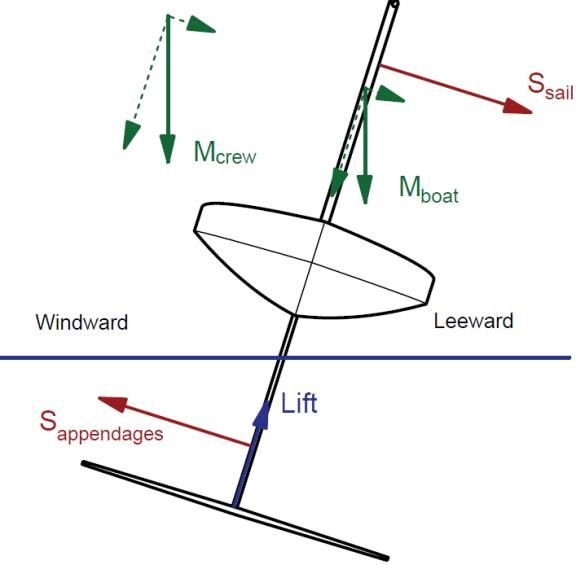
2.1 Forces on T-Foil Configurations

In figure 2, the major force components contributing to the transverse stability of a heeled foiling
sailboat are presented. The heeling moment towards the leeward side is produced by the sail force
and the appendage side force, and the righting moment towards the windward side is produced by
the gravity force of the boat and sailors. The lift force acts through the Centre of Gravity (CG) of the
hull and does not produce a moment around the CG. With the gravity forces resolved into orthogonal
components along the boat fixed coordinate system it can be observed that the horizontal component
produces a heeling moment when the boat is heeled to leeward (Figure 2a). As seen in figure 2b,
the horizontal component of gravity forces produces a righting moment (i.e. opposite to the heeling
moment from the sails) with a windward heel. Thus, most sailors prefer to heel windward when foiling
to increase the righting moment from the gravity force.

 Downloaded from http://onepetro.org/JST/article-pdf/7/01/1/2529231/sname-jst-2022-01.pdf by guest on 25 June 2022
 Figure 2. Transverse forces on a heeled sailboat – (a) Heeled to leeward (b) Heeled to
 windward

2.2 Foiling with the Automated Heel Stability System

The split-flaps are used with two applications: to increase stability during disturbances with the AHSS
and to increase performance with the manual offset system. With the Automated Heel Stability
System (AHSS), the split-flaps are deflected according to the heel angle of the boat, thereby an
automated stabilizing response to the heel is generated. Figure 3 shows the forces acting on the
boat while sailing with the AHSS. The lift force is shifted leeward while heeling leeward and produces
a moment towards the windward side, and the opposite happens with a windward heel. AHSS would
require an effective control system to measure the height and heel angle and adjust the individual
flaps proportionately. The effectiveness during wind disturbances is studied using a DVPP.

 4
Downloaded from http://onepetro.org/JST/article-pdf/7/01/1/2529231/sname-jst-2022-01.pdf by guest on 25 June 2022
 Figure 3. Forces on a heeled sailboat with AHSS – (a) Heeled to leeward (b) Heeled to
 windward

2.3 Foiling with the Manual Offset System

Since heeling windward increases the arm of the gravity forces, most sailors would prefer heeling to
windward. As AHSS would oppose heeling windward, so, complimenting the AHSS, a mechanism
that would let the sailors manually adjust the difference between the deflection angles of the split-
flaps is added. The offset refers to shifting the ideal heel angle the AHSS should maintain. Without
the offset, the AHSS would try to maintain a zero heel angle and using the offset the AHSS could be
forced to maintain a windward heel. The ‘manual offset’ will be useful to shift the CE of lift towards
leeward while heeling windward (Figure 4). Thereby, maximizing the righting moment from the
gravity forces and yet producing an additional righting moment from the foils. Due to the additional
stability, the sailors could increase the power on the sails and increase the boat speed.

 Figure 4. Sailing with the manual offset with a windward heel

 5

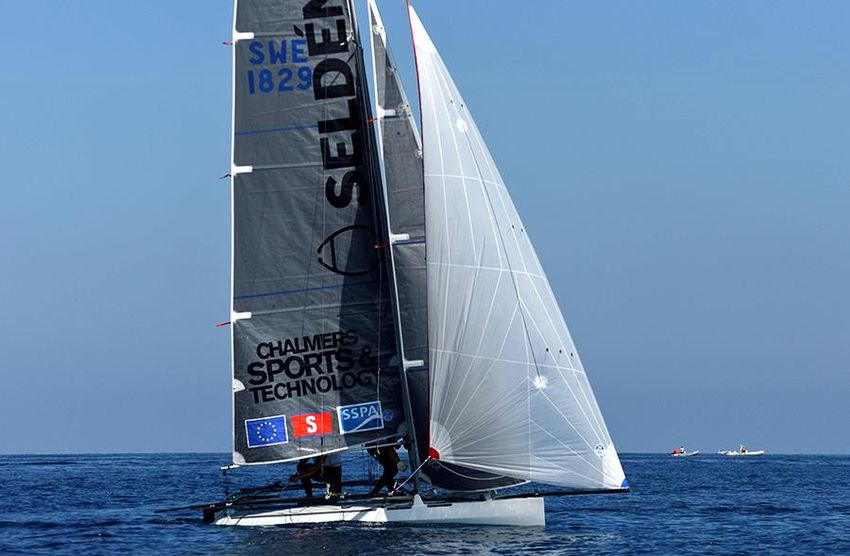
3. TEST CASE

The test case for this study is a 4.6 m long skiff designed and built by the students from the Naval
Architecture and Ocean Engineering Master’s program at Chalmers University of Technology to
compete for the 1001Vela Cup in 2018. This double-handed skiff “Linnea” has a displacement of
149 kg excluding the sailors when fully rigged. The design of Linnea was inspired by the Olympic
49er class but adapted to the low wind speeds expected at the race venue, with a taller mast and
larger upwind sail plan (Acerbi et al, 2017). These large sails and rigging, in turn, shift the CG
upwards making the boat highly unstable, even without foils. The original design was a non -foiling
skiff, but recent changes in regulations to allow high-performance materials support the idea of
foiling. The project for the year 2020 was to design foils for the existing hull and T-foil configurations
were considered to maximize the lift generated. Being an unstable double-handed skiff, Linnea is
very difficult to balance even without foils, and in foil-borne conditions, it would hardly be possible
using a standard T-foil configuration. The 2020 regatta was conducted as a design competition due
to the COVID-19 pandemic and hence the foils designed for Linnea has not been manufactured.

 Downloaded from http://onepetro.org/JST/article-pdf/7/01/1/2529231/sname-jst-2022-01.pdf by guest on 25 June 2022
3.1 Foil Design

The skiff is designed in compliance with the R3 class rules of 1001Vela Cup 1, which for instance
states that the overall breadth including appendages is limited to 2.1 m. Since the wind speed is very
low, any foil configuration should make use of the entire span to generate a reasonable lift.
Configurations with separate port and starboard foils would half the lift generated if only one side is
lowered and would be hard to handle with just a crew of two.

 Figure 5. The test case - Linnea

1
 The rules are available on url: 1001VEhttps://www.1001velacup.eu/regolamento.html. The class rules have
been modified now to remove the span restriction, however, this happened quite late in the project when the
design was already finalized

 6
A horizontal foil layout was chosen to utilize the full 2.1 m span for lift generation. The foil will be
submerged at all times, supported by the hull via the centreboard. The airfoil section is chosen as
Wortmann FX-60100 (figure 6) due to the high lift to drag ratio at the low Reynolds numbers
(Andersson et al, 2018). With the span limited, and the Taper Ratio set at 0.45 for minimum induced
drag, only the chord length of the foil was free for optimization. A systematic parametric study was
performed using a static Velocity Prediction Program (VPP) to estimate the mean chord length which
will result in the lowest possible take-off True Wind Speed (TWS). Based on this study, a mean chord
of 0.263 m was selected.

 Downloaded from http://onepetro.org/JST/article-pdf/7/01/1/2529231/sname-jst-2022-01.pdf by guest on 25 June 2022
 Figure 6. Cross-section of FX60100 showing the trailing edge flaps

3.2 Control System Design

For height regulation, the TE flaps were designed to be at 30 % of the local chord length to ensure
optimal control over the lift (figure 6). The flap would ideally deflect between +12 degrees and -7
degrees (positive downward), set based on the reasoning that a flap deflection of -6.8 degrees
corresponds to zero lift generation for this airfoil and flap length, and any flap angle greater than +10
degrees will increase the risk of flow separation.

3.2.1 Ride Height Control

Ride height is defined as the displacement of the boat in the vertical direction. To maintain a stable
ride height and to prevent the boat from flying out of water, the TE flap angles need to be reduced
(deflected upward) with an increase in ride height. There have been both electronic and mechanical
control systems used to adjust the flaps. However, due to R3 class compliance, which prohibits the
use of stored power, the system was designed to be purely mechanical. One of the most common
ways is to use a surface skimming wand that follows the water surface. The wand is connected to
the flaps using mechanical links. Since the wand skims the surface, when the boat rises, the wand
is lowered, which in turn reduces the flap angle and consequently the lift force. The opposite happens
when the boat falls. This system has been successfully applied in foiling moths for a long time,
Beaver and Zseleczky (2009).

3.2.2 Control System for the Split-Flaps

For automated heel stability, two wands are used, on the maximum beam positions on the starboard
and port side. Each wand would be connected only to the respective side of the split TE flap, such
that each wand behaves as an individual ride height response system. When there is no heel, both
wands are displaced in sync to adjust both flaps in proportion only to the ride height. As the boat
heels, one wand is displaced upwards and the other downwards, and this deflects the respective
flaps downward and upwards (figure 7). Using a cam fixed on the rotational axis of the wand, the
rotation of the wand is transferred to the flaps using a push rod that follows the cam (See Boman,
2020). The two-wand system implicitly responds to heel as the change in the height on the respective
side.

 7
Downloaded from http://onepetro.org/JST/article-pdf/7/01/1/2529231/sname-jst-2022-01.pdf by guest on 25 June 2022
 Figure 7. AHSS control system with two wands

An offset screw could be used in the mechanical links between the wand and the flaps to manually
create a difference in the flap angles. This mechanism would be controlled by the sailors during the
race to increase the righting moment and to heel windward with the AHSS. The design of such a
system has been proposed by Boman (2020).

4. THE NEWLY DEVELOPED DVPP

4.1 DVPPs versus linearized approaches.

It is possible to check the flight stability of the boat in different modes through stability derivatives
without fully solving the non-linear Equations of Motion (EOM). The EOM are linearized around an
equilibrium point and motions are treated as small disturbances (Masuyama, 1987). The stability
derivatives in each DOF are calculated and the eigenvalues of the resulting stability matrix provide
details on the dynamic stability of the system in different modes. Masuyama (1987) provided a
detailed study on the methods to compute the stability derivatives for a foiling sailboat and has stated
the differences between the stability derivative approach and solving the non-linear EOM. During
calculations of the stability derivatives, several assumptions were made to reduce the order of the
equations, thereby reducing the accuracy of the method. Hence, Bagué et al (2021) used CFD to
compute the stability derivatives for a foiling catamaran rather than the semi-empirical methods used
by Masuyama. Though the stability derivatives provide data regarding the stability of the boat,
dynamic simulations like disturbances and manoeuvring could not be studied.

A much more solid approach than using stability derivatives is to use a DVPP, which solves the EOM
at each time step. 6 DOF dynamic simulations of aircraft have been studied extensively (Caughy,
2011) and it lays the foundation for the DVPP design for foiling sailboats. However, the dynamics of
the sailboats are much more complicated than for an aircraft, due to the asymmetry of the boat and
the variable CG of the system caused by the movement of the sailors. See Heppel (2015) for a
comparison of the differences between aircraft and sailboat dynamics. Several DVPPs have been
developed to analyse foiling sailing yachts in a numerical environment and optimize foil
arrangements and sailing strategies. Hansen et al (2019) developed and used a DVPP with FS-
equilibrium to optimize manoeuvres for the America's cup AC50 class. Eggert et al (2020) applied
the FS-equilibrium DVPP to the foiling international Moth class.

In this paper, a new DVPP is developed to study the effectiveness of the split-flaps. The DVPP is a
further development of a static VPP developed by Andersson et al (2018) in connection with the
design of the foiling Optimist. During the design of foils for the test case, a static VPP was used for

 8
estimating the optimal foil dimensions for foiling at the lowest True Wind Speed. The static VPP uses
the same force models as the DVPP disregarding the dynamic effects. However, instead of solving
for accelerations in each DOF, the state variables (speed, height, leeway etc.) are iterated until
equilibrium is achieved in all DOFs.

4.2 Dynamics

Newton’s second law of motion, which equates force as the mass times acceleration is the base
equation used in the DVPP. It is only valid in an inertial frame of reference (non-accelerating and
non-rotating) which is not the case for the sailboat. An inertial frame of reference would be a
coordinate system fixed on earth (O in figure 8), however, calculating the forces and moments on
the boat in earth fixed coordinates will be too complicated. Hence, all forces, moments, and motions
are estimated through the centre of gravity of the body. The equations of motion through CG are
given by equations 1 and 2.

 = ∗ ( ̇ + × ) (1)

 Downloaded from http://onepetro.org/JST/article-pdf/7/01/1/2529231/sname-jst-2022-01.pdf by guest on 25 June 2022
 = ∗ ̇ + × ∗ (2)
Where, ∗ = + , and is the total mass of the boat, and is the added mass matrix in the
respective DOFs. ∗ = + , and is the mass moment of inertia along the axis of rotations and
 is the added inertia. and are the net force and moment residuals respectively, and are
the linear and angular velocities, with their respective accelerations ̇ and ̇ .
For aircraft, the CG is almost always fixed in the body of the aircraft, and equations 1 and 2 could
be applied without any changes. In the case of sailboats, the CG is varying due to the motion of the
sailors, and computing the motions through a variable point in the body is resource-consuming. The
net centre of gravity of the boat and sailors is shown as point A in figure 8. Point G is fixed on the
boat at the centre of gravity of the rigged hull without the sailors. Fixing the body coordinates in point
G would be convenient to calculate the force and moment residuals. Horel (2019) assumed the
distance between the net CG and G to be zero and modelled the effect of the sailors as an external
force. This assumption could hold well for large craft with the mass of the boat several times the
mass of the sailors.

For smaller craft, such as Linnea, the boat mass is similar to the sailor’s mass and the effect of the
variable CG will be significant. Hence the assumption made by Horel (2019) would be too
approximate for this case. The effect of the variable CG has been taken into account by Kerdraon et
al (2020), such that the distance between G and A is non-zero. Equations 1 and 2 are modified to
account for this. Bacon and Gregory (2007) derived the equations for a damaged asymmetric aircraft
through an arbitrary point different from the CG of the aircraft (equations 3 and 4). As individual
components, equations 3 and 4 are available in Kerdraon et al (2020)

 = ∗ ( ̇ + × ) + ̇ × ∗ + × ( × ∗ ) (3)
 = ∗ ̇ + × ∗ + ∗ × ̇ + ∗ × ( × ) + ∗ × ( × ) (4)
Where is the distance between G and A. Forces and moments are calculated through the body-
fixed coordinate system at G.
Solving equations 3 and 4 gives the linear and angular velocities of the boat in the body-fixed
coordinates. The orientation of the boat with respect to the earth fixed coordinate system is estimated
by rotating the angular accelerations with the rotation matrices in equation 5.

 1 sin tan cos tan ̇
 0 cos −
 [ ] = [ ̇ ] (5)
 sin cos
 0 ̇
 cos cos

 9
Downloaded from http://onepetro.org/JST/article-pdf/7/01/1/2529231/sname-jst-2022-01.pdf by guest on 25 June 2022
 Figure 8. The coordinate system of the boat

Here the Euler angles , , and are the roll, pitch, and yaw angles of the boat with respect to the
earth fixed coordinates. Equations 3, 4, and 5 are solved using the ode45 function in MATLAB
(2020), which is an ordinary differential equation solver. The inputs to the solver are the rates of
velocities in each DOF and the outputs are the velocities in the respective DOFs. It is not
straightforward to estimate the rates of the velocities from equations 3 and 4 due to the non -linear
coupling of the rotational accelerations in the linear acceleration equations and vice versa. Shampine
et al (2003) suggest rearranging equations 3 and 4 as,

 ∗ = (6)

 is a column matrix containing the six derivatives of the velocities, namely ̇ and ̇ . is termed as
a mass matrix and is the remaining terms of equations 3 and 4. If is a non-singular matrix,
equation 6 can be solved as,

 = −1 ∗ (7)

The derivatives in matrix can now be solved using MATLAB ode45.

4.2.1 Added Mass

While accelerating a body through a fluid, the surrounding fluid would also be accelerated
contributing to the mass of the body as an added virtual mass, and the corresponding inertia is
termed as added inertia. The added mass and added inertia for the hull are neglected as the added
mass for the foils and appendages is significantly larger (Faltinsen, 2005). Added mass and inertias
for unit chord length for the appendages are calculated using a strip-theory approximation for a flat
plate (equation 8), Eggert et al (2020).

 1
 22 = 2 66 = (8)
 8 4

where 2 is the strip width of the appendage, 22 and 66 are the added mass in vertical and
rotational accelerations, respectively. The same approach is followed for calculating the added mass
of the sails

 10
4.2.2 Damping

Damping due to the foils and appendages is modelled as the quasi-static change in the angle of
attack ( ) of the flow to the appendages and sails (equation 9). When the boat moves upwards, the
foil experiences a downward flow, thereby reducing the angle of attack and the lift produced (Eggert
et al 2020). The opposite happens when the boat moves down. For roll-damping, when the boat rolls
to port, the port side moves down and faces an upward flow, increasing the angle of attack and the
lift force on the port side. The appendages are split into chord-wise strips and the instantaneous flow
angle and velocity at the strips are estimated. Using the instantaneous , the forces on each strip
are calculated, which are added to other strips span-wise to obtain the total forces on the
appendages.

 = −1 ( ) (9)

 is the vertical velocity and is the horizontal velocity. Damping due to the sails is also accounted

 Downloaded from http://onepetro.org/JST/article-pdf/7/01/1/2529231/sname-jst-2022-01.pdf by guest on 25 June 2022
as the change in the instantaneous angle of attack of sails due to the boat motions.

4.3 Force Models

Forces in the DVPP are computed with a combination of semi-empirical models and CFD results. At
each time step, the forces from each component are calculated based on the state variables, and
the net forces and moments are summed up.

4.3.1 Sail Model

The sail set of Linnea consists of the Mainsail and a jib for upwind sailing and an additional Jib0 for
downwind sailing. Sails are modelled using the VPP guide by the Offshore Racing Congress (ORC
VPP Documentation, 2019). Sail depowering is achieved by the use of two parameters: flat and reef.
Flat determines the lift coefficient of the sails and reef determines the area of the sails. For better
performance, the reef is not reduced until the minimum value of the flat parameter is achieved, and
depowering is done only after the sailors are fully out on the racks.

4.3.2 Hull Model

Acerbi et al (2017) carried out CFD tests on Linnea’s hull for different speeds which were available
to be implemented in the DVPP. The change of frictional hull resistance with the draft of the boat is
assumed to be proportional to the wetted surface area. Based on the Delft systematic yacht series,
the change in wave-making resistance is assumed to be proportional to the change in displacement
(Gerritsma et al, 1981). The mass and moment of inertia of the hull were obtained by weighing the
hull and through a swing test. Inertias due to the rigging and other small components are estimated
using inertia formulae for simple geometries, adding it together with Huygens–Steiner theorem.

4.3.3 Foil Model

Foils and the appendages are modelled using the Lanchester–Prandtl lifting line theory. For elliptical
loading and sufficiently high aspect ratio (AR) the following formulas hold

 ,2
 ,3 = (10)
 2
 1 +

 2
 ,3
 , = (11)

 11
Almost elliptical loading is obtained with a taper ratio (TR) of 0.45. For an aspect ratio of around 8
the induced drag from equation 11 is then accurate within 1% (Larsson et al, 2014)

Simulations from X-Foil (Drela and Youngren, 2013) provided the 2-dimensional force coefficients
for the appendage sections as a function of the angle of attack, the flap angle, and the Reynolds
number. Figure 9 shows the computed 2D lift coefficients as a function of flap angle and angle of
attack.

 Downloaded from http://onepetro.org/JST/article-pdf/7/01/1/2529231/sname-jst-2022-01.pdf by guest on 25 June 2022
 Figure 9. 2D Lift coefficient vs flap angle for different angles of attack

Equations 10 and 11 are based on the effective aspect ratio, , which is the geometric AR of the
wing if the wing has two free tips in the flow. If one end of the wing is fixed such that no overflow is
possible, is twice the geometric AR.

In case of the split TE flaps at different deflection angles, since the loading on the starboard and port
sides are different, each side is treated as a separate wing with half the span. If there had been an
infinitely large plate in the symmetry plane between the two wings halves, the would be doubled
for each half-wing and the effect the same as having a full wing (figure 10). In practice, there is an
overflow between the two flaps at different deflections, so the increase in would be smaller.
Treating the interface as a free tip would reduce the to the actual geometric AR of the half-wing.
To obtain a more exact , CFD computations were carried out, as reported in section 5.

 Figure 10. Port and starboard foil considered as separate wings with a symmetry plane on
 the centreline

 12
As the foil approaches the free surface, the negative pressure on the upper part of the foil interacts
with the free surface, thereby deforming it (Hoerner and Borst, 1975). The deformation of the free
surface reduces the negative pressure on the suction side of the foil, thereby reducing the lift
coefficient. Faltinsen (2005) has determined the loss of lift coefficient as a function of the
submergence Froude number and foil chord. Figure 11 shows the variation of the 2D lift coefficient
with the submergence compared to the at infinite depth for the Wortmann FX60100.

 Downloaded from http://onepetro.org/JST/article-pdf/7/01/1/2529231/sname-jst-2022-01.pdf by guest on 25 June 2022
 Figure 11. 2D lift coefficient as a function of foil submergence

With the foils close to the free surface, there is also an increase in the induced drag. Due to the finite
span of the foils, the fluid dynamic properties of the foil close to the free surface are similar to that of
the lower wing of a biplane (Hoerner, 1957). The is multiplied by a factor of K, computed by
Hoerner (figure 12), which takes a value between 1 and 2 for the biplane wings for T-foils. For a box
plane, the K factor is much lower between 0.5 and 2, significantly reducing induced drag.

 Figure 12. Induced resistance factor K as a function of submergence ratio (Hoerner, 1957)

 13
4.4 Control System Design

Control systems are modelled as response equations that return the flap angle ( ) as a function of
the state variables: ride height (ℎ) and heel (φ). Ride height is the displacement of the yacht in the
body coordinate system (a measure of the displacement of the wand).

4.4.1 Two-Wand System (AHSS)

The two-wand system is designed to automatically adjust the port and starboard flap angle based
on the ride height and heel angle of the boat. With a single wand, a response curve would be as in
equation 12. The response of the flap angle to the change in height, i.e., the slope of the ride height
vs flap angle curve, termed as a gain coefficient (GC), is quite critical to ensure a stable ride. A low
slope system would be less sensitive to disturbances, but it would reduce the flaps at a lower rate
with the ℎ. This would result in a higher ℎ at equilibrium. Whereas a high slope system would reduce
the flap angle rapidly with ride height and result in a lower hull clearance, with high sensitivity to
disturbances. ℎ is negative upwards in the body coordinate system.

 Downloaded from http://onepetro.org/JST/article-pdf/7/01/1/2529231/sname-jst-2022-01.pdf by guest on 25 June 2022
 ℎ
 = ∗ + (12)
 0.681

In the two-wand system, the heel angle is implicitly measured as the difference in ride height at the
port and starboard extremes (where the wands are located). Equation 12 is applied for each wand,
with ℎ being the height measured at the respective wandThe flap angles at port and starboard,
and , are given by equations 13 and 14, where is the maximum beam of the yacht. The response
equations are linear since the variation of lift coefficient with the flap angle is linear (figure 9) for this
foil. Linear response curves will ensure that the total ,2 is kept constant when heeling, since the
loss on one side is the same as the gain on the other side. φ is negative with a starboard heel.

 (ℎ − ∗ 0.5 ∗ tan(φ))
 = ∗ + (13)
 0.681

 (ℎ + ∗ 0.5 ∗ tan(φ))
 = ∗ + (14)
 0.681

The gain coefficient (GC) in equations 13 and 14 determines both the height- and heel-response of
the control system because heel cannot be directly measured with the two-wand system. If GC is
increased, the difference in the flap angles for a given heel angle is increased, thereby producing a
larger righting moment. However, the response to a change in ride height would also be larger and
it could result in a lower stable ride height. Sensitivity to the GC is studied in section 6.1.

The optimal initial flap angle ( ) when the hull is fully submerged is also critical in determining the
take-off speed of the boat. A high initial angle would generate a high lift at the cost of increased
profile and induced drag. Thus, the optimal value for the lowest take-off TWS was found to be +5
degrees using the static VPP.

4.4.2 Performance Control – Manual Offset System

For producing a manual offset the same response curves in equations 13 and 14 are used with an
additional term. The is controlled by the sailors during the race, increasing the offset
to produce an additional righting moment.

 (ℎ − ∗ 0.5 ∗ tan(φ))
 = ∗ + + (15)
 0.681

 14
(ℎ + ∗ 0.5 ∗ tan(φ))
 = ∗ + − (16)
 0.681

4.5 Sailor Model

To run dynamic simulations, automated PID controllers are modelled to reflect practical sailing by
adjusting the Transverse Centre of Gravity (TCG) of the sailors and the and of the sails.
The rate of change of these variables is dependent on multiple parameters such as the heel angle
( ), roll angular velocity ( ), and force on the sails (equations 17, 18, and 19).

 ∆ = ( 11 − 12 − 13 ) (17)

 ∆ = ( 21 − 22 − 23 ) (18)

 Downloaded from http://onepetro.org/JST/article-pdf/7/01/1/2529231/sname-jst-2022-01.pdf by guest on 25 June 2022
 ∆ = ( 31 − 32 − 33 ) (19)

The coefficients are optimized for ideal sailing conditions by an iterative process using the DVPP.
Till the sailors are fully out on the racks, ∆ and ∆ are set to zero. is the sailor response
coefficient and is a measure of the effectiveness of the sailors to react to a disturbance.

5. CFD STUDY OF THE INDUCED DRAG DUE TO THE SPLIT FLAPS

As explained in section 4.3.3, the split flaps generate additional induced resistance. Looking at this
in more detail, while heeling to starboard, the two flaps are set at different angles as shown in figure
1 with a higher flap angle on the starboard side. This implies that the ,2 will be higher on the
starboard side of the foil than the port side. In such conditions, due to the space between the two
flaps in the middle, additional vortices will develop, leading to increased drag. Due to the higher
loading on the starboard side, the tip vortex will be much stronger than the port side. The flow in the
space between the flaps is complicated as it facilitates a partial overflow from the pressure side to
the suction side. On the starboard side, the overflow will be much stronger due to the higher wing
loading. Whereas, on the port side, the overflow will be weaker or even in the opposite direction if
the ,2 is negative.

The above effects were studied with numerical RANS simulations to correct the . Friendship
Systems CAESES (2019) was used to make the CAD model of the foils and Star CCM + (2018) was
used to carry out the CFD simulations. The − turbulence model was used with the foils in a
double body setup. Numerical verification was done using the foil of an A-Class catamaran and
comparing it against experimental results from Keller et al (2017).

The simulations were carried out at a constant speed of 5 m/s by setting the difference between the
flap angles ( ) as the critical parameter. was varied from 0 to 4, 8, 12, and 16 degrees as
in table 1.

 = | − | (20)

Empirical results are made with the assumption that the for the half wing is doubled, and hence
might underpredict the induced drag. As the friction drag is not of concern in this study, only the drag
due to the pressure effects are considered. The total pressure drag in the empirical method is
estimated as the sum of the profile pressure drag and lift induced drag. The results from the
numerical simulations are compared with empirical estimations in Table 1 and Figure 13. The black
dashed curve represents the CFD results for symmetrically deflected flaps, i.e., where the starboard

 15
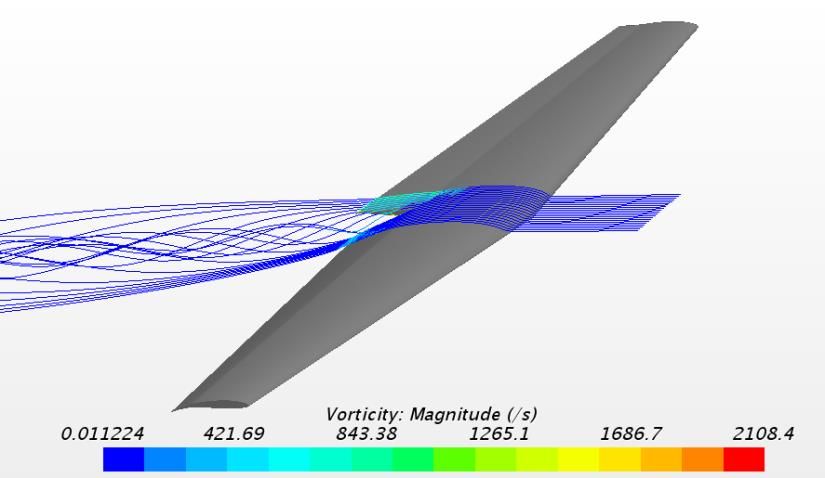
and port flaps are displaced equally much from 0, but in different directions and the red curve
represents the empirical model. The yellow curve includes a correction to the empirical method, such
that the empirical formula fits the CFD results as well as possible.

This correction is added to the DVPP to account for the increased resistance due to the split-
flaps. The correction factor ( ) on the aspect ratio is given by the equations 21 and 22. Note that
this correction is derived from the symmetric displacement of the flaps. To cover also asymmetric
deflection more CFD results are required, and this is a matter for further study.

 = 1.9338 ∗ − 2.0332 (21)

 = ∗ (1 − ) (22)
 100

Table 1. Comparison of the empirical and numerical pressure drag for flap differentials of 0,
 4, 8, 12, and 16 degrees.

 Downloaded from http://onepetro.org/JST/article-pdf/7/01/1/2529231/sname-jst-2022-01.pdf by guest on 25 June 2022
 Empirical Empirical
 Flap
 Pressure Drag (N) Pressure Drag (N) CFD Pressure
 Difference fP fS
 without AR with AR Drag(N)
 (deg)
 correction correction
 0 0 0 63 63 64
 4 -2 2 68 70 70
 8 -4 4 84 90 90
 12 -6 6 108 121 122
 16 -8 8 142 166 169

 Figure 13. Pressure drag force vs flap angle difference for empirical and CFD estimations

Figure 14 shows streamlines in the space between the two flaps with a of 16 degrees. From
Figure 14, it can be seen that there is an additional vortex developed at the space between the flaps,
which contributes to the discrepancy between the CFD and empirical methods. The difference in the
pressure distribution between the starboard and port sides due to the can be seen in figure 15.

 16
Figure 14 streamlines the interface between the split flaps

 Downloaded from http://onepetro.org/JST/article-pdf/7/01/1/2529231/sname-jst-2022-01.pdf by guest on 25 June 2022
 Figure 15. Pressure contours on the pressure side (top figure) and suction side (bottom
figure) with the starboard flaps (right) set at +8 degrees and port flaps (left) set at -8 degrees

To study the interaction effects in detail, two additional simulations were carried out with the
starboard flap set at 0 degrees and the port flap set at -3 degrees and -10.7 degrees. Flap angle of
-3 degrees and -10.7 degrees has a ,2 of 0.2866 and -0.2866 respectively. Theoretically, the
induced drag is proportional to 2 and hence the empirical , should be the same for both cases.
The results from the numerical and empirical simulations are given in table 2.

From table 2, due to the discrepancy between the empirical and numerical methods, it is seen that
there is a strong interference effect between the two sides when the port and starboard flaps are set
at 0 and -10.7 degrees, respectively. Figures 16 and 17 show the velocity vectors on the transverse
plane at the trailing edge of the foil viewed from behind for case 1 and case 2, respectively. The plots
are enlarged closer to the space between the two flaps.

 17
Table 2. Comparison of the empirical and numerical pressure drag for a starboard flap of 0
 degrees and a port flap at -3 and -10.7 degrees.

 Case 1 2
 Starboard Flap (deg) 0 0

 Port Flap (deg) -3 -10.7
 Empirical Pressure
 44 54
 Drag (N)
 Numerical Pressure
 46 61
 Drag (N)
 Empirical Lift (N) 2444 657

 Numerical Lift (N) 2404 565

 Downloaded from http://onepetro.org/JST/article-pdf/7/01/1/2529231/sname-jst-2022-01.pdf by guest on 25 June 2022
In case 1, there was no strong vortex formation in the space between the flaps (figure 16). There is
a lack of space for vortex formation as each flap hinders the overflow from the other flap to some
extent. Also, both flaps are loaded positively with pressure on the bottom and suction on the top.
Thus, on the starboard side, the overflow from pressure to suction side would tend to roll clockwise
in the space between the flaps. On the port side, the overflow tends to roll in the counterclockwise
direction. These two flows seem to oppose each other and could hinder the formation of a stronger
vortex.

 Figure 16. Velocity vectors at the Trailing Edge of the foil with starboard flap at 0 degrees
 and port flap at -3 degrees (case 1) – viewed from behind

In case 2 (figure 17), the vortex in the space between the flaps is much stronger than in case 1. The
space between the flaps is larger due to the large , aiding is unhindered vortex formation. Since
the loading on the port side is negative i.e., high pressure on the top and low pressure on the bottom
due to the negative lift coefficient, the overflow on the port side will roll up clockwise in the space
between the flaps. The starboard overflow also rolls clockwise due to the positive loading, and these
two flows seem to complement each other, contributing to a stronger vortex in the space between
the flaps.

 18
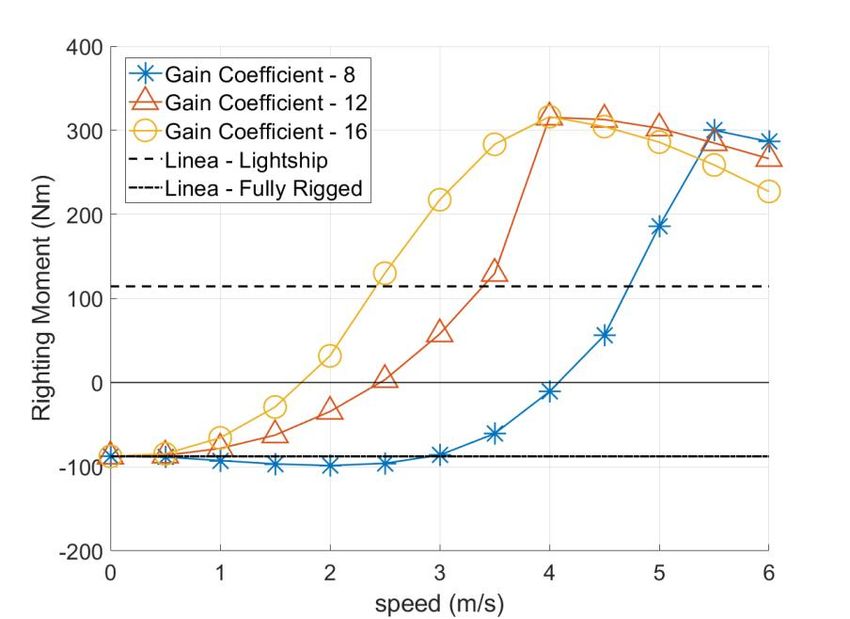
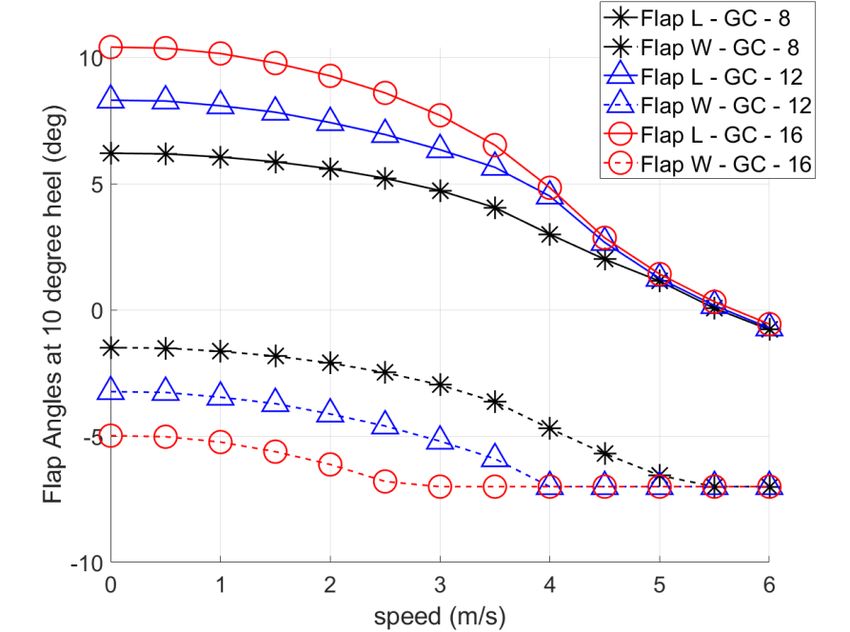
Figure 17. Velocity vectors at the Trailing Edge of the foil with starboard flaps at 0 degrees
 and port flaps at -10.7 deg (case 2) – viewed from behind

 Downloaded from http://onepetro.org/JST/article-pdf/7/01/1/2529231/sname-jst-2022-01.pdf by guest on 25 June 2022
Though in both cases the starboard flap is at the same angle, the pressure below the flap has been
significantly reduced in case 2 due to the stronger vortex. This contributes to a reduction in the lift
coefficient as well. The correlation error between the numerical and empirical estimations for case 2
is significantly larger than for case 1 and all other simulations represented in table 1. The errors in
the pressure drag and lift estimations are 12.9 % and -14.0 % respectively.

The case with +8 starboard and -8 port flaps has an error of 1.7 % on the pressure drag. Though the
 here is larger than case 2, the correlation is better. This could be attributed to the fact that a
port flap of -8 degrees corresponds to an approximately zero (slightly negative) lift coefficient. The
starboard flap at 8 degrees has a positive lift coefficient and would produce a vortex that rolls up
clockwise in the space between the flaps. There would be no significant vortex formed from the port
side and thus no complimentary effect to the clockwise port flap vortex. Therefore, it could be inferred
that it is not only the difference between the flap angles ( ) but also the loading patterns of the
two flaps, which is critical in increasing the pressure drag. As observed from the studies, a negative
loading on one of the flaps strengthens the vortex in the space between the flaps and a non-negative
loading on both the flaps tends to weaken the vortex.

6. RESULTS

6.1 Increase in Righting Moment due to the Split-Flaps

In the case of the AHSS, the gain coefficient (GC) determines both the heel and ride height stability
(Equations 13 and 14), with a higher GC a large response to a given change in height and heel,
reducing the ride height (ℎ) and increasing the Righting Moment (RM). With a constant , the
righting moment is proportional to the square of the boat speed. Figure 18 shows the righting
moments for a GC of 8, 12, and 16, respectively at a leeward heel of 10 degrees as a function of
boat speed. The righting moment of the fully displaced hull is also shown in figure 18. Over a large
part of the speed range, the foil-supported boat has a higher RM than the displacement boat when
a gain coefficient of 12 is used. With a gain coefficient of 16, the RM is higher than the displacement
boat for the entire range of speeds.

The reduction of RM at higher speeds in figure 18 is attributed to the negative limit of -7 degrees on
the flap angle. At high ℎ or high heels, one or both the TE flaps can reach the minimum limit. Figure
19 shows the flap angles at each speed for the different GC at a heel of 10 degrees to leeward. With
a high GC, the net flap angle is lower than with a lower GC at the same ℎ. Heeling with an already
low net flap angle reduces the windward side’s flap angle even further and it reaches the negative
limit of -7 degrees rapidly. Heeling further will increase the righting moment at a lower rate as the

 19
windward flap is locked at -7 degrees and only the leeward flap increases. If the speed increases in
such a case, the net ℎ increases, thereby decreasing the net flap angle. As the windward side is
already set at -7 degrees, only the leeward side can be decreased, thereby decreasing the difference
between the flap angles. This explains the reduction of RM at high speeds and high GC.

 Downloaded from http://onepetro.org/JST/article-pdf/7/01/1/2529231/sname-jst-2022-01.pdf by guest on 25 June 2022
 Figure 18. Righting Moment of Linnea due to the foils for a draft of 1.0 m and gain
 coefficients of 8, 12, and 16 and a heel of 10 degrees to leeward

Figure 19. Flap angles versus speed with the different gain coefficients of 8, 12, and 16 at a
 heel angle of 10 degrees to leeward

 20
The above issue could be resolved by removing the negative limit on the flap angle. This solution
would result in two complications. One would be that the windward side will be producing negative
lift, which is a loss of efficiency. The two sides would then generate forces in the opposite directions
and the total lift induced resistance would be large. Another effect is that a high righting moment will
increase the load on the rigging. To manage the high loads, the rigging strength would have to be
increased, leading to a higher weight, moving the CG upwards. A higher CG would increase the
heeling moment, possibly negating the increased RM from the split-flap system. For these reasons,
the negative limit is retained.

6.2 Effectiveness of the Stability Control System

The effectiveness of the AHSS is studied using gust simulations (increase in the True Wind Speed,
TWS) keeping the True Wind Angle (TWA) constant. Equilibrium conditions are estimated using the
DVPP at a TWS of 3.5 m/s and a TWA of 60 degrees. As Linnea is designed for lighter winds, foiling
is achieved at such low wind speeds. Two gust scenarios are simulated: a lighter gust for a long
duration and a stronger gust for a short duration. Figure 20 shows the TWS as a function of time for

 Downloaded from http://onepetro.org/JST/article-pdf/7/01/1/2529231/sname-jst-2022-01.pdf by guest on 25 June 2022
the two gust scenarios.

 Figure 20. Gust scenarios simulated using the DVPP

The heel response of the boat to the lighter gust (case 1) in degrees is shown in figure 21. A negative
heel represents a heel to starboard (leeward side). As the TWS increases, the boat starts to heel to
leeward due to the increased heeling moment of the sails, and as the gust is reduced the boat reverts
back to its original sailing state. The boat without the split flaps heels much more than the boat with
AHSS. Increasing the gain coefficient significantly reduces the heeling angle during the gust and
returns the system to equilibrium quicker. Oscillations in the curves are due to the sailor control
system.

 21
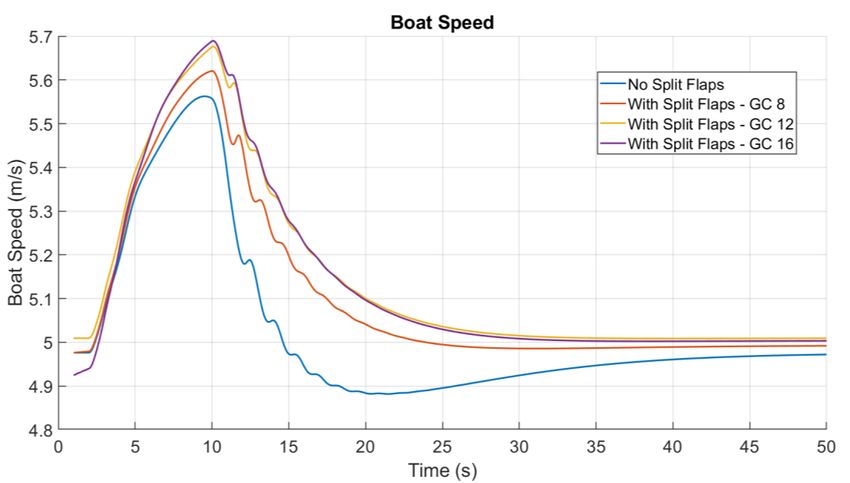
Downloaded from http://onepetro.org/JST/article-pdf/7/01/1/2529231/sname-jst-2022-01.pdf by guest on 25 June 2022
 Figure 21. Heel angle of the boat during the lighter gust (gust case 1)

In a stronger gust (case 2), the boat naturally heels more. See figure 22. The boat without AHSS
capsizes under the heavy load on the sails. With the AHSS, the boat does not capsize and can return
to the equilibrium state after the disturbance is removed. A gain coefficient of 8 of the AHSS limits
the heel to leeward to 14 degrees during a strong gust. Increasing the GC to 16, the heel angle is
limited to just 3.75 degrees. It could be inferred that, with the two-wand system, the AHSS is capable
of stabilising the system considerably during gusts.

 Figure 22. Heel angle of the boat during the stronger gust (case 2)

Figures 23 and 24 show the boat speed during the gust scenarios. During the race, it is instrumental
to minimize speed loss. With the TWS increase, boat speed increases, and once the disturbance is
removed, there is a drop in boat speed. With the AHSS, the boat returns to the original sailing state
without any significant loss of boat speed after the disturbance is removed. The AHSS boat
experiences a relative increase in the boat speed attained during the light gust compared to the boat
without the split flaps (figure 23).

 22
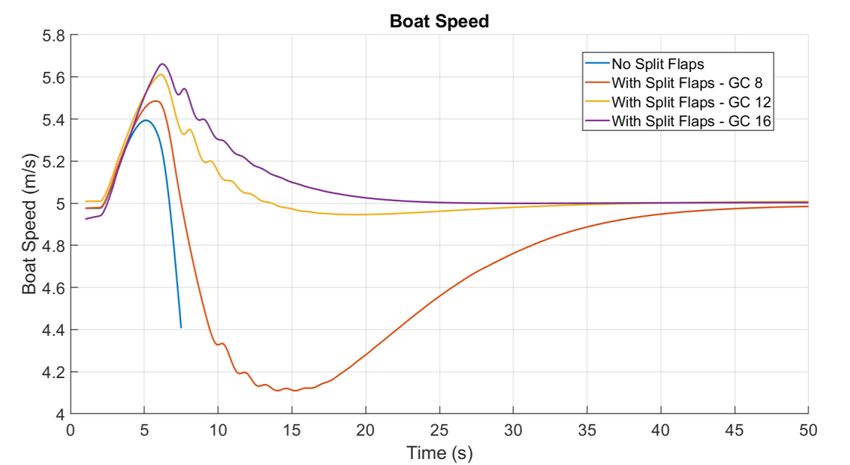
Downloaded from http://onepetro.org/JST/article-pdf/7/01/1/2529231/sname-jst-2022-01.pdf by guest on 25 June 2022
 Figure 23. Boat Speed during the lighter gust (case 1)

In the case of a stronger gust (case 2), the AHSS with a GC of 8 experiences a significant speed
drop after the gust. With larger GC: 12 and 16, the drop in speed is significantly reduced, which also
provides a performance advantage amid the race (figure 24) along with increased stability.

 Figure 24. Boat Speed during the stronger gust (case 2)

Using a GC of 8, the boat heels significantly with a strong gust. Although it performs better than the
boat without the split flaps, the large heel might be challenging for the crew to tackle. Hence it might
be better to use higher gain coefficients greater than 8. With a GC of 16, the boat is very stable in
gusts and does not lose speed due to disturbances. However, since the two-wand system is used
here, a higher GC will have an impact on the ride height. As seen in figure 25, the stable ride height
of the boat with the higher GC is significantly lower than with a GC of 8. The black dashed line
represents the ride height at which the lowest part of the hull leaves the water surface. Thus, with a
GC of 16, the hull clearance is around just 4 cm, which could be sensitive to the impact of waves.

 23
The reduction of ride height is a consequence of using the two-wand control system as a higher GC
reduces the flap angle at a higher rate for an increase in the ride height. This drawback of the two-
wand system limits the usage of higher GC and thereby reduces the stability of the boat.

 Downloaded from http://onepetro.org/JST/article-pdf/7/01/1/2529231/sname-jst-2022-01.pdf by guest on 25 June 2022
 Figure 25. Ride Height during the stronger gust (case 2)

6.2.1 Decoupled Ride Height-Heel

To effectively increase the righting moment without affecting the ride height, the heel and height
measures need to be separated and the flaps should be adjusted accordingly with different gains.
Mathematically such a system would behave according to equations 23 and 24, which are modified
from equations 15 and 16, separating height and heel angle , adjusting them proportional to
 ℎ ℎ and ℎ respectively.

 ℎ ℎ ∗ ℎ − ℎ ∗
 = + + (23)
 0.681

 ℎ ℎ ∗ ℎ + ℎ ∗
 = + + (24)
 0.681

Such a system measures the heel angle explicitly, allowing for a higher gain on the heel without
compromising the height response. By increasing ℎ to 16 while retaining ℎ ℎ at 8, the heel
stability of the boat could be significantly increased without reducing the ride height. Figure 26 shows
the ride height of the boat with the decoupled ride height-heel system during the stronger gust (case
2). The system with ℎ ℎ = 8 and ℎ = 8 behaves similar to the two-wand system, which is
expected according to equations 23 and 24. By only increasing the ℎ , the heel stability of the
boat can be increased significantly. As seen in figure 26, the stable ride height is the same for all the
plots as the value of ℎ ℎ remains unchanged. Thereby increasing the heel stability without
affecting the ride height of the boat.

 24
Downloaded from http://onepetro.org/JST/article-pdf/7/01/1/2529231/sname-jst-2022-01.pdf by guest on 25 June 2022
 Figure 26. Ride Height during the stronger gust (case 2) with the decoupled system

The decoupled control could be achieved with electrical sensors and computers that could split the
heel and height signals, and proportionally adjust the flaps. However, many classes including the R3
class rules prohibit the use of stored power onboard, limiting the use of electronics. Hence a
mechanical system that could decouple the ride height and heel system has been developed and is
presented in section 7.

6.3 Effectiveness of the Manual Offset System

Heeling windward increases the righting moment due to the gravity forces, which allows to power
the sails more, resulting in a faster boat (figure 27). The AHSS, which automatically adjusts the flap
angles with the heel angle, will oppose heeling to windward by increasing the windward flaps and
producing an additional heeling moment. The manual offset system introduces an parameter
in the control system. By increasing the value, the windward flap angle can be decreased,
increasing the leeward flap angle by the same amount. Thereby, the effects of the AHSS are negated
and the foil could create a righting moment towards windward despite the windward heel.

Figure 27 shows the boat speed from rest to compare the efficiency of the offset system during a
windward heel of 10 degrees. It can be seen in figure 27 that the AHSS reduces the boat speed with
a windward heel due to the heeling moment produced (sails would be depowered). By increasing
the to 2.2 degrees, the effects of the AHSS will be neglected and the difference between flap
angles will be zero. With an of 4.2 degrees, of 4 degrees, the boat speed with AHSS is
increased relative to the boat without the split-flaps. Further increasing it to 6.2 degrees, the boat
becomes even faster (figure 27) despite the increase in induced resistance.

With the manual offset system, one of the drawbacks of the AHSS that is the inability to sail with a
windward heel could be negated. The system now has a performance advantage and increased heel
stability due to the AHSS with the manual offset.

 25
Downloaded from http://onepetro.org/JST/article-pdf/7/01/1/2529231/sname-jst-2022-01.pdf by guest on 25 June 2022
 Figure 27. The performance advantage of the manual offset system

7. DECOUPLED RIDE HEIGHT-HEEL MECHANICAL CONTROL SYSTEM FOR SPLIT FLAPS

The dual wand control system presented above compounds ride height and heel in a composite
signal, meaning that the same gain will be applied to both. If the ride height and heel instead could
be measured as separate signals, in a decoupled fashion, individual gains can be applied to the ride
height and heel signals, potentially improving the performance of the control system and the boat.

In this work, a mechanical system that allows the ride height and heel signals to be separated has
been devised. The system consists of a measurement system, which measures ride height and heel
separately, and a control cam system which applies individual control laws to the two signals and
output individual port-starboard flap deflection angles.

The system uses two rigidly connected wands, positioned in an inverted-V shape. Similar to the
control systems typically used on in the International Moth Class, the wands are connected to a cam,
and allowed to rotate around a transverse axis at the end of the bowsprit, see Fig. 28, point 1. This
translates the ride height measurement of the wands to a translation in a pushrod that runs along
the centre of the bowsprit, see Fig. 28, point 2.

 Figure 28. Decoupled control system response to change in ride height

The entire wand-cam assembly is also allowed to rotate around the longitudinal axis of the bowsprit,
in relation to the boat and bowsprit. The inverted-V configuration and resulting lateral separation of
the wand paddles mean that the wand assembly will remain aligned with the free surface as the boat
heels. In this way the heel of the boat is measured by the rotation of the wand-cam assembly, see
figure 29.

 26
Figure 29. Decoupled control system response to change in heel angle

 Downloaded from http://onepetro.org/JST/article-pdf/7/01/1/2529231/sname-jst-2022-01.pdf by guest on 25 June 2022
The forward end of the pushrod shaft is connected to the wand-cam assembly with splines, which
allows torque to be transferred while still allowing relative translation. In this way, the wands can
measure and transfer ride height and heel signals separately, as pushrod translation and rotation.

The control-cam assembly uses a globoid 3D cam to apply individual control laws to ride height and
heel signals, transforming these to individual port and starboard flap deflection signals. The globoid
cam can be described as a generalized cylinder, with varying cross-section. It is rigidly connected to
the end of the pushrod, rotating and translating with it. The change in diameter along the length of
the cam defines the control law for ride height, while the cross-section shape defines the control law
for heel. Two individual flap pushrod followers ride on the cam surface, transmitting the signal to
each flap. The response of the control-cam assembly to ride height and heel signals is shown in
Figures 30a and 30b.

 Figure 30. Control cam and flap pushrod followers– (a) Top view, response to ride height
 signal (b) Axial view, response to heel signal

From Figure 30a, it can be realized that a change in ride height, which leads to a longitudinal
translation of the 3D cam, results in an equal change in port-starboard flap angles, thus changing
the total lift produced by the foils without affecting righting moment. Note that, while the cam design
results in a linear response to ride height, arbitrary control laws could be implemented by changing
the cam shape.

From Figure 30b, it can be realized that a change in heel, which leads to rotation of the cam around
the longitudinal axis, will result in differential flap angle, increasing the flap angle on one side, while
reducing the other. With careful design of the cam shape, this means that righting moment can be
generated, without affecting total lift.

As shown in section 6.3, manual heel offset can provide increased performance. Such an offset
function can be added to this system, by rotating the 3D control cam in relation to the pushrod shaft.

 27
You can also read