Spatio-temporal estimation of basic and effective reproduction number of COVID-19 and post-lockdown transmissibility in Bangladesh
←
→
Page content transcription
If your browser does not render page correctly, please read the page content below
Spat. Inf. Res.
https://doi.org/10.1007/s41324-021-00409-2

Spatio-temporal estimation of basic and effective reproduction
number of COVID-19 and post-lockdown transmissibility
in Bangladesh
Al-Ekram Elahee Hridoy1 • Imrul Hasan Tipo2 • Md. Shamsudduha Sami3 • Md. Ripon Babu2 •
Md. Sayem Ahmed4 • Syed Masiur Rahman5 • Shekh Md. Shajid Hasan Tusher1 • Kazi Jihadur Rashid6                          •

Mohammad Naim7

Received: 20 March 2021 / Revised: 28 May 2021 / Accepted: 4 June 2021
 Korean Spatial Information Society 2021

Abstract The ongoing COVID-19 pandemic has caused                   seen from early February 2021. The basic reproduction
unprecedented public health concern in Bangladesh. This             number (R0) in Bangladesh probably varied around 2.02
study investigated the role of Non-Pharmaceutical Inter-            (1.33–3.28, 95% CI). This study finds a significant positive
ventions on COVID-19 transmission and post-lockdown                 correlation (r = 0.75) between population density and
scenarios of 64 administrative districts and the country as a       COVID-19 incidence and explaining 56% variation in
whole based on the spatiotemporal variations of effective           Bangladesh. The findings of this study are expected to
reproduction number (Rt) of COVID-19 incidences. The                support the policymakers to adopt appropriate measures for
daily confirmed COVID-19 data of Bangladesh and its                 curbing the COVID-19 transmission effectively.
administrative districts from March 8, 2020, to March 10,
2021, were used to estimate Rt. This study finds that the           Keywords Bangladesh  Basic reproduction number
maximum value of Rt reached 4.15 (3.43, 4.97, 95% CI) in            COVID-19  Effective reproduction number
late March 2020, which remained above 1 afterwards in               Epidemiology  Non-pharmaceutical Intervention  SARS-
most of the districts. Containment measures are moderately          CoV-2
effective in reducing transmission by 24.03%. The Rt was
established below 1 from early December 2020 for overall
Bangladesh and a gradual increase of Rt above 1 has been            1 Introduction

                                                                    The ongoing coronavirus disease (nCoV-19), caused by the
& Kazi Jihadur Rashid                                               SARS-CoV-2 strain, has caused unprecedented public
  jihadrashid.gis@gmail.com                                         health concern worldwide. The World Health Organization
1
    Department of Geography and Environmental Studies,
                                                                    (WHO) declared COVID-19 as a global pandemic on
    University of Chittagong, Chattogram 4331, Bangladesh           March 11, 2020. With the emergence of a novel infectious
2
    Department of Biochemistry and Molecular Biology,
                                                                    disease, various transmissibility metrics are used to quan-
    University of Chittagong, Chattogram 4331, Bangladesh           tify how infectious it is. Among various metrics, the basic
3
    Department of Geography and Environment, Jagannath
                                                                    reproduction number (R0) is most utilized and can track the
    University, Dhaka 1100, Bangladesh                              disease dynamics in an environment when everyone is
4
    Department of Pharmacy, East West University, Dhaka 1212,
                                                                    susceptible to the disease. R0 is regarded as an estimate of
    Bangladesh                                                      contagiousness that is a function of human behavior and
5
    Center for Environment & Water, Research Institute, King
                                                                    pathogens’ biological characteristics [1]. Researchers
    Fahd University of Petroleum & Minerals,                        across the world have exercised many models to assist
    KFUPM Box 713, Dhahran 31261, Saudi Arabia                      policymakers in fighting COVID-19. To assess the effec-
6
    Center for Environmental and Geographic Information             tiveness of containment measures and design non-phar-
    Services (CEGIS), Dhaka 1212, Bangladesh                        maceutical interventions (NPIs), accurate estimation of R0
7
    Department of Electrical and Computer Engineering, North        and Rt is of paramount importance.
    South University, Dhaka 1229, Bangladesh

                                                                                                                      123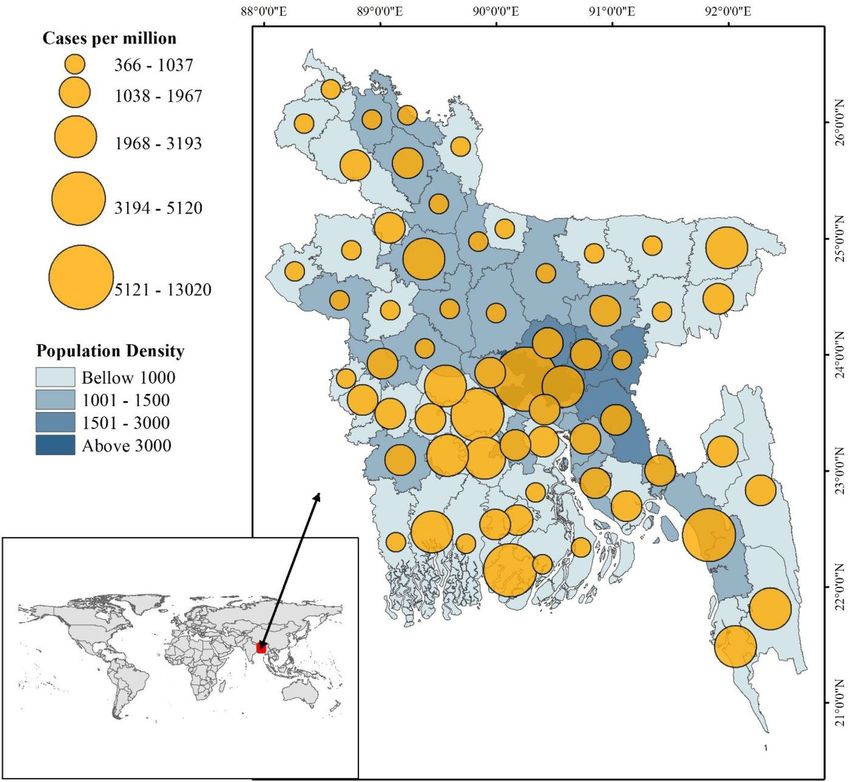
A.E. Hridoy et al.
The first confirmed case in Bangladesh was identified on help adjust and strengthen public health intervention
March 8 2020. In response to the outbreak, the Government schemes. We aimed to estimate a plausible in Bangladesh
of Bangladesh (GoB) has implemented various non-phar- for the early outbreak of COVID-19 using several serial
maceutical interventions (NPIs) to contain the transmis- intervals from other countries. In addition, we hypothe-
sion. Bangladesh has taken several types of containment sized that population density could be an influential factor
measures intending to reduce COVID-19 transmission. in spreading COVID-19 in Bangladesh. Thus, this study
These NPIs have been implemented with essential modi- also assessed the association between population density
fications, like whole country and zone-based. Only essen- and COVID-19. Since Bangladesh is in the midst of this
tial items have come under consideration from the group of COVID-19 outbreak, this study will highlight the impor-
containment and closure policies. Require closing (or work tance of the real-time monitoring of COVID-19 transmis-
from home) for some sectors or categories of workers, from sion and the necessity of containment measures to curb the
early May to mid-May for the entire country and require transmission effectively. This study might be an essential
closing (or work from home) for all-but-essential work- reference for advanced studies on the transmission pattern
places (e.g., grocery stores, doctors), from mid-May to late of SARS-CoV-2 across Bangladesh.
May for the whole country. In targeted places, these
measures were undertaken from mid-March to late March
and mid-July to early December. 2 Materials and method
However, there is an ongoing debate whether measures
have been adopted adequately and implemented efficiently 2.1 Data source
[2]. Lack of adequate NPIs, it can be assumed that the
COVID-19 pandemic will exacerbate in Bangladesh. It Daily data of confirmed COVID-19 cases in Bangladesh
remained fuzzy how adopted containment strategies were was included in this study from March 8, 2020, to March
effective in curtailing COVID-19 transmission. As Ban- 10, 2021. The COVID-19 data used in this study were
gladesh lifted lockdowns due to economic burden, it is retrieved from Johns Hopkins University’s GitHub repos-
unclear how SARS-CoV-2 transmission varied across the itory. The district-wise COVID-19 incidences were
country. Since the COVID-19 pandemic is still ongoing, retrieved from the online version of Institute of Epidemi-
relaxation of containment measures is accountable for ology Disease Control and Research (IEDCR). District-
weakening the foundation for control of infectious disease wise data is available from July 8 2020 to December 15
by declining caution and awareness [3]. 2020 [8]. The NPIs information was retrieved from Github
Bangladesh is one of the world’s most populous coun- repository Oxford Covid-19 Government Response
tries, with a high poverty rate and dense population, Tracker (OxCGRT). District-level population and popula-
implying greater COVID-19 exposure [4]. Jahangiri et al. tion density data has been retrieved from Bangladesh
[5] mentioned that transmission of COVID-19 has a high Bureau of Statistics (BBS) [9].
sensitivity to population size. Wong and Li [6] found that
population density is an effective predictor of COVID-19 2.2 Study area
cases in the USA and that places with high population
density levels are expected to have high cases. Moreover, Bangladesh is a riverine country located in (23.6850 N,
Rt varies with the social dynamics, and regional Rt esti- 90.3563 E) the south-eastern part of Asia, which shared a
mation may guide easing or imposing local control mea- border with India and Myanmar. It is one of the most
sures [7]. Therefore, given the urgency of the COVID-19 densely populated countries in the world with an average of
situation, this study aimed to assess the effectiveness of 964 inhabitants per square kilometer and 142,319 thousand
containment measures and estimate Rt for Bangladesh and population [9]. Whole country has been selected as a study
post-lockdown throughout the country. It is crucial to area, including administrative 8 divisions and 64 districts
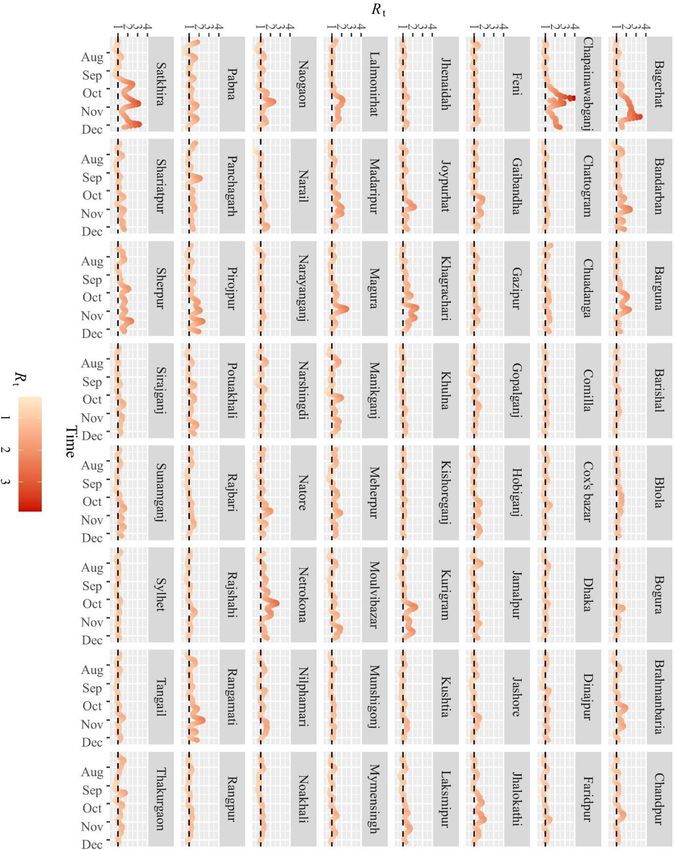
scrutinize and examine the dynamics of COVID-19 and the shown in Fig. 1.
necessity of evaluating different containment strategies to
gain a better overview of continuing conditions that might
123
Spatio-temporal estimation of basic and effective reproduction number of COVID-19 and…

Fig. 1 Study area map showing district-wise distribution COVID-19 cases and population density

2.3 Methods                                                               When various intervention measures are implemented to
                                                                      contain a disease transmission, the time-varying version of
2.3.1 Estimation of basic and effective reproduction                  the reproductive number Rt can be estimated. Similar to the
      number                                                          concept of R0, a Rt value over 1 indicates the disease is
                                                                      transmitting exponentially, whereas less than 1 indicates
R0 represents the average number of people infected by one            the transmission is decreasing. The R0 will not be constant
infectious individual [1]. If R0 is greater than 1, the number        over time because actions will be taken by policymakers
of infected people is likely to increase exponentially and            (i.e., lockdown and socio-behavioral factors). The time-
the epidemic will continue. If R0 is less than 1, the outbreak        varying variation of an epidemic can be estimated by the
is likely to die out on its progression course. The R0 is             effective reproduction number over time, Rt [11–13]. To
extensively used to evaluate how an epidemic will spread              estimate Rt, we utilized EpiEstim [12] in R software
through a population and design various non-pharmaceu-                environment. It is demonstrated that the method of Cori
tical interventions (NPIs) as exit strategies. The R0 is              [12] most accurately estimates the instantaneous repro-
estimated early phase of an outbreak when any NPIs are                ductive number in real-time since it assumes minimal
not adopted to control the transmission. This study utilized          assumption and uses only past data and minimal parametric
R0 package of R software [10] with Exponential Growth                 assumptions [14].
(EG) and Maximum Likelihood (ML) methods to estimate                      Rt was estimated by Eq. (1) which can be explained as
R0.                                                                   the ratio of the number of new infections generated in step

                                                                                                                       123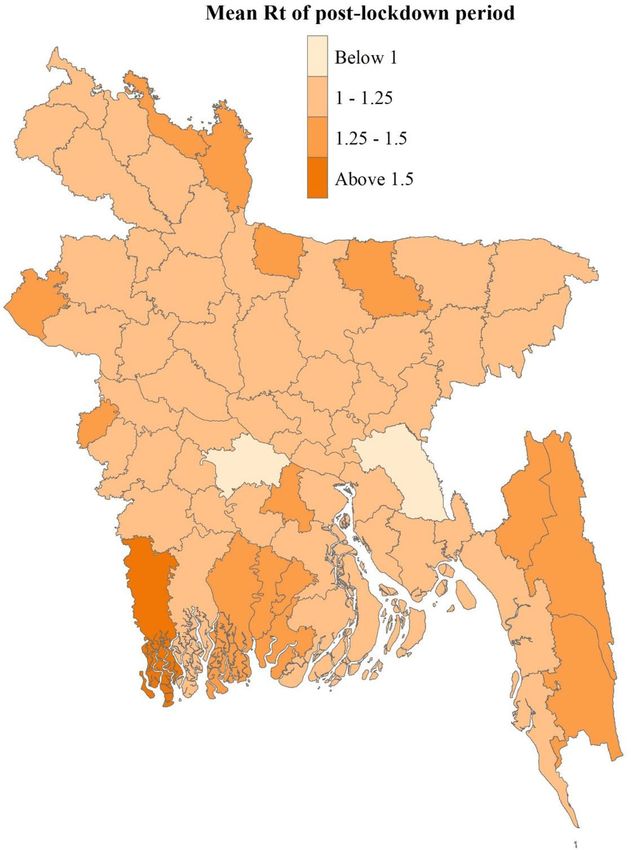
A.E. Hridoy et al.

t, It, to the total infectiousness of infected individuals at       Bangladesh. Thus, we have adopted eleven published lit-
time t, the sum of infection incidence up to the time step t-       erature with parameterized serial intervals [13, 19]. To
a, weighted by the infectivity function ws [15].                    estimate the effectiveness of lockdown measures, the mean
       X
       t                                                            Rt before lockdown (early March to late March 2020) and
Rt ¼         Ita ws                                        ð1Þ     consecutive 15 days Rt of lockdown period from late
       s¼1                                                          March to late May 2020 has been considered.
    The estimate-R function in the EpiEstim library [12]
assumes a gamma distribution of the serial interval and             2.3.3 Simple linear regression
models the transmission of the infection using a Poisson
likelihood to estimate the effective reproduction number            To assess the correlation between COVID-19 incidence
[16]. We used a discrete gamma distribution with a mean             and population density, we employed simple linear
of 4.7 days and a standard deviation of 2.9 [17]. The Rt was        regression as the following Eq. (2).
estimated on a 7-day sliding window to account for dis-             Y ¼ b0 þ b1 :PD þ e                                       ð2Þ
creteness in data. All analyses were carried out in R sta-
                                                                    where Y denotes total confirmed cases per million as a
tistical software and graphical presentations in Python 3
                                                                    dependent variable, b0 is the regression intercept, PD is the
and ArcGIS 10.5.
                                                                    population density as an independent variable, b1 is the
                                                                    regression coefficient and e is the error term.
2.3.2 Serial interval and effectiveness of lockdown

A few epidemiological quantities are needed to understand
                                                                    3 Results
and quantify the transmissibility of a novel infectious dis-
ease, such as the distribution of the generation time, serial
                                                                    3.1 COVID-19 scenario in Bangladesh
interval and incubation period. However, generation time
often difficult to find out in early outbreaks; thus, the
                                                                    The monthly change of COVID-19 dynamics in Bangla-
generation time has been approximated by the serial
                                                                    desh is illustrated in Fig. 2. The number of cases has
interval [18]. Since, there is no published literature on
                                                                    increased from May, and a higher number of cases was
generation time and serial interval time of COVID-19 in
                                                                    observed in June and July, indicating a fully propagated

Fig. 2 The dynamics of COVID-19 in Bangladesh. The total monthly cases are in logarithmic scale Log(N ? 1)

123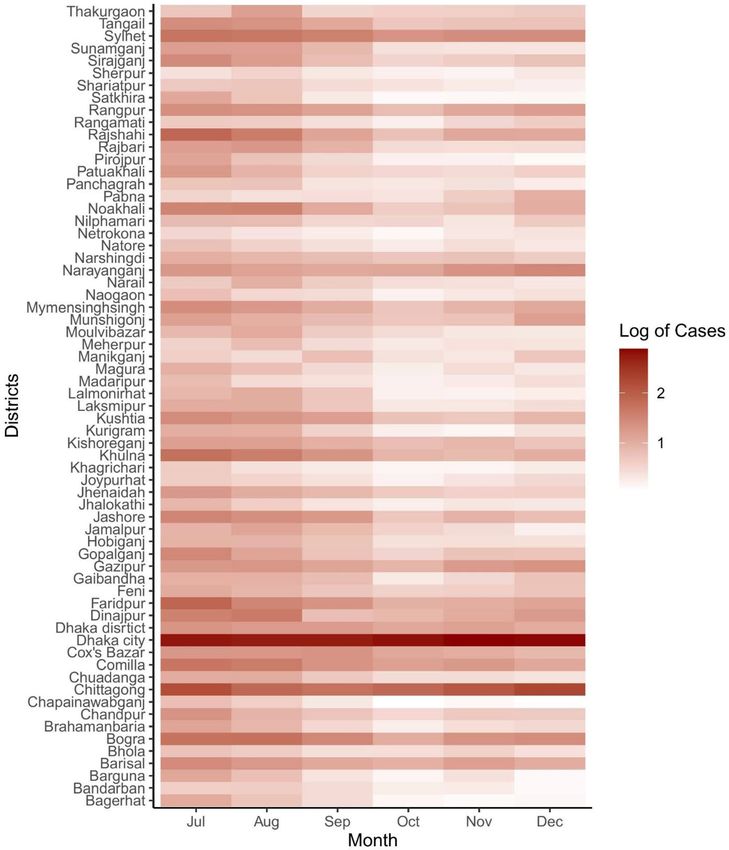
Spatio-temporal estimation of basic and effective reproduction number of COVID-19 and…

epidemic. However, the number of cases declined from                 Dhaka city has recorded the highest number of cases with
September 2020.                                                      an almost homogeneous pattern. From July to August,
   The COVID-19 scenarios in 64 administrative districts             Mymensingh faced the highest number of incidents, and a
of Bangladesh under eight divisions are shown in Fig. 3.             substantial increase started in November. Bogura and
Barishal has tallied the highest number of cases from July           Rajshahi had a maximum number of cases from July to
to September and declined from December. Chittagong                  August. Dinajpur had a higher number of daily confirmed
district has faced the maximum number of cases, a                    cases from July to August. A higher number of cases have
notable declination has been seen from July to October, but          been recorded in Sylhet from July to September.
a substantial increase started from December. In Khulna,
maximum number of cases ranged from July to September.

Fig. 3 District-wise dynamics of COVID-19 cases transformed in logarithmic scale of Log(N ? 1)

                                                                                                                   123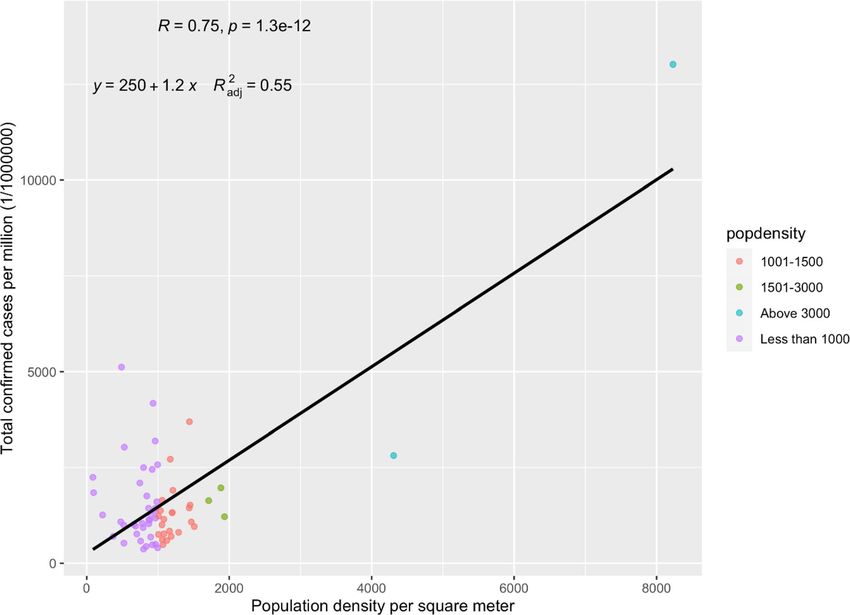
A.E. Hridoy et al.

3.2 Basic (R0) and effective reproduction number                 Shariatpur, and Sherpur). Bagerhat showed a sharp increase
    (Rt) in Bangladesh                                           in October and early-December and declined to 1.5 in mid-
                                                                 December. Chapainawabganj reached 3.0 in late-October
From Table 1, the overall R0 in Bangladesh is assumed to         and remained above 2.0 in mid-December. Satkhira fluc-
vary around 2.02(1.33–3.28, 95% CI). The overall means           tuated between 1.5 and 3.2 from October to December.
under Log-Normal and Gamma distributions were 2.01               Other districts either decreased monotonically or remained
(1.16, 3.29, 95% CI) and 2.02 (1.51, 3.26, 95% CI),              stable. A noticeable decrease can be seen in Pabna and
respectively (Table 1).                                          Panchagarh districts.
    Bangladesh observed a maximum value of Rt 4.15 (3.43,
4.97, 95% CI) in late March 2020. A gradual decrease of Rt       3.3 Spatial trend of monthly effective reproduction
has been observed from April 1 to April 20, 2020. How-               number across Bangladesh
ever, Rt increased from late April 2020 and started to
decrease in mid-May. The Rt remained below 1 from mid-           Spatial distribution of mean monthly Rt shows how the
June to end of July. For a shorter period Rt was above 1 in      spread shaped from July to December in Bangladesh
early August. The Rt reached above 1 from late October to        (Fig. 6). Between July and September, Rt fluctuated
mid-November 2020 and was below 1 from early                     between below 1 and 1.5 for most of the districts which
December 2020 to end of January 2021. However, an                ramped up in October. In October, Rt fluctuated between 1
upheaval of Rt above 1 has been seen from early February         and above 2 for almost all districts where the north-western
2021 (Fig. 4).                                                   (Chapainowabgonj), the south-western (Satkhira) and
    Figure 5 shows Rt trends at district-level from early July   northern (Mymensingh) districts had Rt above 2. In
to mid-December 2020. Rt showed a monotonic increase             November, Rt fluctuated between 1.5 and above 2 for the
throughout the period and remained above 1.5 in 11 dis-          south-western (Sathkhira and Bagerhat), the north-western
tricts (Bagerhat, Bandarban, Chapainawabganj, Joypurhat,         (Chapainowabgonj), northern (Lalmonirhat, Nilphamari
Narail, Netrokona, Pirojpur, Rangamati, Satkhira,                and Pirojpur) and south-eastern (Khagrachari) districts. In

Table 1 Estimates of R0 for
                                  Serial intervals                   Method            Estimated R0 (95% CI)
COVID-19 in Bangladesh at
different serial interval using                                                        Log-Normal                Gamma
exponential growth (EG) and
maximum likelihood estimate       Mean = 6.3, SD = 4.2 [20]          EG                1.91(0.94,3.49)           1.90(0.94,3.41)
(MLE) methods                                                        MLE               2.76(1.65,4.30)           2.75(1.64,4.27)
                                  Mean = 4.7, SD = 2.9 [17]          EG                1.67(0.95,2.77)           1.67(0.95,2.75)
                                                                     MLE               2.14(1.27,3.31)           2.15(1.29,3.34)
                                  Mean = 3.96, SD = 4.75 [21]        EG                1.51(0.95,2.19)           1.61(0.95,2.41)
                                                                     MLE               1.74(1.03,2.70)           1.93(1.15,3.00)
                                  Mean = 4.4, SD = 3.0 [22]          EG                1.61(0.95,2.57)           1.62(0.95,2.58)
                                                                     MLE               1.99(1.19,3.10)           2.02(1.20,3.14)
                                  Mean = 5.29, SD = 5.34 [23]        EG                1.67(0.94,2.65)           1.74(0.94,2.76)
                                                                     MLE               2.09(1.25,3.26)           2.22(1.32,3.45)
                                  Mean = 5.2, SD = 1.72 [24]         EG                1.80(0.95,3.38)           1.74(0.94,2.76)
                                                                     MLE               2.51(1.5,3.90)            2.22(1.32,3.45)
                                  Mean = 3.95, SD = 1.51 [24]        EG                1.58(0.96,2.58)           1.58(0.96,2.58)
                                                                     MLE               1.93(1.15,3.00)           1.93(1.15,2.99)
                                  Mean = 6.7, SD = 5.2 [13]          EG                1.93(0.93,3.49)           1.93(0.93,3.40)
                                                                     MLE               2.78(1.66,4.32)           2.76(1.65,4.29)
                                  Mean = 4.56, SD = 0.95 [25]        EG                1.70(0.95,3.06)           1.70(0.95,3.06)
                                                                     MLE               2.20(1.31,3.42)           2.20(1.31,3.42)
                                  Mean = 4.22, SD = 0.4 [25]         EG                1.65(0.96,2.88)           1.64(0.95,2.88)
                                                                     MLE               2.07(1.24,3.22)           2.04(1.23,3.21)
                                  Mean = 7.0, SD = 4.5 [26]          EG                2.03(0.93,3.94)           2.02(0.93,3.81)
                                                                     MLE               3.16(1.89,4.92)           3.12(1.86,4.85)
                                  Overall                                              2.01(1.16,3.29)           2.02 (1.51,3.26)

123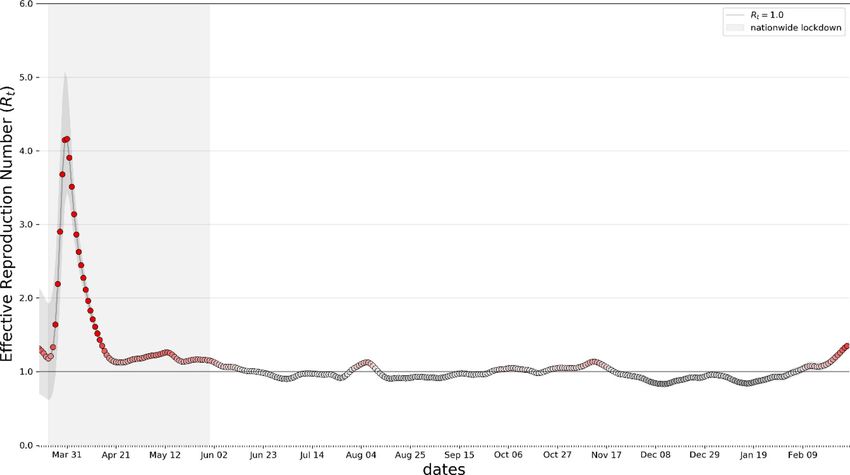
Spatio-temporal estimation of basic and effective reproduction number of COVID-19 and…

Fig. 4 Effective reproduction number (Rt) changes of Bangladesh. The grey regions (Mar–May) show nation-wide lockdown phase

December, south-western (Sathkhira) and north-western               3.5 Correlation between COVID-19 cases
(Chapainowabgong) had Rt above 2.                                       and population density
   The mean Rt of post-lockdown period in Bangladesh is
shown in Fig. 7. The northern (Sherpur and Netrokona),              The correlation between population density and COVID-19
South-western (Satkhira and Bagerhat), and north-western            cases is shown in Fig. 8. A strong positive correlation was
(Chapainowabgonj) districts of Bangladesh had a higher              observed between COVID-19 incidence and population
mean Rt.                                                            density (Pearson’s correlation coefficient r = 0.75) with a
                                                                    statistical significance (p \ 0.001). The linear fit between
3.4 Effectiveness of lockdown measures                              population density and COVID-19 incidence exhibits a
    on the curtailment of COVID-19 transmission                     significant positive trend (p \ 0.001). The coefficient of
    in Bangladesh                                                   determination is 0.56, suggesting population density
                                                                    explains 56% of COVID-19 cases in Bangladesh.
Table 2 shows lockdown measures’ effectiveness on the
curtailment of COVID-19 transmission in Bangladesh. The
mean Rt at four lockdown interval periods in Bangladesh.            4 Discussion
At 15 days of the lockdown phase, the mean Rt was 2.16
(1.66–2.75, 95% CI), and an increasing trend of Rt was              The main focus of this study was to evaluate the effec-
observed at the 30 days of LD 2.37 (2.23–2.52,95% CI)               tiveness of containment measures in Bangladesh using R0
with a relative change of 9.72%. At 45 days of lockdown,            and Rt. This is probably the first study to estimate the
Rt plummeted to 1.24 (1.21–1.29, 95% CI) with a                     transmission potential and severity of COVID-19 outbreak
decreasing relative change of - 47.68%. However, the Rt             after the lockdown across Bangladesh. This study finds
increased to 1.29 during 60 days of LD (1.21–.29, 95%               preliminary R0 of Bangladesh was 2.02 (1.33–3.28,95%
CI), implying a 4.03% increase from 45 days of the LD               CI). Our results are similar to previously reported R0 in
phase. Considering the total effect of NPIs, containment            China [17, 27] and neighboring country India [28]. After a
measures are shown to be moderately effective in reducing           week of nation-wide lockdown, Rt decreased substantially
Rt by 24.03%.                                                       from early April 2020 in Bangladesh, which corroborates
                                                                    with those of [29, 30]. Our finding suggests that Bangla-
                                                                    desh has seen an upheaval of Rt in early February 2021,
                                                                    which corroborates with Abbott et al. [31].
                                                                       In response to transmission curtailment, preventive
                                                                    measures have been started in late March 2020 in

                                                                                                                         123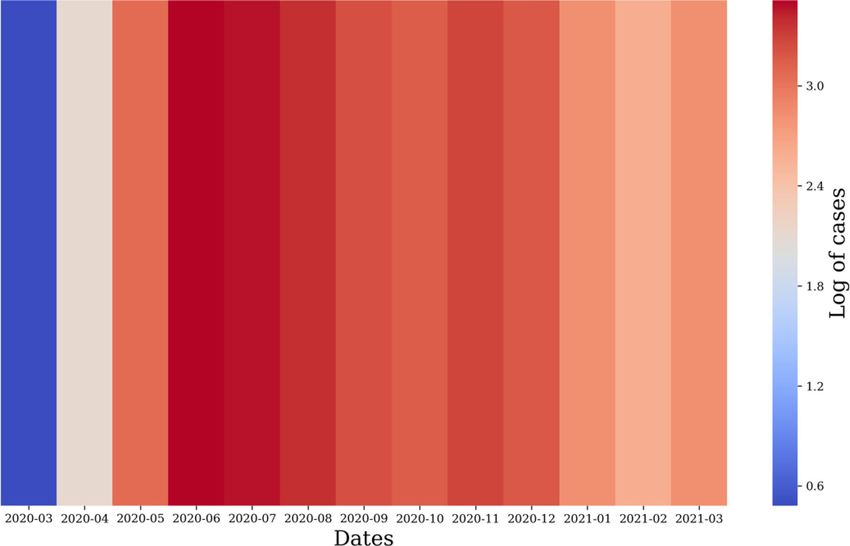
A.E. Hridoy et al.

Fig. 5 District-wise effective reproduction number (Rt) showing linear trend at 95% confidence interval

Bangladesh. A mass movement occurred by the people of                   increased COVID-19 testing charge by the government of
urban centers, particularly from Dhaka, since Dhaka City                Bangladesh (GoB) in late June. It is reported that daily
was the initial outbreak center. On March 25, 2020, the                 testing rates have dropped to 0.8 tests per 1000 people, and
Director of (IEDCR) suspected a limited community                       it declined to 0.06 tests per 1000 people in August [32].
transmission was occurring. However, by mid-April, they                    The spatial variation of SARS-CoV-2 transmission is
claimed community transmission went on a large scale. A                 observed across Bangladesh. The transmission dynamics
drastic drop in the testing quantity occurred because of the            might be modulated by several confounding factors (i.e.,

123
Spatio-temporal estimation of basic and effective reproduction number of COVID-19 and…

Fig. 6 Post-lockdown spatial trend of average monthly effective reproduction number (Rt) in Bangladesh at district scale

lockdown, socio-economic, socio-behavioral, bioclimatic,                reopened from May 24 2021, where precautions are more
other factors). Islam et al. [33] and Hridoy et al. [4] found a         convincible than schools and colleges. Additionally, the
profound effect of meteorological parameters on COVID-                  upcoming Eid-Ul-Fitr (one of the annual celebration days
19 transmission in Bangladesh. Population density is also               of Muslims) event should be under concern regarding the
an influential factor for COVID-19 transmission in Ban-                 event’s potentiality to accelerate the propagation rate of
gladesh [34, 35]. Due to poor socio-economic conditions,                COVID-19.
most of population tend to continue daily movements                        On 14 December 2020, a new SARS-CoV-2 variant
exacerbating transmission. This study suggests a strong                 referred to as SARS-CoV-2 VUI 202,012/01 (B.1.1.7) has
positive correlation between COVID-19 cases and popu-                   been identified in the United Kingdom of Great Britain and
lation density; this finding corroborates with prior resear-            Northern Ireland [41]. The authorities of Bangladesh did
ches in Bangladesh [35–37] and with other countries India               not reveal information about the new UK variant of SARS-
[38], USA [6], and Turkey [39]. Moreover, this study found              CoV-2 was first detected in Bangladesh in January 2021
correlation coefficient of 0.75 between population density              [42]. The new variant is estimated to be 70% more trans-
and COVID-19 cases and explaining 56% variation in                      missible than previous circulating variants [41]. Moreover,
Bangladesh.                                                             variant B.1.1.7 is 64% more lethal than the previously
   To curb the transmission of the contagious disease, the              circulating variants [43]. People who catch the new variant
GoB has announced a nation-wide general lockdown from                   are infected for a relatively long time [44]; thus, a more
March 26 to May 30, 2020, and then allowed to continue                  extended quarantine period might be warranted for pas-
all postponed works, excluding opening educational insti-               sengers coming from UK in Bangladesh. Moreover, phys-
tutions from May 31, 2020. It is reported that the govern-              ical distancing, wearing mask and washing hands practices
ment of Bangladesh (GoB) will reopen all educational                    are not properly maintained in Bangladesh [45]. Thus, with
institutions, excluding universities, from March 30, 2021,              the emergence of a new variant of SARS-CoV-2 and high
by giving COVID-19 vaccine to all teachers and staff                    population density, COVID-19 situation might aggravate in
except students who have age of under 18 years [40].                    Bangladesh.
However, mass mobility of susceptible students may                         In this study, 64 administrative districts of Bangladesh
spread the transmission. Furthermore, universities will be              have been analyzed to identify the areas with a higher

                                                                                                                           123
A.E. Hridoy et al. Fig. 7 Mean Rt of post- lockdown period in Bangladesh Table 2 Effectiveness of lockdown measures at different lockdown intervals Interval Effective reproduction number in Bangladesh (95% CI) Relative change (%) Total LD effectiveness Before LD 2.33(1.49–3.34) - 24.03% 15 days of LD 2.16 (1.66–2.75) - 7.29 30 days of LD 2.37 (2.23–2.52) 9.72 45 days of LD 1.24 (1.21–1.29) - 47.68 60 days of LD 1.29 (1.27–1.32) 4.03 During LD 1.77(1.55,1.77) 123
Spatio-temporal estimation of basic and effective reproduction number of COVID-19 and…

Fig. 8 Correlation between population density and COVID-19 cases

transmission rate. As the dynamism of COVID-19 varies               after mid-December 2020. Therefore, we could not esti-
from place to place, it is inevitable to monitor the micro          mate Rt after mid-December 2020. However, real-time
(district) level scenarios of transmission. This study high-        monitoring of disease transmission may provide valuable
lights the importance of real-time monitoring of COVID-             insights into COVID-19 dynamics in Bangladesh. Since the
19 transmission, which will help policymakers impose or             local transmission is sustained, tailored community mea-
ease containment measures regarding time and space.                 sures are needed to curb local outbreaks in Bangladesh.
Otherwise, a minor regional epidemic has the potentiality
to reintroduce an outbreak throughout the country. More-
over, the new variant of SARS-CoV-2 (B.1.1.7) might                 5 Conclusion
propagate locally and cause a sustained epidemic.
   Our study has some strengths and limitations. This study         The study estimated plausible R0 in the early outbreak and
incorporated a long durational observation of the Rt across         Rt in Bangladesh. The real-time monitoring of Rt helped us
Bangladesh and estimated a preliminary basic reproduction           to understand the effectiveness of containment measures
number utilizing different serial intervals. We had four            adopted by authorities. There is a spatial variation of
notable limitations. Firstly, we estimated the Rt using             SARS-CoV-2 transmission in 64 administrative districts of
diagnostic report date. However, the Rt should be estimated         Bangladesh. In August, Rt was above 1 for most districts
by symptom onset date. Secondly, the reproduction number            and fluctuated between 1 and above 2 for almost all dis-
estimation heavily depends on the generation time, which            tricts in October. Overall, the northern (Sherpur and
may be difficult to get early in an outbreak [46]. Regarding        Netrokona), south-western (Satkhira and Bagerhat), and
serial interval, as COVID-19 line-list data is not publicly         north-western (Chapainowabgonj) districts of Bangladesh
available, we have used serial interval time of other               had a higher mean Rt. This study indicated that the overall
countries, which may not reflect Bangladesh’s actual epi-           Rt of Bangladesh had declined to below 1 from early
demic scenario. Thirdly, Rt estimation might be biased by           December 2020. However, a gradual increase of Rt above 1
testing rate, delayed, inconsistent, under-reporting and            has been seen from early February 202. Moreover, real-
super-spreaders. Fourthly, district-wise data is not available      time monitoring of district-wise Rt suggests that there

                                                                                                                     123
A.E. Hridoy et al.
might be sustained epidemics in most districts. Since (COVID-19) in different provinces of Iran. Science of The Total
Bangladesh is amid COVID-19 outbreak and situation Environment, 728, 138872. https://doi.org/10.1016/j.scitotenv.
2020.138872.
might aggravate, real-time monitoring of transmissibility is 6. Wong, D. W. S., & Li, Y. (2020). Spreading of COVID-19:
necessary to adopt appropriate measures to contain the Density matters. PLoS ONE, 15(12), e0242398. https://doi.org/
transmission. 10.1371/journal.pone.0242398.
7. Adam, D. (2020). A guide to R—the pandemic’s misunderstood
Acknowledgements The authors would like to thank all the frontline metric. Nature, 583(7816), 346–348. https://doi.org/10.1038/
fighters, doctors, healthcare staffs, police forces fighting this pan- d41586-020-02009-w.
demic. We are also thankful to the reviewers for their thoughtful 8. IEDCR. (2020). District wise case number update. IEDCR.
suggestions. 9. BBS. (2011). Statistical yearbook of Bangladesh. Statistics
Division, Ministry of Planning, Government of the People’s
Republic of Bangladesh.
Author contributions Conceptualization and approval: Hridoy AE,
10. Obadia, T., Haneef, R., & Boëlle, P. Y. (2012). The R0 package:
Rahman SM; methodology: Hridoy AE, Rashid KJ, Naim M; soft-
A toolbox to estimate reproduction numbers for epidemic out-
ware: Hridoy AE, Rashid KJ, Sami MS; analysis: Hridoy AE, Tusher
breaks. BMC Medical Informatics and Decision Making, 12(1),
SMSH; data curation: Hridoy AE; validation: Hridoy AE, Rashid KJ,
1–9. https://doi.org/10.1186/1472-6947-12-147.
Rahman SM; draft preparation: Sami MS, Babu MR, Ahmed MS,
11. Fraser, C. (2007). Estimating individual and household repro-
Tipo IS; visualization: Hridoy AE, Rashid KJ, Naim M; review and
duction numbers in an emerging epidemic. PLoS One, 2(8), e758.
editing: Rahman SM, Sami MS, Babu MR, Tipo IS, Tusher SMSH,
https://doi.org/10.1371/journal.pone.0000758.
Ahmed MS, Rashid KJ; supervision: Rahman SM.
12. Cori, A., Ferguson, N. M., Fraser, C., & Cauchemez, S. (2013). A
new framework and software to estimate time-varying repro-
Funding This research did not receive any specific grant from duction numbers during epidemics. American Journal of Epi-
funding agencies in the public, commercial, or non-profit demiology, 178(9), 1505–1512. https://doi.org/10.1093/aje/
organizations. kwt133.
13. Rotejanaprasert, C., Lawpoolsri, S., Pan-Ngum, W., & Maude, R.
Data availability COVID-19 Data are available at Johns Hopkins J. (2020). Preliminary estimation of temporal and spatiotemporal
University’s GitHub repository (https://github.com/CSSEGI dynamic measures of COVID-19 transmission in Thailand. PLoS
SandData/COVID-19); District-wise COVID-19 incidences are ONE, 15(9), e0239645. https://doi.org/10.1371/journal.pone.
available at (https://docs.google.com/spreadsheets/d/e/2PACX- 0239645.
1vQgQAWwlQYF4XTxVT8sYP5wwqz_KxaWfVNQk9B0 14. Gostic, K. M., McGough, L., Baskerville, E. B., Abbott, S., Joshi,
FlyPPpDphAIv1cRIMV4ve_1gNbewGjcbkKNpi3Wm/pub?gid= K., Tedijanto, C., Kahn, R., Niehus, R., Hay, J. A., De Salazar, P.
624602850#); NPIs information is available at Github repository M., Hellewell, J., Meakin, S., Munday, J. D., Bosse, N. I., Sherrat,
Oxford Covid-19 Government Response Tracker (OxCGRT) ( https:// K., Thompson, R. N., White, L. F., Huisman, J. S., Scire, J., &
github.com/OxCGRT/covid-policy-tracker). Cobey, S. (2020). Practical considerations for measuring the
effective reproductive number, Rt. PLOS Computational Biology,
Declarations 16(12), e1008409. https://doi.org/10.1371/journal.pcbi.1008409.
15. Caicedo-Ochoa, Y., Rebellón-Sánchez, D. E., Peñaloza-Rallón,
Conflict of interest All authors declare that they have no competing M., Cortés-Motta, H. F., & Méndez-Fandiño, Y. R. (2020).
interests. Effective Reproductive Number estimation for initial stage of
COVID-19 pandemic in Latin American Countries. International
Consent to participate This study is categorized as low-risk, as only Journal of Infectious Diseases, 95, 316–318. https://doi.org/10.
aggregated, publicly-available incidence datasets were used. 1016/j.ijid.2020.04.069.
16. Al Wahaibi, A., Al Manji, A., Al Maani, A., Al Rawahi, B., Al
Harthy, K., Alyaquobi, F., Al-Jardani, A., Petersen, E., & Al
Abri, S. (2020). COVID-19 epidemic monitoring after non-
References pharmaceutical interventions: The use of time-varying repro-
duction number in a country with a large migrant population.
1. Delamater, P. L., Street, E. J., Leslie, T. F., Yang, Y. T., & International Journal of Infectious Diseases, 99, 466–472. https://
Jacobsen, K. H. (2019). Complexity of the basic reproduction doi.org/10.1016/j.ijid.2020.08.039.
number (R0). Emerging Infectious Diseases, 25(1), 1. https://doi. 17. Nishiura, H., Linton, N. M., & Akhmetzhanov, A. R. (2020).
org/10.3201/eid2501.171901. Serial interval of novel coronavirus (COVID-19) infections. In-
2. Anwar, S., Nasrullah, M., & Hosen, M. J. (2020). COVID-19 and ternational Journal of Infectious Diseases, 93, 284–286. https://
Bangladesh: challenges and how to address them. Frontiers in doi.org/10.1016/j.ijid.2020.02.060.
Public Health. https://doi.org/10.3389/2Ffpubh.2020.00154. 18. Knight, J., & Mishra, S. (2020). Estimating effective reproduction
3. Berkelman, R. L., Bryan, R. T., Osterholm, M. T., LeDuc, J. W., number using generation time versus serial interval, with appli-
& Hughes, J. M. (1994). Infectious disease surveillance: a cation to COVID-19 in the Greater Toronto Area, Canada. In-
crumbling foundation. Science, 264(5157), 368–370. fectious Disease Modelling, 5, 889–896. https://doi.org/10.1016/j.
4. Hridoy, A. E. E., Mohiman, M. A., Tusher, S. M. S. H., Nowraj, idm.2020.10.009.
S. Z. A., & Rahman, M. A. (2021). Impact of meteorological 19. Griffin, J., Casey, M., Collins, Á., Hunt, K., McEvoy, D., Byrne,
parameters on COVID-19 transmission in Bangladesh: A spa- A., McAloon, C., Barber, A., Lane, E. A., & More, S. (2020).
tiotemporal approach. Theoretical and Applied Climatology. Rapid review of available evidence on the serial interval and
https://doi.org/10.1007/s00704-021-03535-x. generation time of COVID-19. British Medical Journal Open,
5. Jahangiri, M., Jahangiri, M., & Najafgholipour, M. (2020). The 10(11), e040263. https://doi.org/10.1136/bmjopen-2020-040263.
sensitivity and specificity analyses of ambient temperature and 20. Bi, Q., Wu, Y., Mei, S., Ye, C., Zou, X., Zhang, Z., Liu, X., Wei,
population size on the transmission rate of the novel coronavirus L., Truelove, S. A., Zhang, T., Gao, W., Cheng, C., Tang, X., Wu,
123Spatio-temporal estimation of basic and effective reproduction number of COVID-19 and…
X., Wu, Y., Sun, B., Huang, S., Sun, Y., Zhang, J., & Feng, T. 32. Cousins, S. (2020). Bangladesh’s COVID-19 testing criticised.
(2020). Epidemiology and transmission of COVID-19 in 391 The Lancet, 396(10251), 591. https://doi.org/10.1016/S0140-
cases and 1286 of their close contacts in Shenzhen, China: A 6736(20)31819-5.
retrospective cohort study. The Lancet Infectious Diseases, 20(8), 33. Islam, A. R. M. T., Hasanuzzaman, M., Azad, M. A. K., Salam,
911–919. https://doi.org/10.1016/S1473-3099(20)30287-5. R., Toshi, F. Z., Khan, M. S. I., & Ibrahim, S. M. (2020). Effect
21. Du, Z., Xu, X., Wu, Y., Wang, L., Cowling, B. J., & Meyers, L. of meteorological factors on COVID-19 cases in Bangladesh.
A. (2020). Serial interval of COVID-19 among publicly reported Environment, Development and Sustainability. https://doi.org/10.
confirmed cases. Emerging Infectious Diseases, 26(6), 1341. 1007/s10668-020-01016-1.
22. Zhao, S., Gao, D., Zhuang, Z., Chong, M. K., Cai, Y., Ran, J., Cao, 34. Islam, A., Sayeed, M. A., Rahman, M. K., Ferdous, J., Islam, S.,
P., Wang, K., Lou, Y., Wang, W., Yang, L., He, D., & Wang, M. H. & Hassan, M. M. (2021). Geospatial dynamics of COVID-19
(2020). Estimating the serial interval of the novel coronavirus clusters and hotspots in Bangladesh. Transboundary and
disease (COVID-19): A statistical analysis using the public data in Emerging Diseases. https://doi.org/10.1111/tbed.13973.
Hong Kong from January 16 to February 15, 2020 [Preprint]. 35. Sarkar, S. K., Ekram, K. M. M., & Das, P. C. (2021). Spatial
Epidemiology. https://doi.org/10.1101/2020.02.21.20026559. modeling of COVID-19 transmission in Bangladesh. Spatial
23. Du, Z., Xu, X., Wu, Y., Wang, L., Cowling, B. J., & Meyers, L. Information Research. https://doi.org/10.1007/s41324-021-
A. (2020). COVID-19 serial interval estimates based on con- 00387-5.
firmed cases in public reports from 86 Chinese cities. MedRxiv. 36. Alam, M. Z. (2021). Is population density a risk factor for
https://doi.org/10.1101/2020.04.23.20075796. communicable diseases like covid-19? A case of bangladesh.
24. Ganyani, T., Kremer, C., Chen, D., Torneri, A., Faes, C., Wall- Asia Pacific Journal of Public Health. https://doi.org/10.1177/
inga, J., & Hens, N. (2020). Estimating the generation interval for 1010539521998858.
coronavirus disease (COVID-19) based on symptom onset data, 37. Sharif, N., & Dey, S. K. (2021). Impact of population density and
March 2020. Eurosurveillance, 25(17), 2000257. https://doi.org/ weather on COVID-19 pandemic and SARS-CoV-2 mutation
10.2807/1560-7917.ES.2020.25.17.2000257. frequency in Bangladesh. Epidemiology and Infection, 149, e16.
25. Tindale, L., Coombe, M., Stockdale, J. E., Garlock, E., Lau, W. https://doi.org/10.1017/S0950268821000029.
Y. V., Saraswat, M., & Colijn, C. (2020). Transmission interval 38. Bhadra, A., Mukherjee, A., & Sarkar, K. (2021). Impact of
estimates suggest pre-symptomatic spread of COVID-19. population density on Covid-19 infected and mortality rate in
MedRxiv. https://doi.org/10.1101/2020.03.03.20029983. India. Modeling Earth Systems and Environment, 7(1), 623–629.
26. Wu, J. T., Leung, K., Bushman, M., Kishore, N., Niehus, R., de https://doi.org/10.1007/s40808-020-00984-7.
Salazar, P. M., & Leung, G. M. (2020). Estimating clinical 39. Coşkun, H., Yıldırım, N., & Gündüz, S. (2021). The spread of
severity of COVID-19 from the transmission dynamics in Wuhan, COVID-19 virus through population density and wind in Turkey
China. Nature Medicine, 26(4), 506–510. https://doi.org/10.1038/ cities. Science of The Total Environment, 751, 141663. https://
s41591-020-0822-7. doi.org/10.1016/j.scitotenv.2020.141663.
27. Jung, S., Akhmetzhanov, A. R., Hayashi, K., Linton, N. M., 40. Rahman, K. N. (2021, February 27). Bangladesh set to inoculate
Yang, Y., Yuan, B., Kobayashi, T., Kinoshita, R., & Nishiura, H. teachers on priority basis ahead of school reopening. Bd-
(2020). Real-time estimation of the risk of death from novel news24.com. https://bdnews24.com/bangladesh/2021/02/27/ban
coronavirus (COVID-19) infection: Inference using exported gladesh-set-to-inoculate-teachers-on-priority-basis-ahead-of-
cases. Journal of Clinical Medicine, 9(2), 523. https://doi.org/10. school-reopening.
3390/jcm9020523. 41. World Health Organization. (2020, December 24). SARS-CoV-2
28. Gupta, M., Mohanta, S. S., Rao, A., Parameswaran, G. G., Variant – United Kingdom of Great Britain and Northern Ireland.
Agarwal, M., Arora, M., Mazumder, A., Lohiya, A., Behera, P., World Health Organization. https://www.who.int/csr/don/21-
Bansal, A., Kumar, R., Meena, V. P., Tiwari, P., Mohan, A., & december-2020-sars-cov2-variant-united-kingdom/en/.
Bhatnagar, S. (2021). Transmission dynamics of the COVID-19 42. Covid-19: New variant detected in 6 UK returnees. (2021, March
epidemic in India and modeling optimal lockdown exit strategies. 10). Dhaka Tribune. https://www.dhakatribune.com/world/europe/
International Journal of Infectious Diseases, 103, 579–589. 2021/03/10/covid-19-new-variant-detected-in-6-uk-returnees.
https://doi.org/10.1016/j.ijid.2020.11.206. 43. Challen, R., Brooks-Pollock, E., Read, J. M., Dyson, L., Tsaneva-
29. Nouvellet, P., Bhatia, S., Cori, A., Ainslie, K. E. C., Baguelin, Atanasova, K., & Danon, L. (2021). Increased hazard of mortality
M., Bhatt, S., Boonyasiri, A., Brazeau, N. F., Cattarino, L., in cases compatible with SARS-CoV-2 variant of concern
Cooper, L. V., Coupland, H., Cucunuba, Z. M., Cuomo-Dan- 202012/1-a matched cohort study. MedRxiv. https://doi.org/10.
nenburg, G., Dighe, A., Djaafara, B. A., Dorigatti, I., Eales, O. 1101/2021.02.09.21250937.
D., van Elsland, S. L., Nascimento, F. F., & Donnelly, C. A. 44. Nature Editorial. (2021, March 19). COVID research updates:
(2021). Reduction in mobility and COVID-19 transmission. Na- Older people are at higher risk of getting COVID twice. Na-
ture Communications, 12(1), 1090. https://doi.org/10.1038/ ture. https://doi.org/10.1038/d41586-020-00502-w.
s41467-021-21358-2. 45. Study: Over 60% people struggle to maintain social distancing in
30. Khan, I. M., Haque, U., Kaisar, S., & Rahman, M. S. (2021). A public. (2020, August 27). Dhaka Tribune. https://www.dhaka
computational modeling study of covid-19 in bangladesh. The tribune.com/health/2020/08/27/study-over-60-people-struggle-to-
American Journal of Tropical Medicine and Hygiene, 104(1), maintain-social-distancing-in-public.
66–74. https://doi.org/10.4269/ajtmh.20-0757. 46. Yuan, J., Li, M., Lv, G., & Lu, Z. K. (2020). Monitoring trans-
31. Abbott, S., Hellewell, J., Thompson, R. N., Sherratt, K., Gibbs, H. missibility and mortality of COVID-19 in Europe. International
P., Bosse, N. I., Munday, J. D., Meakin, S., Doughty, E. L., Chun, Journal of Infectious Diseases, 95, 311–315. https://doi.org/10.
J. Y., Chan, Y.-W.D., Finger, F., Campbell, P., Endo, A., Pear- 1016/j.ijid.2020.03.050.
son, C. A. B., Gimma, A., Russell, T., CMMID COVID mod-
elling group, Flasche, S., & Funk, S. (2020). Estimating the time-
varying reproduction number of SARS-CoV-2 using national and Publisher’s Note Springer Nature remains neutral with regard to
subnational case counts. Wellcome Open Research, 5, 112. jurisdictional claims in published maps and institutional affiliations.
https://doi.org/10.12688/wellcomeopenres.16006.2.
123You can also read